Reader small image

You're reading from  Hands-On Graph Analytics with Neo4j

Product typeBook
Published inAug 2020
PublisherPackt
ISBN-139781839212611
Edition1st Edition
Tools
Right arrow
Author (1)
Estelle Scifo
Estelle Scifo
author image
Estelle Scifo

Estelle Scifo possesses over 7 years experience as a data scientist, after receiving her PhD from the Laboratoire de lAcclrateur Linaire, Orsay (affiliated to CERN in Geneva). As a Neo4j certified professional, she uses graph databases on a daily basis and takes full advantage of its features to build efficient machine learning models out of this data. In addition, she is also a data science mentor to guide newcomers into the field. Her domain expertise and deep insight into the perspective of the beginners needs make her an excellent teacher.
Read more about Estelle Scifo

Right arrow
Using Graph-based Features in Machine Learning

In this chapter, we will take what you have learned about graphs, graph databases, and the different types of information that can be extracted from graph structures (node importance, communities, and node similarity) and learn how to integrate this knowledge into a machine learning pipeline to make predictions out of data. We will start by using a classical CSV file, containing information from a questionnaire, and recap the different steps of a data science project using this data as the central theme. We will then explore how to transform this data into a graph and how to characterize this graph using graph algorithms. Finally, we will learn how to automate graph processing using Python and the Neo4j Python driver.

The following topics will be covered in this chapter:

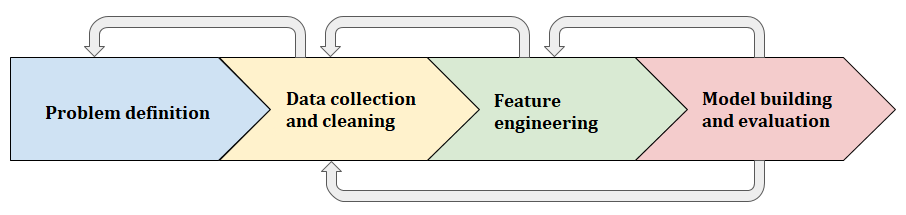
  • Building a data science pipeline
  • The steps toward graph machine...

Technical requirements

The following tools will be used throughout this chapter:

  • Neo4j with the Graph Data Science plugin
  • Python (recommended ≥ 3.6) with the following requirements:
  • neo4j, the official Neo4j Python driver (≥ 4.0.2)
  • networkx for graph management in Python (optional)
  • matplotlib and seaborn for data visualization
  • pandas
  • scikit-learn
  • Jupyter to run notebooks (optional)

If you are using Neo4j < 4.0, then the latest compatible version of the GDS plugin is 1.1, whereas if you are using Neo4j ≥ 4.0, then the first compatible version of the GDS plugin is 1.2.

Building a data science project

Machine learning can be defined as the process from which an algorithm learns from data in order to be able to extract information that is useful for some business or research interest.

Even though all data science projects are different, a certain number of common steps can still be identified:

  1. Problem definition
  2. Data collection and cleaning
  3. Feature engineering
  4. Model building and evaluation
  5. Deployment

Even if these steps follow a logical order, the process is never linear and consists of back and forth operations between these different steps. It can be useful to go back to the problem definition after the data collection phase, for example, as well as returning to the feature engineering and model evaluation phases as many times as required to reach the desired outcomes. The following diagram illustrates this idea of moving back and forth between the different steps of a project:

This project structure also applies when analyzing graph data, which...

The steps toward graph machine learning

Neo4j is primarily a database and can be used as such to fetch data. However, a change of perspective is needed to express the data as a graph, as well as to exploit this graph structure by using graph algorithms and formulating the problem as a graph problem.

Building a (knowledge) graph

When beginning to build a graph out of a dataset, the main question to ask is what are the relationships that exist in this data? If we consider the CSV file we studied in the previous section alone, it does not contain a lot of information about relationships since it only has aggregated data, such as the number of followers per user.

To learn more about relationships in the data, we will have to enrich this dataset. This can be done in two ways. Either we can use an external data source as we did in Chapter 3, Empowering Your Business with Pure Cypher, or we can transform the way we see our relational data.

Creating relationships from existing data

Data can come...

Using graph-based features with pandas and scikit-learn

In the previous section, we created a graph model connecting our users. We have also run some graph algorithms to understand the graph structure. We are now going to take full advantage of the GDS to extract graph-based features.

Extracting graph-based features from Neo4j Browser

In a prototyping phase, it is always good to be able to run single queries manually and extract the data from there. In the following subsections, we are going to review how to run graph algorithms from the GDS in Neo4j Browser and how to extract the data into a format usable by our data science tools – namely, CSV.

Creating the projected graph

We could create a named projected graph using the same parameters as in the previous section:

nodeProjection: "User",
relationshipProjection: {
FOLLOWS: {
type: "FOLLOWS",
orientation: "UNDIRECTED",
aggregation: "SINGLE"
}
}

However, we know that our graph contains several disconnected...

Automating graph-based feature creation with the Neo4j Python driver

Using Cypher to create our features is good for testing, but once we are in the production phase, it is not manageable to manually perform such operations. Fortunately, Neo4j officially provides drivers for several languages, including Java, .NET, and Go. In this book, we use Python, so we will learn about the Python driver in the following section.

Discovering the Neo4j Python driver

Python is officially supported by Neo4j, who provides a driver to connect to a Neo4j graph from Python at https://github.com/neo4j/neo4j-python-driver.

It can be installed through the pip Python package manager:

pip install neo4j
# or
conda install -c conda-forge neo4j
The code for this section is available in a Jupyter notebook: Neo4j_Python_Driver.ipynb.

In order to use this database, the first step is the connection definition, which requires the active graph URI and the authentication parameters. bolt is a client-server communication...

Summary

This chapter gave an overview of classical data science pipelines and how to integrate graph data into them. Thanks to the Neo4j Python driver, you are now able to import Neo4j data into a pandas DataFrame, which can then be used as usual in any other applications, such as model training with scikit-learn. You have also learned how to programmatically run a graph algorithm from the GDS and use the result as a new type of feature for your model.

In the following chapters, we will continue our journey through graph analytics. In this chapter, we stuck to classical machine learning methods such as decision trees. We will now go on to learn how the graph structure can be used to answer different kinds of questions, starting with the link prediction problem, which we are going to tackle in the next chapter.

Questions

Here are a couple of exercises that you can try on your own to get more confident with the concepts covered in this chapter:

  • Projected graph creation with Python: Modify the code studied in this chapter to create a Cypher projected graph.
  • PageRank score distribution: Can you explain the shape of the PageRank score distribution for users not contributing to Neo4j (label = False)?

You are also encouraged to try and create a graph out of your data and try to include graph-based features in your own pipeline.

Further reading

lock icon
The rest of the chapter is locked
You have been reading a chapter from
Hands-On Graph Analytics with Neo4j
Published in: Aug 2020Publisher: PacktISBN-13: 9781839212611
Register for a free Packt account to unlock a world of extra content!
A free Packt account unlocks extra newsletters, articles, discounted offers, and much more. Start advancing your knowledge today.
undefined
Unlock this book and the full library FREE for 7 days
Get unlimited access to 7000+ expert-authored eBooks and videos courses covering every tech area you can think of
Renews at $15.99/month. Cancel anytime

Author (1)

author image
Estelle Scifo

Estelle Scifo possesses over 7 years experience as a data scientist, after receiving her PhD from the Laboratoire de lAcclrateur Linaire, Orsay (affiliated to CERN in Geneva). As a Neo4j certified professional, she uses graph databases on a daily basis and takes full advantage of its features to build efficient machine learning models out of this data. In addition, she is also a data science mentor to guide newcomers into the field. Her domain expertise and deep insight into the perspective of the beginners needs make her an excellent teacher.
Read more about Estelle Scifo