Reader small image

You're reading from  F# for Machine Learning Essentials

Product typeBook
Published inFeb 2016
Reading LevelExpert
Publisher
ISBN-139781783989348
Edition1st Edition
Languages
Right arrow
Author (1)
Sudipta Mukherjee
Sudipta Mukherjee
author image
Sudipta Mukherjee

Sudipta Mukherjee was born in Kolkata and migrated to Bangalore. He is an electronics engineer by education and a computer engineer/scientist by profession and passion. He graduated in 2004 with a degree in electronics and communication engineering. He has a keen interest in data structure, algorithms, text processing, natural language processing tools development, programming languages, and machine learning at large. His first book on Data Structure using C has been received quite well. Parts of the book can be read on Google Books. The book was also translated into simplified Chinese, available from Amazon.cn. This is Sudipta's second book with Packt Publishing. His first book, .NET 4.0 Generics , was also received very well. During the last few years, he has been hooked to the functional programming style. His book on functional programming, Thinking in LINQ, was released in 2014. He lives in Bangalore with his wife and son. Sudipta can be reached via e-mail at sudipto80@yahoo.com and via Twitter at @samthecoder.
Read more about Sudipta Mukherjee

Right arrow

Chapter 2. Linear Regression

"Honey! How much will gasoline cost next year?"

Linear regression is a technique to predict the value of a feature/attribute in a continuous range. It is similar to classification in a way that both types of algorithms solve a similar problem. But classification yields a discrete value as the tag while regression tries to predict a real value. In this chapter, you will learn how linear regression works and how it can be used in real-life settings.

Objective


After reading this chapter, you will be able to understand how several linear regression algorithms work and how to tune your linear regression model. You will also learn to use some parts of Math.NET and Accord.NET, which make implementing some of the linear regression algorithms simple. Along the way, you will also learn how to use FsPlot to plot various charts. All source code is made available at https://gist.github.com/sudipto80/3b99f6bbe9b21b76386d.

Different types of linear regression algorithms


Based on the approach used and the number of input parameters, there are several types of linear regression algorithms to determine the real value of the target variable. In this chapter, you will learn how to implement the following algorithms using F#:

  • Simple Least Square Linear Regression

  • Multiple Linear Regression

  • Weighted Linear regression

  • Ridge Regression

  • Multivariate Multiple Linear Regression

These algorithms will be implemented using a robust industry standard open source .NET mathematics API called Math.NET. Math.NET has an F# friendly wrapper.

APIs used


In this chapter, you will learn how to use the preceding APIs to solve problems using several linear regression methods and plot the result.

FsPlot is a charting library for F# to generate charts using industry standard JavaScript charting APIs, such as HighCharts. FsPlot provides a nice interface to generate several combination charts, which is very useful when trying to understand the linear regression model. You can find more details about the API at its homepage at https://github.com/TahaHachana/FsPlot.

Math.NET Numerics for F# 3.7.0

Math.NET Numerics is the numerical foundation of the Math.NET project, aiming to provide methods and algorithms for numerical computations in science, in engineering, and in everyday use. It supports F# 3.0 on .Net 4.0, .Net 3.5, and Mono on Windows, Linux, and Mac; Silverlight 5 and Windows 8 with PCL portable profile 47; Android/iOS with Xamarin.

You can get the API from the NuGet page at https://www.nuget.org/packages/MathNet.Numerics.FSharp/. For...

The basics of matrices and vectors (a short and sweet refresher)


Using Math.Net numerics, you can create matrices and vectors easily. The following section shows how. However, before you can create the vector or the matrix using Math.NET API, you have to reference the library properly. The examples in this chapter run using the F# script.

You have to write the following code at the beginning of the file and then run these in the F# interactive:

Creating a vector

You can create a vector as follows:

The vector values must always be float as per Math.NET. Once you run this in the F# interactive, it will create the following output:

Creating a matrix

A matrix can be created in several ways using the Math.NET package. In the examples in this chapter, you will see the following ways most often:

  • Creating a matrix by hand: A matrix can be created manually using the Math.Net F# package, as follows:

    Once you run this, you will get the following in the F# interactive:

  • Creating a matrix from a list of rows...

QR decomposition of a matrix


The general linear regression model calculation requires us to find the inverse of the matrix, which can be computationally expensive for bigger matrices. A decomposition scheme, such as QR and SVD, helps in that regard.

QR decomposition breaks a given matrix into two different matrices—Q and R, such that when these two are multiplied, the original matrix is found.

In the preceding image, X is an n x p matrix with n rows and p columns, R is an upper diagonal matrix, and Q is an n x n matrix given by:

Here, Q1 is the first p columns of Q and Q2 is the last n – p columns of Q.

Using the Math.Net method QR you can find QR factorization:

Just to prove the fact that you will get the original matrix back, you can multiply Q and R to see if you get the original matrix back:

let myMatAgain = qr.Q * qr.R  

SVD of a matrix

SVD stands for Single Value Decomposition. In this a matrix, X is represented by three matrices (the definition of SVD is taken from Wikipedia).

Suppose M...

Linear regression method of least square


Let's say you have a list of data point pairs such as the following:

You want to find out if there are any linear relationships between and .

In the simplest possible model of linear regression, there exists a simple linear relationship between the independent variable (also known as the predictor variable) and the dependent variable (also known as the predicted or the target variable). The independent variable is most often represented by the symbol and the target variable is represented by the symbol . In the simplest form of linear regression, with only one predictor variable, the predicted value of Y is calculated by the following formula:

is the predicted variable for . Error for a single data point is represented by:

and are the regression parameters that can be calculated with the following formula.

The best linear model minimizes the sum of squared errors. This is known as Sum of Squared Error (SSE).

For the best model, the regression...

Finding linear regression coefficients using F#


The following is an example problem that can be solved using linear regression.

For seven programs, the amount of disk I/O operations and processor times were measured and the results were captured in a list of tuples. Here is that list: (14,2), (16,5),(27,7) (42,9), (39, 10), (50,13), (83,20). The task for linear regression is to fit a model for these data points.

For this experiment, you will write the solution using F# from scratch, building each block one at a time.

  1. Create a new F# program script in LINQPad as shown and highlighted in the following image:

  2. Add the following variables to represent the data points:

  3. Add the following code to find the values needed to calculate b0 and b1:

  4. Once you do this, you will get the following output:

The following is the final output we receive:

Now in order to understand how good your linear regression model fits the data, we need to plot the actual data points as scatter plots and the regression line as a straight...

Finding the linear regression coefficients using Math.NET


In the previous example, we used F# to obtain b0 and b1 from the first principal. However, we can use Math.NET to find these values for us. The following code snippet does that for us in three lines of code:

This produces the following result in the F# interactive:

Take a moment to note that the values are exactly the same as we calculated earlier.

Putting it together with Math.NET and FsPlot


In this example, you will see how Math.NET and FsPlot can be used together to generate the linear regression coefficients and plot the result. For this example, we will use a known relation between Relative Humidity (RH) and Dew point temperature. The relationship between relative humidity and dew point temperature is given by the following two formulas:

Here, t and td are the temperatures in degrees Celsius.

td is dew point, which is a measure of atmospheric moisture. It is the temperature to which the air must be cooled in order to reach saturation (assuming the air pressure and the moisture content are constant).

Let's say the dew point is 10 degrees Celsius, then we can see how linear regression can be used to find a relationship between the temperature and RH.

The following code snippet generates a list of 50 random temperatures and then uses the formula to find the RH. It then feeds this data into a linear regression system to find the best...

Multiple linear regression


Sometimes it makes more sense to include more predictors (that is, the independent variables) to find the value of the dependent variable (that is, the predicted variable). For example, predicting the price of a house based only on the total area is probably not a good idea. Maybe the price also depends on the number of bathrooms and the distance from several required facilities, such as schools, grocery stores, and so on.

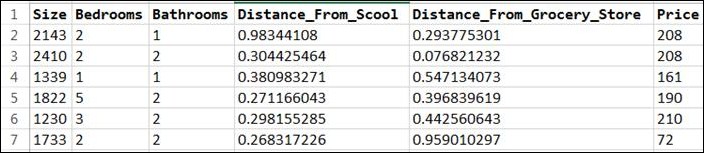
So we might have a dataset as shown next, and the problem we pose for our linear regression model is to predict the price of a new house given all the other parameters:

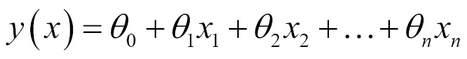
In this case, the model can be represented as a linear combination of all the predictors, as follows:

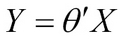
Here, the theta values represent the parameters we must select to fit the model. In vectorized form, this can be written as:

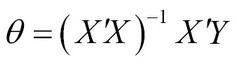
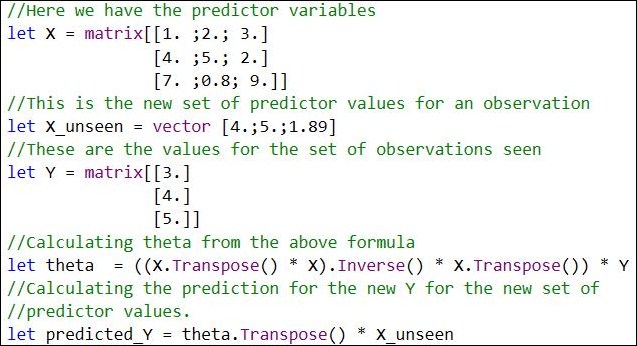
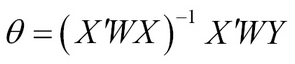
Theta can be calculated by the following formula:

So using the MathNet.Fsharp package, this can be calculated as follows:

Previously, in Chapter 1, Introduction...

Multiple linear regression and variations using Math.NET


As mentioned earlier, a regression model can be found using matrix decomposition such as QR and SVD.

The following code finds the theta from QR decomposition for the same data:

let qrlTheta = MultipleRegression.QR( created2 ,Y_MPG)

When run, this shows the following result in the F# interactive:

Now using these theta values, the predicted miles per gallon for the unknown car can be found by the following code snippet:

let mpgPredicted = qrlTheta * vector[8.;360.;215.;4615.;14.]

Similarly, SVD can be used to find the linear regression coefficients as done for QR:

let svdTheta = MultipleRegression.SVD( created2 ,Y_MPG)

Weighted linear regression


Sometimes each sample, or in other words, each row of the predictor variable matrix, is treated with different weightage. Normally, weights are given by a diagonal matrix where each element on the diagonal represent the weight for the row. If the weight is represented by W, then theta (or the linear regression coefficient) is given by the following formula:

Math.NET has a special class called WeightedRegression to find theta. If all the elements of the weight matrix are 1 then we have the same linear regression model as before.

The weight matrix is normally determined by taking a look at the new value for which the target variable has to be evaluated. If the new value is depicted as x, then the weights are normally calculated using the following formula:

The numerator of the weight matrix can be calculated as the Euclidean distance between two vectors. The first vector is from the training data and the other is the new vector depicting the new entry for which the...

Plotting the result of multiple linear regression


Using FsPlot, I plotted the data of the cars and the miles per gallon as a scatter plot:

So for each data point, I plotted a dot and then plotted the predicted value of the miles per gallon (the prediction was performed using multiple linear regression).

The following code renders the chart:

As a measure to find out whether the model is working better or not, you can find out the average residual value. A residual is the difference between the actual value and the predicted value. So for our example of miles per gallon dataset for multiple linear regression, the average residual can be calculated as follows:

When executed in the F# interactive, this produces the following output. To save space, I have taken only the first five rows.

From this you can see that for the first record, the actual MPG value was 18 and the predicted value was 15.377 roughly. So the residual for this entry is about 2.623. The smaller the average residual, the better the...

Ridge regression


Ridge regression is a technique to block the cases where X'X becomes singular. I is an identity matrix where all the elements in the diagonal are 1 and all the other elements are zero. is a user-defined scalar value and it is used to minimize the prediction error.

The following code snippet uses the house price example to find the theta using ridge regression model:

The price is a vector holding the price of all the houses.

  • is known as the Shrinkage Parameter
  • controls the size of the coefficients of theta
  • controls the amount of regularization

To obtain the value of , you have to break the training data into several sets and run the algorithm several times with several values of , and then find the one that is most sensible and reduces error the most. There are some techniques to find the value of using SVD but it's not proven to work all the time.

Multivariate multiple linear regression


When you want to predict multiple target values for the same set of predictor variables, you need to use multivariate multiple linear regression. Multivariate linear regression takes an array of a set of predictors and an associated list of outcomes for each of this predictor set of values.

In this example, we will use Accord.NET to find the relationships between several data:

  1. Get Accord Statistics via NuGet by giving the following command in PM console:

    PM> Install-Package Accord.Statistics -Version 2.15.0
    
  2. Once you install this package, the following code finds coefficients of the multivariate linear regression for sample data:

Feature scaling


If your features for linear regression are in different ranges, the result produced can be skewed. For example, if one of the features is in the range of 1 to 10 and the other is in the range of 3,000 to 50,000, then the predicted model will be bad. In such cases, the features must be rescaled so that they belong to almost the same range—ideally between 0 and 1.

The common strategy to scale a feature is to find the average and the range, and then using the following formula, all the values are updated:

In the preceding formula, is the mean or average of the values of feature and is the range or the standard deviation. The following code snippet shows how you can perform a feature scaling using F#.

You can calculate the feature scaling features by hand like this and then update the predictor matrix manually.

After the scaling, the house details matrix looks like this:

These values of the scaled matrix are very close to each other and thus the linear model generated.

Summary


In this chapter, you learned about several linear regression models. I hope you will find this information useful to solve some of your own practical problems. For example, you can predict your next electrical bill by doing a historical survey of your old bills. When not sure, start with a single predictor and gradually add more predictors to find a suitable model. Also, you can ask domain experts to locate predictor variables. Although there can be a temptation to use linear regression for prediction, don't give in. Linear regression can't work that way.

In the next chapter, you will learn about several supervised learning algorithms for classification. I hope you have enjoyed reading this chapter.

lock icon
The rest of the chapter is locked
You have been reading a chapter from
F# for Machine Learning Essentials
Published in: Feb 2016Publisher: ISBN-13: 9781783989348
Register for a free Packt account to unlock a world of extra content!
A free Packt account unlocks extra newsletters, articles, discounted offers, and much more. Start advancing your knowledge today.
undefined
Unlock this book and the full library FREE for 7 days
Get unlimited access to 7000+ expert-authored eBooks and videos courses covering every tech area you can think of
Renews at $15.99/month. Cancel anytime

Author (1)

author image
Sudipta Mukherjee

Sudipta Mukherjee was born in Kolkata and migrated to Bangalore. He is an electronics engineer by education and a computer engineer/scientist by profession and passion. He graduated in 2004 with a degree in electronics and communication engineering. He has a keen interest in data structure, algorithms, text processing, natural language processing tools development, programming languages, and machine learning at large. His first book on Data Structure using C has been received quite well. Parts of the book can be read on Google Books. The book was also translated into simplified Chinese, available from Amazon.cn. This is Sudipta's second book with Packt Publishing. His first book, .NET 4.0 Generics , was also received very well. During the last few years, he has been hooked to the functional programming style. His book on functional programming, Thinking in LINQ, was released in 2014. He lives in Bangalore with his wife and son. Sudipta can be reached via e-mail at sudipto80@yahoo.com and via Twitter at @samthecoder.
Read more about Sudipta Mukherjee