

Concepts and workflow of MLOps
In this section, we will learn about a generic MLOps workflow; it is the result of many design cycle iterations as discussed in the previous section. It brings together data engineering, ML, and DevOps in a streamlined fashion. Figure 1.10 is a generic MLOps workflow; it is modular and flexible and can be used to build proofs of concept or to operationalize ML solutions in any business or industry:
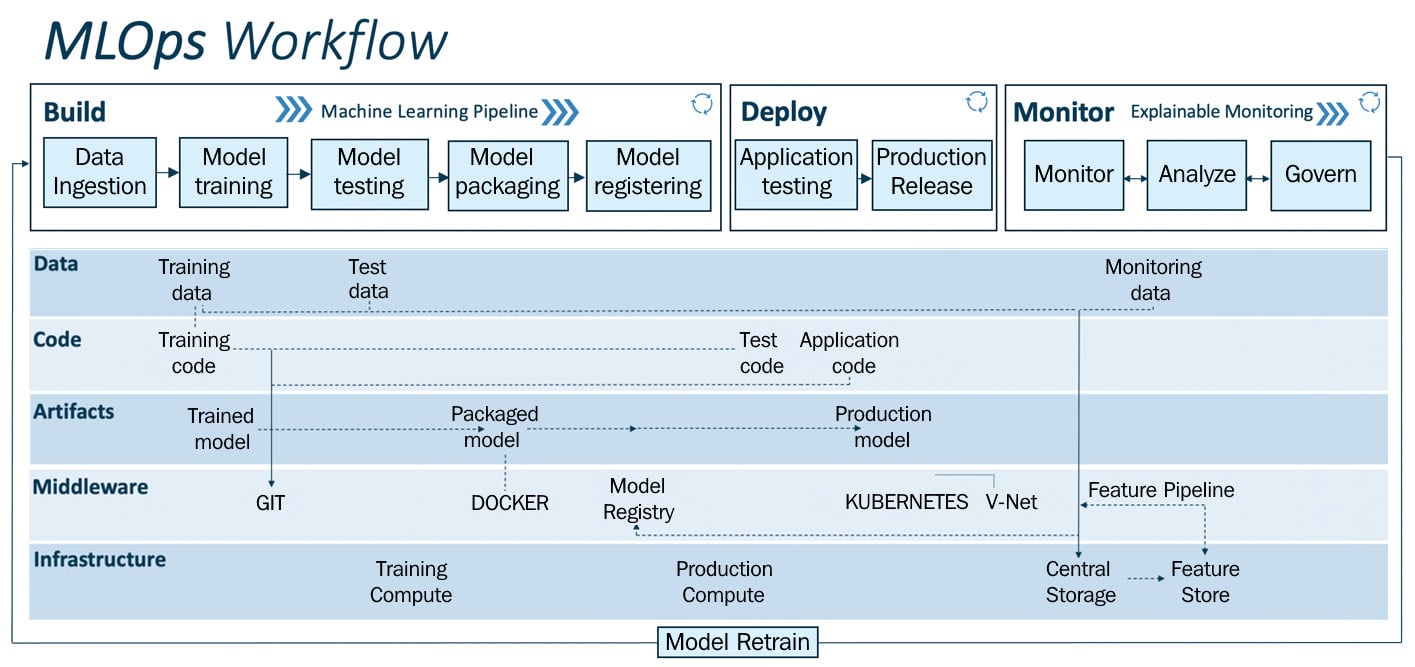
Figure 1.9 – MLOps workflow
This workflow is segmented into two modules:
- MLOps pipeline (build, deploy, and monitor) – the upper layer
- Drivers: Data, code, artifacts, middleware, and infrastructure – mid and lower layers
The upper layer is the MLOps pipeline (build, deploy, and monitor), which is enabled by drivers such as data, code, artifacts, middleware, and infrastructure. The MLOps pipeline is powered by an array of services, drivers, middleware, and infrastructure, and it crafts ML-driven solutions. By using this pipeline, a business or individual(s) can do quick prototyping, testing, and validating and deploy the model(s) to production at scale frugally and efficiently.
To understand the workings and implementation of the MLOps workflow, we will look at the implementation of each layer and step using a figurative business use case.
Discussing a use case
In this use case, we are to operationalize (prototyping and deploying for production) an image classification service to classify cats and dogs in a pet park in Barcelona, Spain. The service will identify cats and dogs in real time from the inference data coming from a CCTV camera installed in the pet park.
The pet park provide you access to the data and infrastructure needed to operationalize the service:
- Data: The pet park has given you access to their data lake containing 100,000 labeled images of cats and dogs, which we will use for training the model.
- Infrastructure: Public cloud (IaaS).
This use case resembles a real-life use case for operationalizing ML and is used to explain the workings and implementation of the MLOps workflow. Remember to look for an explanation for the implementation of this use case at every segment and step of the MLOps workflow. Now, let's look at the workings of every layer and step in detail.
The MLOps pipeline
The MLOps pipeline is the upper layer, which performs operations such as build, deploy, and monitor, which work modularly in sync with each other. Let's look into each module's functionality.
Build
The build module has the core ML pipeline, and this is purely for training, packaging, and versioning the ML models. It is powered by the required compute (for example, the CPU or GPU on the cloud or distributed computing) resources to run the ML training and pipeline:
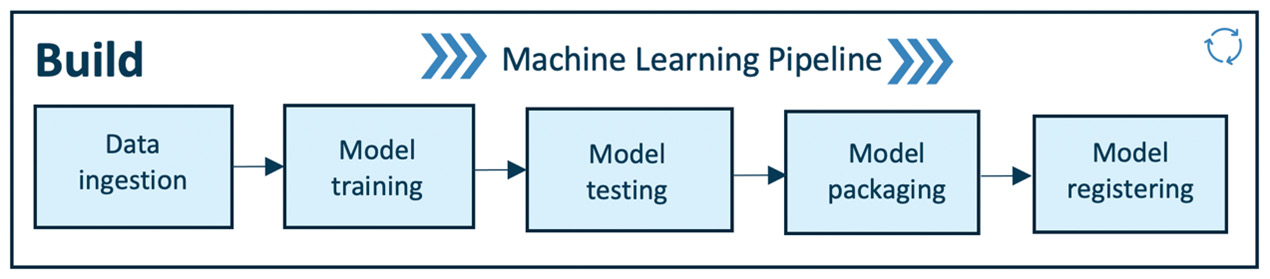
Figure 1.10 – MLOps – build pipeline
The pipeline works from left to right. Let's look at the functionality of each step in detail:
- Data ingestion: This step is a trigger step for the ML pipeline. It deals with the volume, velocity, veracity, and variety of data by extracting data from various data sources (for example, databases, data warehouses, or data lakes) and ingesting the required data for the model training step. Robust data pipelines connected to multiple data sources enable it to perform extract, transform, and load (ETL) operations to provide the necessary data for ML training purposes. In this step, we can split and version data for model training in the required format (for example, the training or test set). As a result of this step, any experiment (that is, model training) can be audited and is back-traceable.
For a better understanding of the data ingestion step, here is the previously described use case implementation:
Use case implementation
As you have access to the pet park's data lake, you can now procure data to get started. Using data pipelines (part of the data ingestion step), you do the following:
1. Extract, transform, and load 100,000 images of cats and dogs.
2. Split and version this data into a train and test split (with an 80% and 20% split).
Versioning this data will enable end-to-end traceability for trained models.
Congrats – now you are ready to start training and testing the ML model using this data.
- Model training: After procuring the required data for ML model training in the previous step, this step will enable model training; it has modular scripts or code that perform all the traditional steps in ML, such as data preprocessing, feature engineering, and feature scaling before training or retraining any model. Following this, the ML model is trained while performing hyperparameter tuning to fit the model to the dataset (training set). This step can be done manually, but efficient and automatic solutions such as Grid Search or Random Search exist. As a result, all important steps of ML model training are executed with a ML model as the output of this step.
Use case implementation
In this step, we implement all the important steps to train the image classification model. The goal is to train a ML model to classify cats and dogs. For this case, we train a convolutional neural network (CNN – https://towardsdatascience.com/wtf-is-image-classification-8e78a8235acb) for the image classification service. The following steps are implemented: data preprocessing, feature engineering, and feature scaling before training, followed by training the model with hyperparameter tuning. As a result, we have a CNN model to classify cats and dogs with 97% accuracy.
- Model testing: In this step, we evaluate the trained model performance on a separated set of data points named test data (which was split and versioned in the data ingestion step). The inference of the trained model is evaluated according to selected metrics as per the use case. The output of this step is a report on the trained model's performance.
Use case implementation
We test the trained model on test data (we split data earlier in the Data ingestion step) to evaluate the trained model's performance. In this case, we look for precision and the recall score to validate the model's performance in classifying cats and dogs to assess false positives and true positives to get a realistic understanding of the model's performance. If and when we are satisfied with the results, we can proceed to the next step, or else reiterate the previous steps to get a decent performing model for the pet park image classification service.
- Model packaging: After the trained model has been tested in the previous step, the model can be serialized into a file or containerized (using Docker) to be exported to the production environment.
Use case implementation
The model we trained and tested in the previous steps is serialized to an ONNX file and is ready to be deployed in the production environment.
- Model registering: In this step, the model that was serialized or containerized in the previous step is registered and stored in the model registry. A registered model is a logical collection or package of one or more files that assemble, represent, and execute your ML model. For example, multiple files can be registered as one model. For instance, a classification model can be comprised of a vectorizer, model weights, and serialized model files. All these files can be registered as one single model. After registering, the model (all files or a single file) can be downloaded and deployed as needed.
Use case implementation
The serialized model in the previous step is registered on the model registry and is available for quick deployment into the pet park production environment.
By implementing the preceding steps, we successfully execute the ML pipeline designed for our use case. As a result, we have trained models on the model registry ready to be deployed in the production setup. Next, we will look into the workings of the deployment pipeline.
Deploy
The deploy module enables operationalizing the ML models we developed in the previous module (build). In this module, we test our model performance and behavior in a production or production-like (test) environment to ensure the robustness and scalability of the ML model for production use. Figure 1.12 depicts the deploy pipeline, which has two components – production testing and production release – and the deployment pipeline is enabled by streamlined CI/CD pipelines connecting the development to production environments:
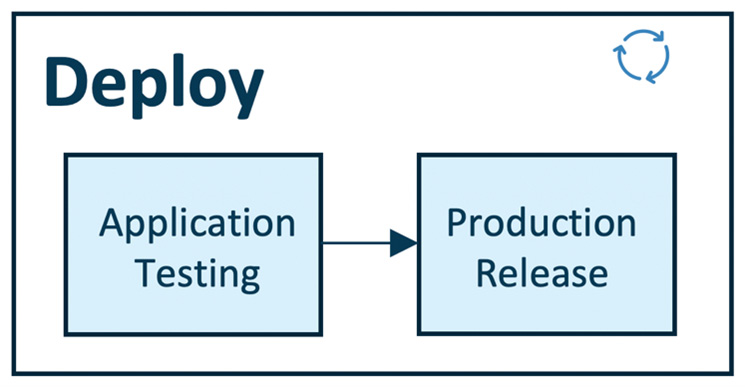
Figure 1.11 – MLOps – deploy pipeline
It works from left to right. Let's look at the functionality of each step in detail:
- Application testing: Before deploying an ML model to production, it is vital to test its robustness and performance via testing. Hence we have the "application testing" phase where we rigorously test all the trained models for robustness and performance in a production-like environment called a test environment. In the application testing phase, we deploy the models in the test environment (pre-production), which replicates the production environment.
The ML model for testing is deployed as an API or streaming service in the test environment to deployment targets such as Kubernetes clusters, container instances, or scalable virtual machines or edge devices as per the need and use case. After the model is deployed for testing, we perform predictions using test data (which is not used for training the model; test data is sample data from a production environment) for the deployed model, during which model inference in batch or periodically is done to test the model deployed in the test environment for robustness and performance.
The performance results are automatically or manually reviewed by a quality assurance expert. When the ML model's performance meets the standards, then it is approved to be deployed in the production environment where the model will be used to infer in batches or real time to make business decisions.
Use case implementation
We deploy the model as an API service on an on-premises computer in the pet park, which is set up for testing purposes. This computer is connected to a CCTV camera in the park to fetch real-time inference data to predict cats or dogs in the video frames. The model deployment is enabled by the CI/CD pipeline. In this step, we test the robustness of the model in a production-like environment, that is, whether the model is performing inference consistently, and an accuracy, fairness, and error analysis. At the end of this step, a quality assurance expert certifies the model if it meets the standards.
- Production release: Previously tested and approved models are deployed in the production environment for model inference to generate business or operational value. This production release is deployed to the production environment enabled by CI/CD pipelines.
Use case implementation
We deploy a previously tested and approved model (by a quality assurance expert) as an API service on a computer connected to CCTV in the pet park (production setup). This deployed model performs ML inference on the incoming video data from the CCTV camera in the pet park to classify cats or dogs in real time.
Monitor
The monitor module works in sync with the deploy module. Using explainable monitoring (discussed later in detail, in Chapter 11, Key Principles for Monitoring Your ML System), we can monitor, analyze, and govern the deployed ML application (ML model and application). Firstly, we can monitor the performance of the ML model (using pre-defined metrics) and the deployed application (using telemetry data). Secondly, model performance can be analyzed using a pre-defined explainability framework, and lastly, the ML application can be governed using alerts and actions based on the model's quality assurance and control. This ensures a robust monitoring mechanism for the production system:
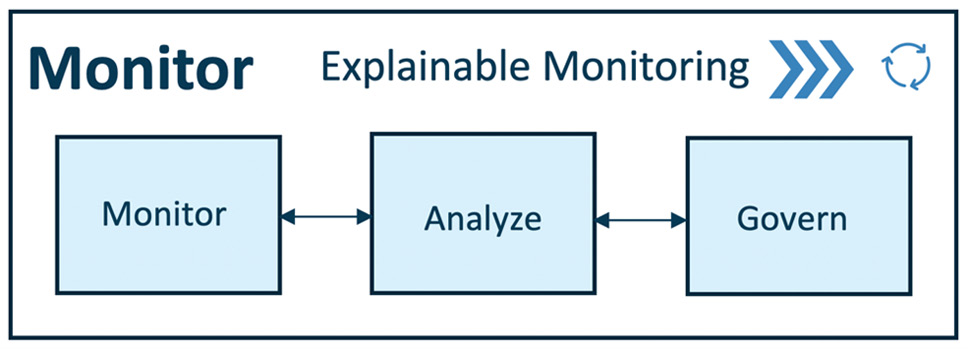
Figure 1.12 – MLOps – monitor pipeline
Let's see each of the abilities of the monitor module in detail:
- Monitor: The monitoring module captures critical information to monitor data integrity, model drift, and application performance. Application performance can be monitored using telemetry data. It depicts the device performance of a production system over a period of time. With telemetry data such as accelerometer, gyroscope, humidity, magnetometer, pressure, and temperature we can keep a check on the production system's performance, health, and longevity.
Use case implementation
In real time, we will monitor three things – data integrity, model drift, and application performance – for the deployed API service on the park's computer. Metrics such as accuracy, F1 score, precision, and recall are tracked to data integrity and model drift. We monitor application performance by tracking the telemetry data of the production system (the on-premises computer in the park) running the deployed ML model to ensure the proper functioning of the production system. Telemetry data is monitored to foresee any anomalies or potential failures and fix them in advance. Telemetry data is logged and can be used to assess production system performance over time to check its health and longevity.
- Analyze: It is critical to analyze the model performance of ML models deployed in production systems to ensure optimal performance and governance in correlation to business decisions or impact. We use model explainability techniques to measure the model performance in real time. Using this, we evaluate important aspects such as model fairness, trust, bias, transparency, and error analysis with the intention of improving the model in correlation to business.
Over time, the statistical properties of the target variable we are trying to predict can change in unforeseen ways. This change is called "model drift," for example, in a case where we have deployed a recommender system model to suggest suitable items for users. User behavior may change due to unforeseeable trends that could not be observed in historical data that was used for training the model. It is essential to consider such unforeseen factors to ensure deployed models provide the best and most relevant business value. When model drift is observed, then any of these actions should be performed:
a) The product owner or the quality assurance expert needs to be alerted.
b) The model needs to be switched or updated.
c) Re-training the pipeline should be triggered to re-train and update the model as per the latest data or needs.
Use case implementation
We monitor the deployed model's performance in the production system (a computer connected to the CCTV in the pet park). We will analyze the accuracy, precision, and recall scores for the model periodically (once a day) to ensure the model's performance does not deteriorate below the threshold. When the model performance deteriorates below the threshold, we initiate system governing mechanisms (for example, a trigger to retrain the model).
- Govern: Monitoring and analyzing is done to govern the deployed application to drive optimal performance for the business (or the purpose of the ML system). After monitoring and analyzing the production data, we can generate certain alerts and actions to govern the system. For example, the product owner or the quality assurance expert gets alerted when model performance deteriorates (for example, low accuracy, high bias, and so on) below a pre-defined threshold. The product owner initiates a trigger to retrain and deploy an alternative model. Lastly, an important aspect of governance is "compliance" with the local and global laws and rules. For compliance, model explainability and transparency are vital. For this, model auditing and reporting are done to provide end-to-end traceability and explainability for production models.
Use case implementation
We monitor and analyze the deployed model's performance in the production system (a computer connected to the CCTV in the pet park). Based on the analysis of accuracy, precision, and recall scores for the deployed model, periodically (once a day), alerts are generated when the model's performance deteriorates below the pre-defined threshold. The product owner of the park generates actions, and these actions are based on the alerts. For example, an alert is generated notifying the product owner that the production model is 30% biased to detect dogs more than cats. The product owner then triggers the model re-training pipeline to update the model using the latest data to reduce the bias, resulting in a fair and robust model in production. This way, the ML system at the pet park in Barcelona is well-governed to serve the business needs.
This brings us to the end of the MLOps pipeline. All models trained, deployed, and monitored using the MLOps method are end-to-end traceable and their lineage is logged in order to trace the origins of the model, which includes the source code the model used to train, the data used to train and test the model, and parameters used to converge the model. Full lineage is useful to audit operations or to replicate the model, or when a blocker is hit, the logged ML model lineage is useful to backtrack the origins of the model or to observe and debug the cause of the blocker. As ML models generate data in production during inference, this data can be tied to the model training and deployment lineage to ensure the end-to-end lineage, and this is important for certain compliance requirements. Next, we will look into key drivers enabling the MLOps pipeline.
Drivers
These are the key drivers for the MLOps pipeline: data, code, artifacts, middleware, and infrastructure. Let's look into each of the drivers to get an overview of how they enable the MLOps pipeline:
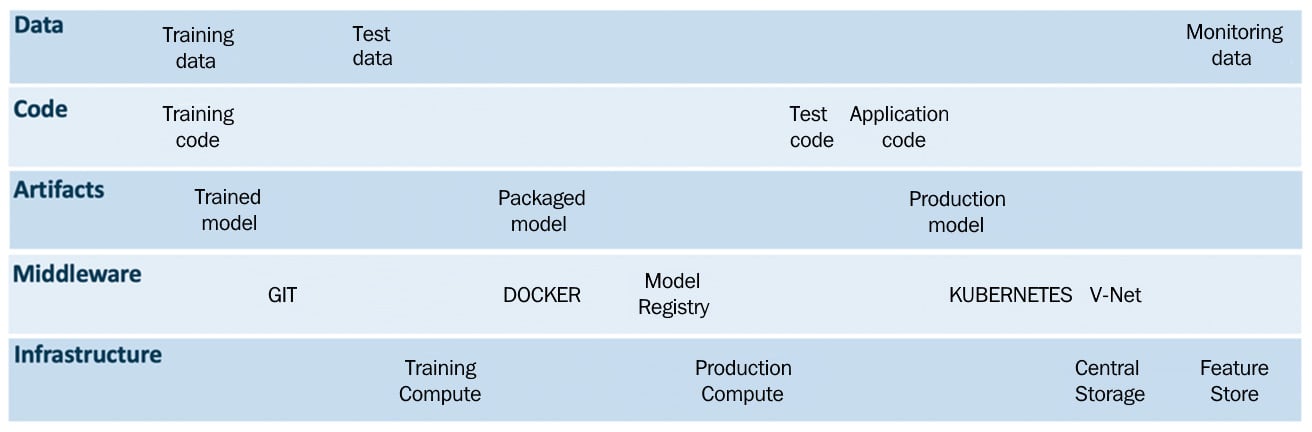
Figure 1.13 – MLOps drivers
Each of the key drivers for the MLOps pipeline are defined as follows:
- Data: Data can be in multiple forms, such as text, audio, video, and images. In traditional software applications, data quite often tends to be structured, whereas, for ML applications, it can be structured or unstructured. To manage data in ML applications, data is handled in these steps: data acquisition, data annotation, data cataloging, data preparation, data quality checking, data sampling, and data augmentation. Each step involves its own life cycle. This makes a whole new set of processes and tools necessary for ML applications. For efficient functioning of the ML pipeline, data is segmented and versioned into training data, testing data, and monitoring data (collected in production, for example, model inputs, outputs, and telemetry data). These data operations are part of the MLOps pipeline.
- Code: There are three essential modules of code that drive the MLOps pipeline: training code, testing code, and application code. These scripts or code are executed using the CI/CD and data pipelines to ensure the robust working of the MLOps pipeline. The source code management system (for example, using Git or Mercurial) will enable orchestration and play a vital role in managing and integrating seamlessly with CI, CD, and data pipelines. All of the code is staged and versioned in the source code management setup (for example, Git).
- Artifacts: The MLOps pipeline generates artifacts such as data, serialized models, code snippets, system logs, ML model training, and testing metrics information. All these artifacts are useful for the successful working of the MLOps pipeline, ensuring its traceability and sustainability. These artifacts are managed using middleware services such as the model registry, workspaces, logging services, source code management services, databases, and so on.
- Middleware: Middleware is computer software that offers services to software applications that are more than those available from the operating systems. Middleware services ensure multiple applications to automate and orchestrate processes for the MLOps pipeline. We can use a diverse set of middleware software and services depending on the use cases, for example, Git for source code management, VNets to enable the required network configurations, Docker for containerizing our models, and Kubernetes for container orchestration to automate application deployment, scaling, and management.
- Infrastructure: To ensure the successful working of the MLOps pipeline, we need essential compute and storage resources to train Test and deploy the ML models. Compute resources enable us to train, deploy and monitor our ML models. Two types of storages resources can facilitate ML operations, central storage and feature stores. A central storage stores the logs, artifacts, training, testing and monitoring data. A feature store is optional and complementary to central storage. It extracts, transforms and stores needed features for ML model training and inference using a feature pipeline. When it comes to the infrastructure, there are various options such as on-premises resources or infrastructure as a service (IaaS), which is cloud services. These days, there are many cloud players providing IaaS, such as Amazon, Microsoft, Google, Alibaba, and so on. Having the right infrastructure for your use case will enable robust, efficient, and frugal operations for your team and company.
A fully automated workflow is achievable with smart optimization and synergy of all these drivers with the MLOps pipeline. Some direct advantages of implementing an automated MLOps workflow is a spike in IT teams' efficiency (by reducing the time spent by data scientists and developers on mundane and repeatable tasks) and the optimization of resources, resulting in cost reductions, and both of these are great for any business.