


SAVE PLOT AS A PNG FILE
Listing 5.25 displays the contents of matplot2png.py that shows you how to save a graphics image as a PNG file.
Listing 5.25: matplot2png.py
import matplotlib.pyplot as plt
import numpy as np

outfile="graph1.png"

plt.figure()
plt.plot(range(6))

fig, ax = plt.subplots()

ax.plot([2, 3, 4, 5, 5, 6, 6],
       [5, 7, 1, 3, 4, 6 ,8])

ax.plot([1, 2, 3, 4, 5],
       [2, 3, 4, 5, 6])

x = np.linspace(0, 12, 100)
plt.plot(np.sin(x))
plt.plot(np.linspace(-4,4,50))

plt.savefig(outfile, dpi=300)
Listing 5.25 contains import statements, followed by the variable outfile that is initialized with the name of the PNG file that will be saved to the file system. The contents of the PNG file consist of a sine wave and a set of line segments. Launch the code in Listing 5.25 and you will see the image that is shown in Figure 5.17.
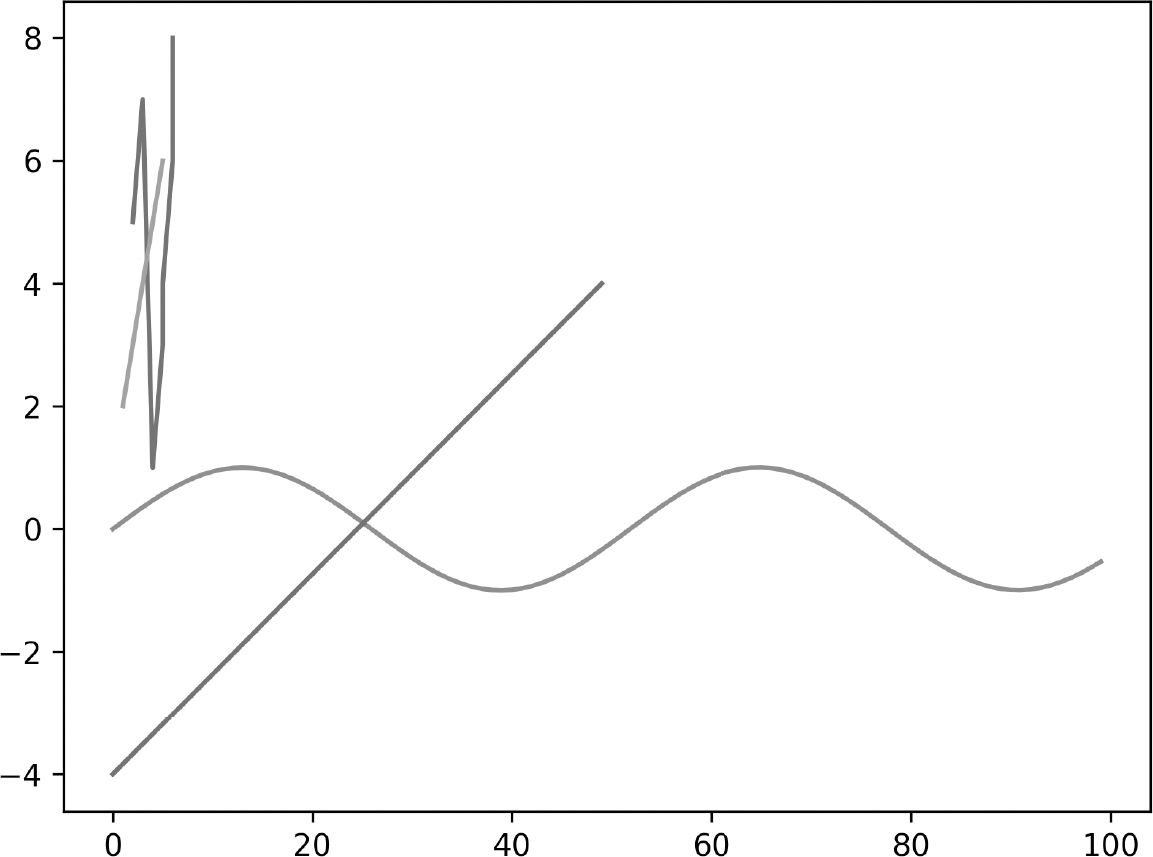
FIGURE 5.17 A random image.


