


LINES IN A GRID IN MATPLOTLIB
Listing 5.10 displays the contents of plotlinegrid2.py that illustrates how to plot lines in a grid.
Listing 5.10: plotlinegrid2.py
import numpy as np
import pylab
from itertools import product
import matplotlib.pyplot as plt

fig = plt.figure()
graph = fig.add_subplot(1,1,1)
graph.grid(which='major', linestyle='-', linewidth='0.5', color='red')

x1 = np.linspace(-5,5,num=200)
y1 = 1*x1
graph.plot(x1,y1, 'r-o')

x2 = np.linspace(-5,5,num=200)
y2 = -x2
graph.plot(x2,y2, 'b-x')

fig.show() # to update
plt.show()
Listing 5.10 defines the NumPy variable points that defines a 2D list of points with three rows and four columns. The Pyplot API plot() uses the points variable to display a grid-like pattern.
Figure 5.7 displays a set of “dashed” line segments whose equations are contained in Listing 5.10.
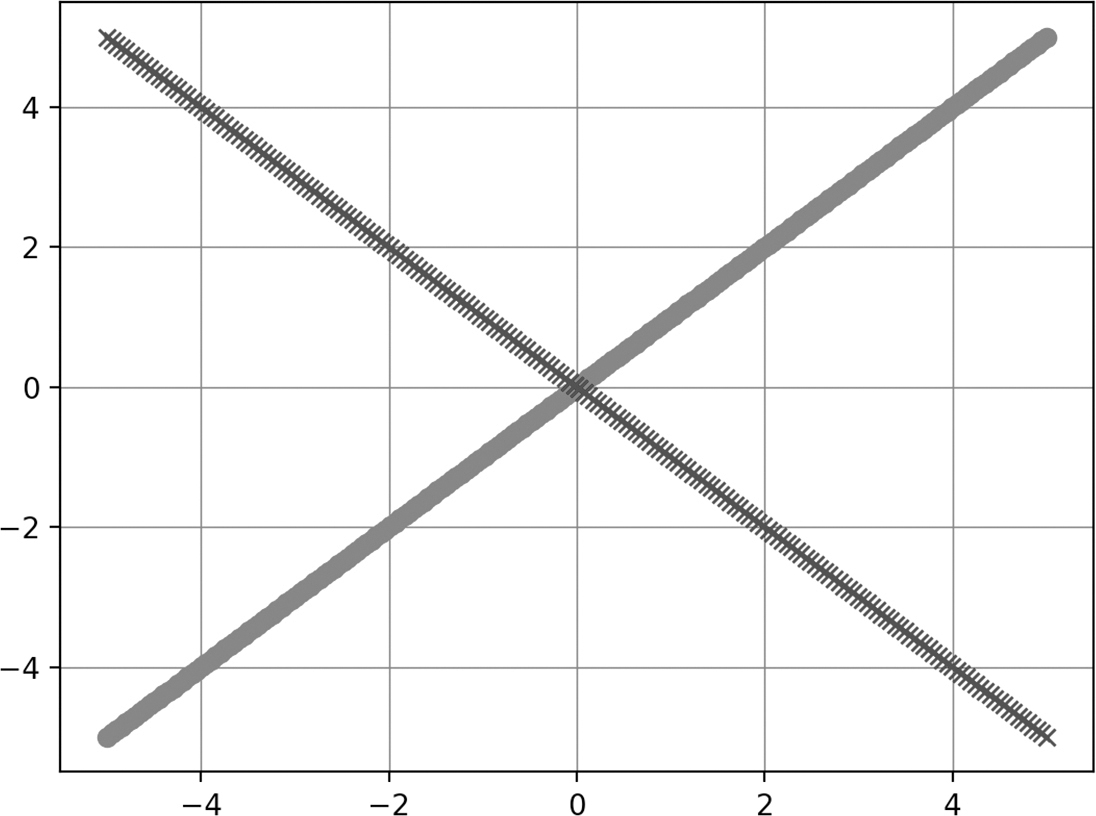
FIGURE 5.7 A grid of line segments.


