


Summary statistics and data aggregates
In this section, we will derive the summary statistics for numerical columns.
Before generating summary statistics, we will identify the categorical columns and numerical columns in the dataset. Then, we will calculate the summary statistics for all numerical columns.
We will also calculate the mean value of each numerical column for the target class. Summary statistics are useful to gain insights about each feature’s mean values and their effect on the target label class.
Let’s print the categorical columns using the following code snippet:
#categorical column
catogrical_column = [column for column in df.columns if df[column].
dtypes=='object']
print(catogrical_column)
We will get the following result:

Figure 1.8 – Categorical columns
Now, let’s print the numerical columns using the following code snippet:
#numerical_column
numerical_column = [column for column in df.columns if df[column].dtypes !='object']
print(numerical_column)
We will get the following output:

Figure 1.9 – Numerical columns
Summary statistics
Now, let’s generate summary statistics (i.e., mean, standard deviation, minimum value, maximum value, and lower (25%), middle (50%), and higher (75%) percentiles) using the following code snippet:
df.describe().T
We will get the following results:
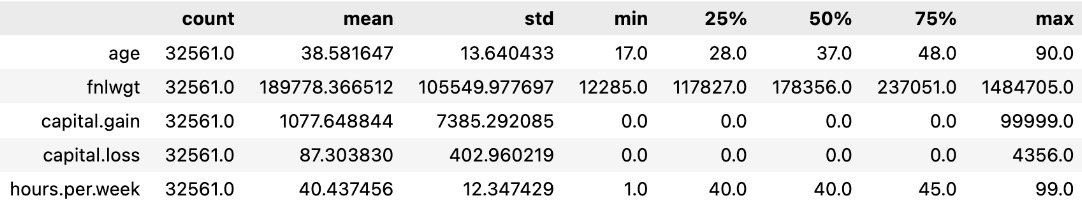
Figure 1.10 – Summary statistics
As shown in the results, the mean value of age is 38.5 years, the minimum age is 17 years, and the maximum age is 90 years in the dataset. As we have only five numerical columns in the dataset, we can only see five rows in this summary statistics table.
Data aggregates of the feature for each target class
Now, let’s calculate the average age of the people for each income group range using the following code snippet:
df.groupby("income")["age"].mean() We will see the following output:
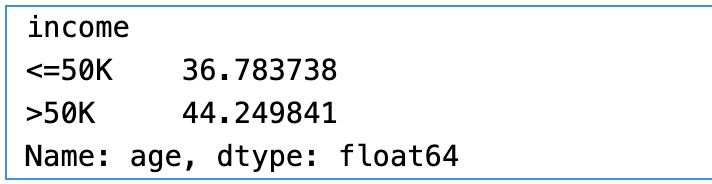
Figure 1.11 – Average age by income group
As shown in the results, we have used the groupby clause on the target variable and calculated the mean of the age in each group. The mean age is 36.78 for people with an income group of less than or equal to $50K. Similarly, the mean age is 44.2 for the income group greater than $50K.
Now, let’s calculate the average hours per week of the people for each income group range using the following code snippet:
df.groupby("income")["hours.per.week"]. mean() We will get the following output:
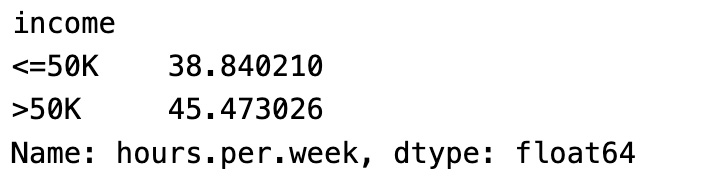
Figure 1.12 – Average hours per week by income group
As shown in the results, the average hours per week for the income group =< $50K is 38.8 hours. Similarly, the average hours per week for the income group > $50K is 45.47 hours.
Alternatively, we can write a generic reusable function for calculating the mean of any numerical column group by the categorical column as follows:
def get_groupby_stats(categorical, numerical):
    groupby_df = df[[categorical, numerical]].groupby(categorical).
        mean().dropna()
    print(groupby_df.head)
If we want to get aggregations of multiple columns for each target income group, then we can calculate aggregations as follows:
columns_to_show = ["age", "hours.per.week"]
df.groupby(["income"])[columns_to_show].agg(['mean', 'std', 'max', 'min'])
We get the following results:
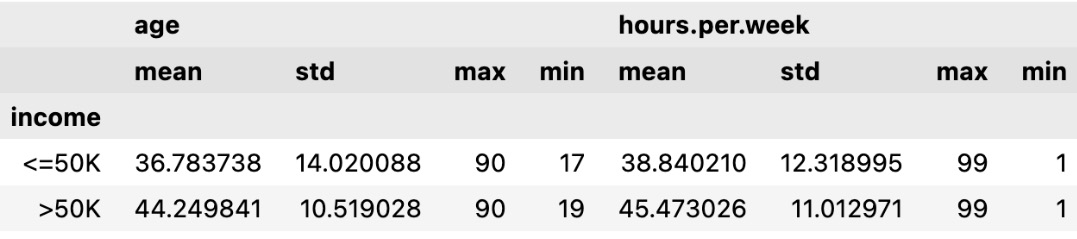
Figure 1.13 – Aggregations for multiple columns
As shown in the results, we have calculated the summary statistics for age and hours per week for each income group.
We learned how to calculate the aggregate values of features for the target group using reusable functions. This aggregate value gives us a correlation of those features for the target label value.