Reader small image

You're reading from  Big Data Analytics with Java

Product typeBook
Published inJul 2017
Reading LevelIntermediate
PublisherPackt
ISBN-139781787288980
Edition1st Edition
Languages
Concepts
Right arrow
Author (1)
RAJAT MEHTA
RAJAT MEHTA
author image
RAJAT MEHTA

The author is a VP (Technical Architect) in technology in JP Morgan Chase in New York. The author is a sun certified java developer and has worked on java related technologies for more than 16 years. Current role for the past few years heavily involves the usage of bid data stack and running analytics on it. Author is also a contributor in various open source projects that are available on his GitHub repository and is also a frequent write on dev magazines.
Read more about RAJAT MEHTA

Right arrow

Chapter 3. Data Visualization

It's easier to analyze your data once you can view it. Viewing data requires putting your data points in charts or graphs that you can visualize and figure out the various details. You can also generate charts/graphs after running your analytic logic. This way you can visualize your analytical results as well. As a Java developer you have lots of open source tools at your disposal that you can use for visualizing your data and the results.

In this chapter we will cover:

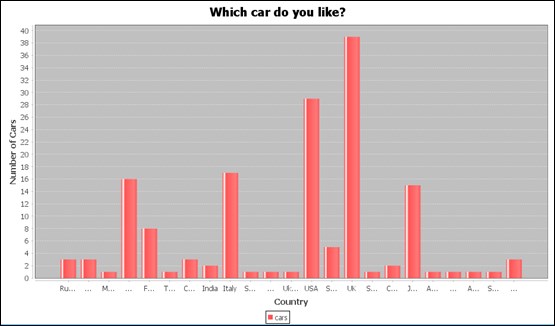
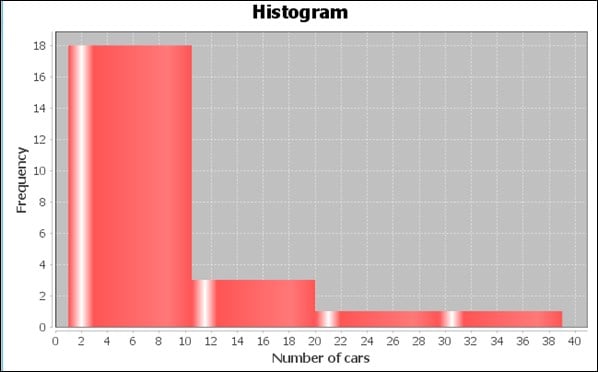
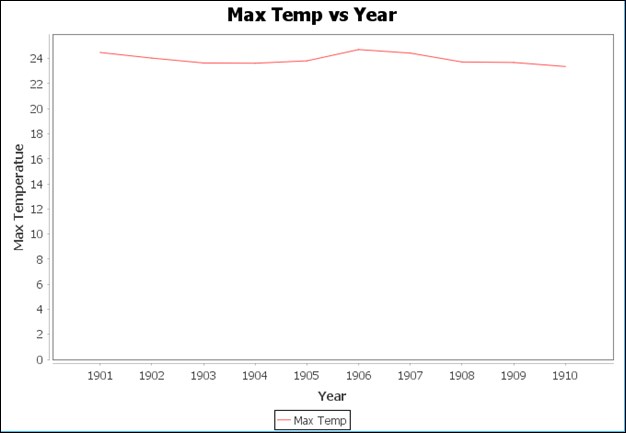
  • Six types of charts and their general use and concepts

  • Sample datasets used in building the charts

  • Brief JFreeChart introduction

  • An example of each type of chart using the JFreeChart and Apache Spark API on big data

Data visualization with Java JFreeChart


JFreeChart is a popular open source chart library built in Java. It's used in various other open source projects as well such as JasperReports (open source reporting framework). You can build a number of popular charts such as pie charts, time series charts, and bar charts to visualize your data with this library.

JFreeChart builds the axis and legends in the charts and provides automatic features such as zooming into the charts with your mouse. For simple chart visualizations that the developer can use to build the models (using lesser data) JFreeChart is good but for extensive data visualization that you need to ship to your customers or end users you are better off with an elaborate data visualization product such as Tableau or QlikView over big data. Although we will cover some of the charts from JFreeChart, this chapter is by no means an extensive take on JFreeChart.

For this book and its examples, we use these charts extensively for visualizing...

Time Series chart


This is a simple chart used for measuring events over time or in other words it is a series of statistical observations that are recorded over time. Visualizing your data this way would help you figure out how the data changes with respect to time in the past and you can also make predictions regarding the values that might occur in the future when time changes. Let's now see some sample Time Series charts in action.

Before giving examples of time series charts, let's understand the dataset used for the time series chart examples.

All India seasonal and annual average temperature series dataset

In this dataset, we have India's seasonal temperature captured on monthly/annual basis from 1901 to 2015. The dataset is downloaded as a JSON file from https://data.gov.in/catalog/all-india-seasonal-and-annual-mean-temperature-series. You can also find the sample dataset in the GitHub code accompanied with this book.

This dataset comprises two json objects as shown next:

  • Fields: This...

Bar charts


A bar chart shows variations in quantity of some entity using rectangles either drawn vertically or horizontally on a chart. As you visualize the different lengths of rectangles on the chart, it is easy to figure out which category is more and which one is less. Bar charts have three main advantages:

  • You can see the data relationships in the x and y axes

  • You can easily compare the values among different categories

  • You can also use them to visualize trends

As an example, take a look at the following bar chart, which shows the number of cars made by different countries (as shown in cars.json dataset):

As you can see in the preceding chart, this dataset has a maximum number of cars from the UK followed by the USA, followed by Italy, and so on.

Let's explore this example further with the actual code. The cars.json dataset that is analyzed by the preceding chart, has the following format:

{"make_id":"abarth","make_display":"Abarth","make_is_common":"0","make_country":"Italy"}

{"make_id"...

Histograms


A Histogram is a special kind of bar chart. A histogram depicts some quantitative value on the x axis and frequency of that value on the y axis. The main feature of a histogram is that in a histogram, the x axes are grouped into bins and we treat each bin as a category. Thus, for a particular value, we take both the x axis bin and the frequency on the y axis into account.

Let's try to understand a histogram using the same cars.json dataset, which we used earlier. For the quantitative variable on the x axis, we will be using the number of cars grouped by each country and depict that on the x axis. The Y axis will denote the frequency of the number of counts, that is, the percentage or probability of countries with that amount of cars in the dataset. The diagram is as shown next:

As you can see in the preceding chart, the maximum number of countries have a number of cars between 0 and 10 count. Next is the countries with cars between 10 and 20 count, and the remaining few between...

Line charts


These types of charts are useful in regression techniques as we will see later. It's a simple chart represented by a line that shows the changes in data either by time or some other value. Even Time Series charts are a type of line chart. Here is an example of a Time Series chart:

This line chart is a simple chart showing Max Temp versus Year, In this case, max temperatures are from 1901 to 1910. The chart shows that the temperature did not change drastically within these 10 years.

To build this line chart, we have used the same All India seasonal and annual min/max temperature series dataset as explained in the preceding Time Series charts. For building the charts, the steps are again the same:

  1. Loading the chart dataset and creating a JFreeChart-specific dataset.

    • We will create a similar createDataset method and return our DefaultCategoryDataset object

         private DefaultCategoryDataset createDataset() {
         DefaultCategoryDataset dataset = new DefaultCategoryDataset();
    • Next, we go...

Scatter plots


One of the most useful charts for data analysis are scatter plots. These charts are heavily used in data analysis, especially in clustering techniques, classification, and so on. In this chart, we pick up data points from the data and plot them as dots on a chart. In simple terms, scatter plots are just data points plotted on x and y axes as shown below. This helps us figure out where the data is more concentrated or in which direction the data is actually flowing.

This is very useful for showing trends, clusters, or patterns, for example, we can figure out which data points lie closer to each other. As an example, let's see a scatter plot next that shows the price of houses versus their living area.

As you can see from the graph, you will generally see that prices are going in the upward direction as the area is increasing. Of course, there are other parameters for the price to consider too; however, for the sake of this graph, we only used the living area. You can also see...

Box plots


Another very useful type of charts is box chart. Before looking into box charts, let's revise some simple mathematical concepts next. You can skip this page and directly go to the chart as well.

Suppose you have an array of numbers as shown here:

int[] numbersArr = { 5, 6, 8, 9, 2 };

Now, from this array, we have to find the following simple math stats:

  • Min: This is just the minimum value from the array and as you can see it is 2

  • Max: This is the maximum value from the array and this as you can see, is 9

  • Mean: This is the mean value of the array elements. Mean is nothing but the average value. Hence in this case it is the sum of array elements divided by the number of elements in the array.

    	(5 + 6 + 8 + 9 + 2) / 5 = 6
  • Median: If we sort the preceding array in ascending order, the values would be:

    int[ ] numbersArr = ( 2, 5, 6, 8, 9 ),

    The value located at the middle of the dataset array depicts the median. As such, the median depicts a value in the array such that 50% of the values...

Advanced visualization technique


For advanced data visualization, commercial tools such as Tableau or FusionCharts can be used. These are very good in making dashboards and reports that can be used by businesses in their presentations or demos. In fact, for business needs, specifically for presentations or demos, we would urge the users to go with commercial tools such as Tableau or FusionCharts as they can be used to make very good reports and presentations. However, if you have specific advanced charting needs such as making three-dimensional charts or creating graphs or trees in Java, we can use advanced Java charting libraries such as Prefuse or VTK Graph toolkits.

Note

Covering these advanced libraries in detail is beyond the scope of this book. Hence, we will only give specific brief outline on these libraries. Readers who are interested in these libraries can refer to their specific websites for more information.

Prefuse

This is an open source set of tools that is used for creating rich...

Summary


In this chapter, we covered six basic types of charts, namely, Time Series charts, bar charts, line charts, histograms, and scatter plots. These charts are extensively used in the data exploration phase to help us better understand our data. Visually understanding our data this way can help us easily figure out anomalies in our dataset and give us insights into our data that we can later put to use for making predictions on new data. Each chart can be used for specific needs such as:

  • Time Series charts show us how our data changes with respect to time

  • Bar charts show us the trends in our data and histograms help us find the density of our data

  • Box charts help us find the minimum, maximum, median values in our numerical data, and also help us figure out the outlier points

  • Scatter plots help us figure out patterns in our data or how our data points are concentrated

Java provides us with various open source libraries that we can put to use for making these charts. One such popular library...

lock icon
The rest of the chapter is locked
You have been reading a chapter from
Big Data Analytics with Java
Published in: Jul 2017Publisher: PacktISBN-13: 9781787288980
Register for a free Packt account to unlock a world of extra content!
A free Packt account unlocks extra newsletters, articles, discounted offers, and much more. Start advancing your knowledge today.
undefined
Unlock this book and the full library FREE for 7 days
Get unlimited access to 7000+ expert-authored eBooks and videos courses covering every tech area you can think of
Renews at $15.99/month. Cancel anytime

Author (1)

author image
RAJAT MEHTA

The author is a VP (Technical Architect) in technology in JP Morgan Chase in New York. The author is a sun certified java developer and has worked on java related technologies for more than 16 years. Current role for the past few years heavily involves the usage of bid data stack and running analytics on it. Author is also a contributor in various open source projects that are available on his GitHub repository and is also a frequent write on dev magazines.
Read more about RAJAT MEHTA