Reader small image

You're reading from  Applied Deep Learning with Keras

Product typeBook
Published inApr 2019
Reading LevelIntermediate
Publisher
ISBN-139781838555078
Edition1st Edition
Languages
Tools
Right arrow
Authors (3):
Ritesh Bhagwat
Ritesh Bhagwat
author image
Ritesh Bhagwat

Ritesh Bhagwat has a master's degree in applied mathematics with a specialization in computer science. He has over 14 years of experience in data-driven technologies and has led and been a part of complex projects ranging from data warehousing and business intelligence to machine learning and artificial intelligence. He has worked with top-tier global consulting firms as well as large multinational financial institutions. Currently, he works as a data scientist. Besides work, he enjoys playing and watching cricket and loves to travel. He is also deeply interested in Bayesian statistics.
Read more about Ritesh Bhagwat

Mahla Abdolahnejad
Mahla Abdolahnejad
author image
Mahla Abdolahnejad

Mahla Abdolahnejad is a Ph.D. candidate in systems and computer engineering with Carleton University, Canada. She also holds a bachelor's degree and a master's degree in biomedical engineering, which first exposed her to the field of artificial intelligence and artificial neural networks, in particular. Her Ph.D. research is focused on deep unsupervised learning for computer vision applications. She is particularly interested in exploring the differences between a human's way of learning from the visual world and a machine's way of learning from the visual world, and how to push machine learning algorithms toward learning and thinking like humans.
Read more about Mahla Abdolahnejad

Matthew Moocarme
Matthew Moocarme
author image
Matthew Moocarme

Matthew Moocarme is an accomplished data scientist with more than eight years of experience in creating and utilizing machine learning models. He comes from a background in the physical sciences, in which he holds a Ph.D. in physics from the Graduate Center of CUNY. Currently, he leads a team of data scientists and engineers in the media and advertising space to build and integrate machine learning models for a variety of applications. In his spare time, Matthew enjoys sharing his knowledge with the data science community through published works, conference presentations, and workshops.
Read more about Matthew Moocarme

View More author details
Right arrow

Chapter 6. Model Evaluation

Note

Learning Objectives

By the end of this chapter, you will be able to:

  • Explain model evaluation, accuracy, null accuracy, and the limitations of accuracy

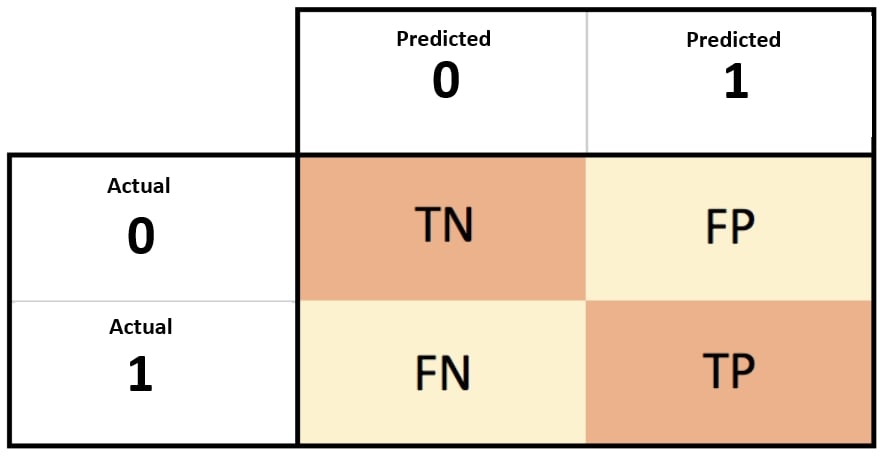
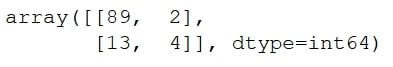
  • Explain imbalanced datasets and confusion matrices

  • Evaluate sensitivity, specificity, precision, FPR, ROC curves, and AUC scores

  • Evaluate the classification threshold

Note

In this chapter, we will learn how to evaluate a model using accuracy. We will evaluate the model with sensitivity, specificity, precision, FPR, ROC curves, and AUC curves. Lastly, we will apply a classification threshold on the model.

Introduction


In this chapter, we will learn about some different evaluation techniques other than accuracy. For any data scientist, the first step after building a model is to evaluate it, and the easiest way to evaluate a model is through its accuracy. However, in real-world scenarios, we often deal with datasets where accuracy is not the best evaluation technique. This chapter explores core concepts such as imbalanced datasets and how different evaluation techniques can be used to work through these imbalanced datasets. The chapter begins with an introduction to accuracy and its limitations. It then explores the concepts of null accuracy, imbalanced datasets, sensitivity, specificity, precision, false positives, ROC curves, and AUC scores.

Accuracy


To understand accuracy properly, first let's explore model evaluation. Model evaluation is an integral part of the model development process. Once you build your model and execute it, the next step is to evaluate your model. A model is built on a training dataset, and evaluating a model's performance on the same training dataset is a bad practice in data science. Once a model is trained on a training dataset, it should be evaluated on a dataset that is completely different from the training dataset. This dataset is known as the test dataset. The objective should always be to build a model that generalizes, which means the model should produce similar (but not the same) results, or relatively similar results, on any dataset. This can only be achieved if we evaluate the model on data that is unknown to it.

The model evaluation process requires a metric that can quantify a model's performance. The simplest metric for model evaluation is accuracy. Accuracy is the fraction of predictions...

Imbalanced Datasets


Imbalanced datasets are a distinct case for classification problems where the class distribution varies between the classes. In such datasets, one class is overwhelmingly dominant. In other words, the null accuracy of an imbalanced dataset is very high. Consider an example of credit card fraud. If we have a dataset of credit card transactions, then we will find that, of all the transactions, a very miniscule number of transactions were fraudulent and the majority of transactions were normal transactions. If 1 represents a fraudulent transaction and 0 represents a normal transaction, then there will be many 0s and hardly any 1s. The null accuracy of the dataset may be more than 99%. This means the majority class (in this case, 0) is overwhelmingly greater than the minority class (in this case, 1). Such sets are imbalanced datasets. The following figure shows a generalized scatter plot of an imbalanced dataset, where the stars represent the minority class and the circles...

Confusion Matrix


A confusion matrix describes the performance of the classification model. In other words, confusion matrix is a way to summarize classifier performance. The following figure shows a basic representation of a confusion matrix:

Figure 6.5: Basic representation of a confusion matrix

The following code is an example of a confusion matrix:

from sklearn.metrics import confusion_matrix
cm=confusion_matrix(y_test,y_pred_class)
print(cm)

The following figure shows the output of the preceding code:

Figure 6.6: Example confusion matrix

These are the meanings of the abbreviations used in the preceding figure:

  • TN (True negative): This is the count of outcomes that were originally negative and were predicted negative.

  • FP (False positive): This is the count of outcomes that were originally negative but were predicted positive. This error is also called a type 1 error

  • FN (False negative): This is the count of outcomes that were originally positive but were predicted negative. This error is also...

Summary


In this chapter, we learned about model evaluation and accuracy. We learned how accuracy is not the most appropriate technique for evaluation when our dataset is imbalanced. We also learned how to compute a confusion matrix using scikit-learn and how to derive other metrics, such as sensitivity, specificity, precision, and false positive rate. Finally, we learned how to use threshold values to adjust metrics and how ROC curves and AUC scores help us evaluate our models. It is very common to deal with imbalanced datasets in real-life problems. Problems such as credit card fraud detection, disease prediction, and spam email detection all have imbalanced data in different proportions.

lock icon
The rest of the chapter is locked
You have been reading a chapter from
Applied Deep Learning with Keras
Published in: Apr 2019Publisher: ISBN-13: 9781838555078
Register for a free Packt account to unlock a world of extra content!
A free Packt account unlocks extra newsletters, articles, discounted offers, and much more. Start advancing your knowledge today.
undefined
Unlock this book and the full library FREE for 7 days
Get unlimited access to 7000+ expert-authored eBooks and videos courses covering every tech area you can think of
Renews at $15.99/month. Cancel anytime

Authors (3)

author image
Ritesh Bhagwat

Ritesh Bhagwat has a master's degree in applied mathematics with a specialization in computer science. He has over 14 years of experience in data-driven technologies and has led and been a part of complex projects ranging from data warehousing and business intelligence to machine learning and artificial intelligence. He has worked with top-tier global consulting firms as well as large multinational financial institutions. Currently, he works as a data scientist. Besides work, he enjoys playing and watching cricket and loves to travel. He is also deeply interested in Bayesian statistics.
Read more about Ritesh Bhagwat

author image
Mahla Abdolahnejad

Mahla Abdolahnejad is a Ph.D. candidate in systems and computer engineering with Carleton University, Canada. She also holds a bachelor's degree and a master's degree in biomedical engineering, which first exposed her to the field of artificial intelligence and artificial neural networks, in particular. Her Ph.D. research is focused on deep unsupervised learning for computer vision applications. She is particularly interested in exploring the differences between a human's way of learning from the visual world and a machine's way of learning from the visual world, and how to push machine learning algorithms toward learning and thinking like humans.
Read more about Mahla Abdolahnejad

author image
Matthew Moocarme

Matthew Moocarme is an accomplished data scientist with more than eight years of experience in creating and utilizing machine learning models. He comes from a background in the physical sciences, in which he holds a Ph.D. in physics from the Graduate Center of CUNY. Currently, he leads a team of data scientists and engineers in the media and advertising space to build and integrate machine learning models for a variety of applications. In his spare time, Matthew enjoys sharing his knowledge with the data science community through published works, conference presentations, and workshops.
Read more about Matthew Moocarme