


Inserting slicers for interaction
We have now created all the primary components of our dashboard. At this point, the visuals are not formatted, and they are only flat displays without any interaction.
To bring in some interaction, we will insert slicers to help users dice and slice to bring out some insights from these charts.
We can insert the slicers directly from the data model. To do that, go to Insert > Slicer > Data Model.
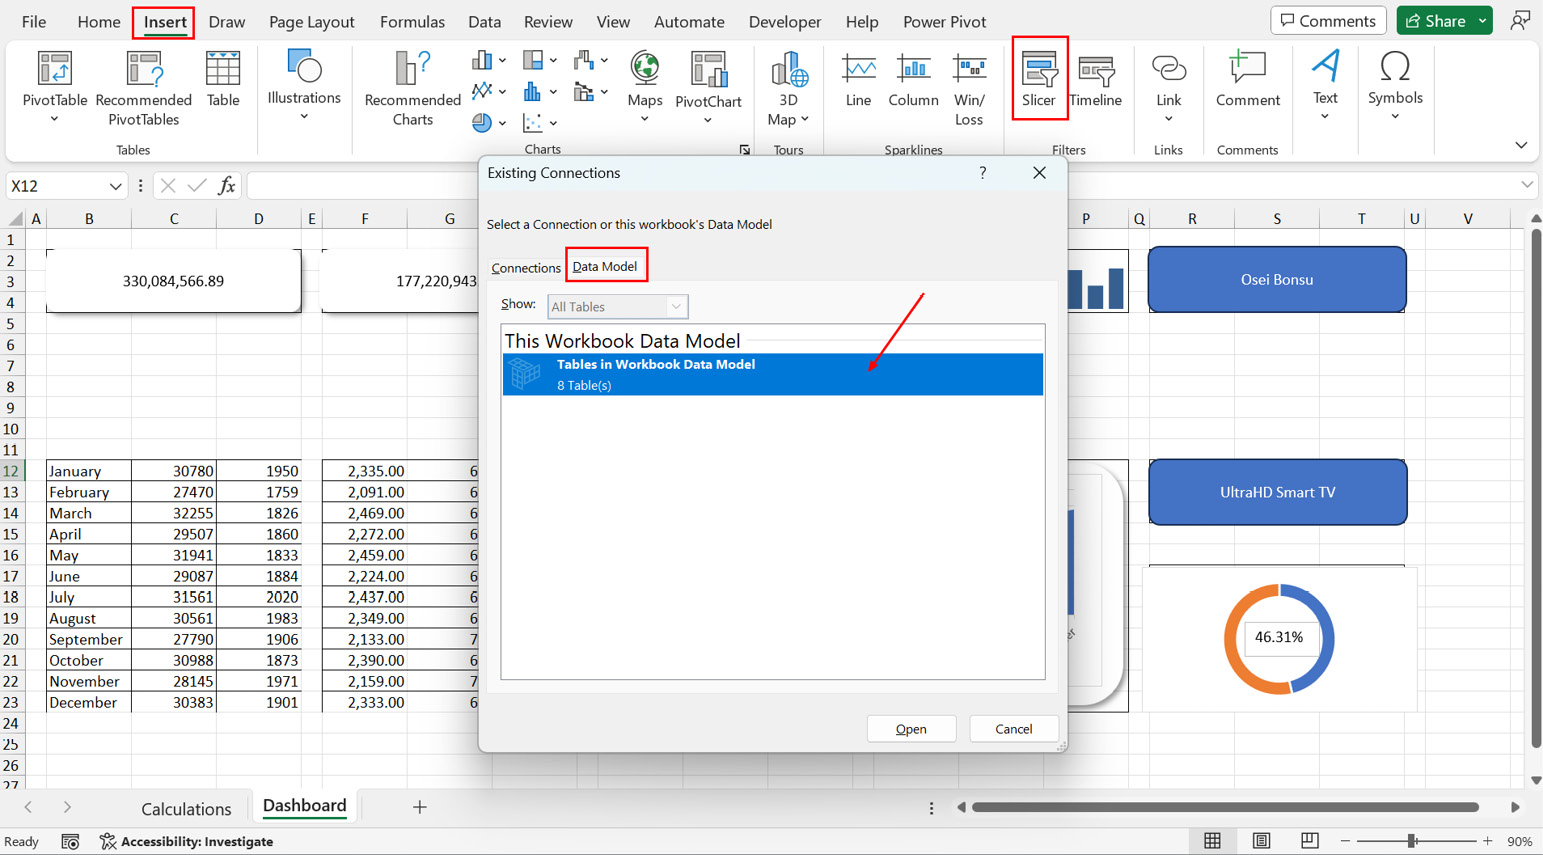
Figure 8.55 – Inserting slicers for interaction
This should bring up all the tables in our data model.
For this dashboard, we want users to slice using Year from the Calendar table and Region from the Location table.
This should bring up the two slicers:
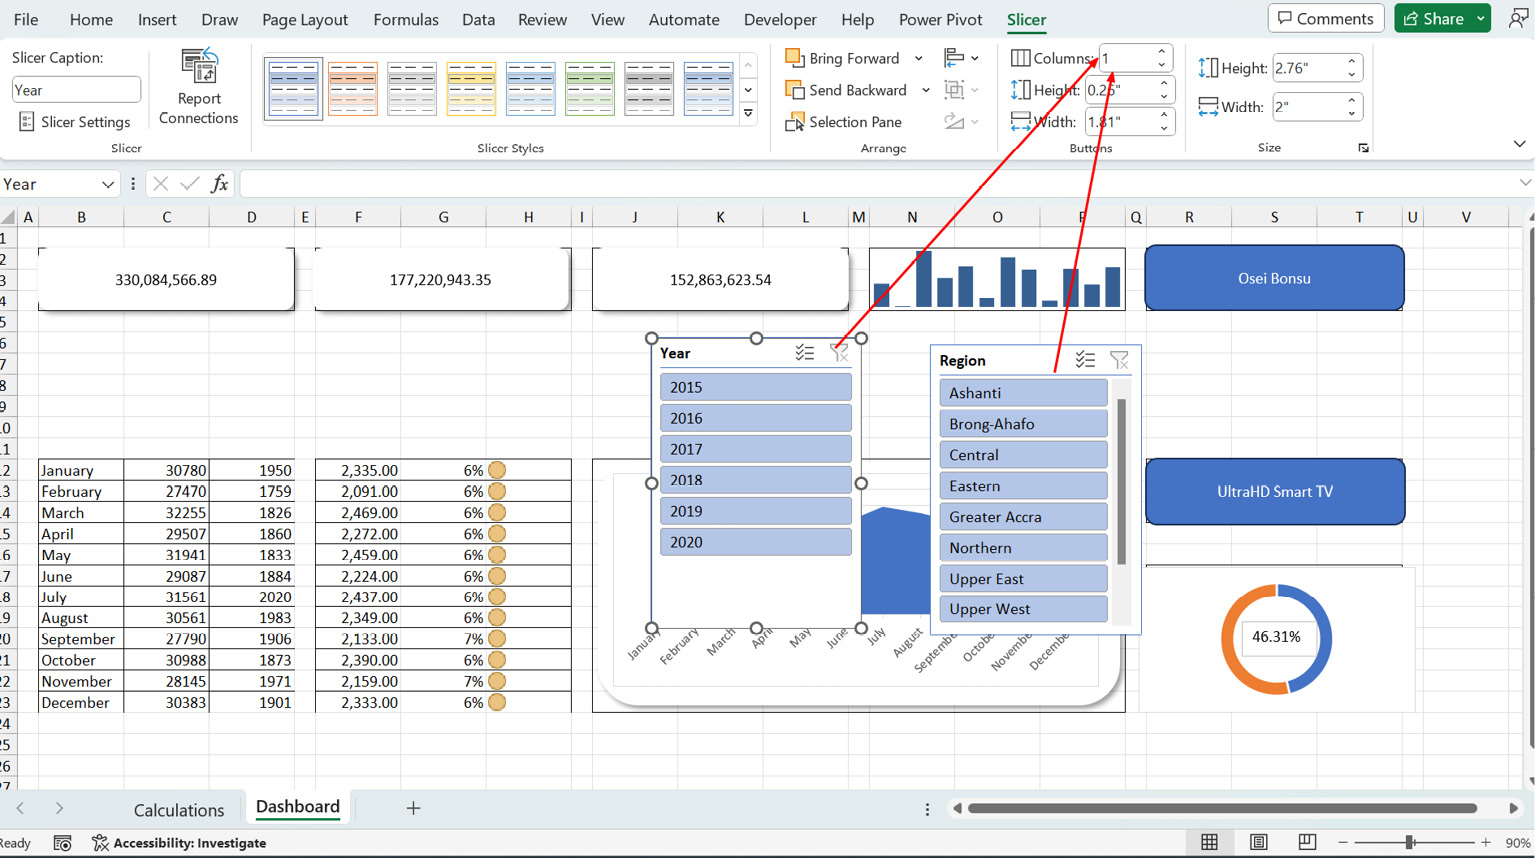
Figure 8.56 – Aligning your slicers
We can split the buttons into columns representing the number of items we have in each slicer. So, we set 6 columns for the Year slicer and 10 for the Region slicer. You can always...


