Chapter 11. Debugging with Dynamics NAV and MSDYN365BC
Microsoft introduced a new debugger from the Microsoft Dynamics NAV 2013 release. The purpose of the revamped debugger is to allow IT people to easily pinpoint the problem any specific user is facing while using the software, for example, with conditional breakpoints, debugging other user sessions, and debugging C/AL code in the Windows client, instead of in incomprehensible C# code. All these new features make the debugging experience a happy one.
The following topics are covered in this chapter:
- The art of debugging
- Starting the debugger
- Placing breakpoints
- Line-by-line execution
- How to debug in the new AL Development Environment
Note
On 1st October 2018, Microsoft coined this new name for the New Modern Development Environment, that is, AL Development Environment, in relation to the launch of Microsoft Dynamics 365 Business Central on-premise.
By definition, debugging is a methodical process of finding and reducing the number of bugs in an application. Normally, the first step in debugging is to attempt to reproduce the problem. On some occasions, the input of the program may need to be simplified to make it easier to debug. Then, the debugger tool is used to examine the program stats (values of variables, call stacks, and so on) to track down the origin of the problem and finally fix it.
Debugging, however, can do so much more than just solving issues. It is a fantastic way to understand how an application works. You could just open the object involved, read the written code, and follow it up. However, this will be hard.
First of all, Microsoft Dynamics NAV code is run after an event occurs. If you take a look at an object, you will see code in the events, but it will be hard to know when an event occurs or which event is the one that first causes the code to be executed.
It will also be hard to just read the...
Debugging in Microsoft Dynamics NAV 2018 and in Microsoft Dynamics 365 Business Central on-premise
The debugger starts from the Microsoft Dynamics NAV Development Environment both for Microsoft Dynamics NAV 2018 and from Microsoft Dynamics 365 Business Central on-premise. This is true for C/AL code. For AL code, you can debug from Visual Studio Code directly. The user with which you are logged in must be assigned as a user in Microsoft SQL Server.
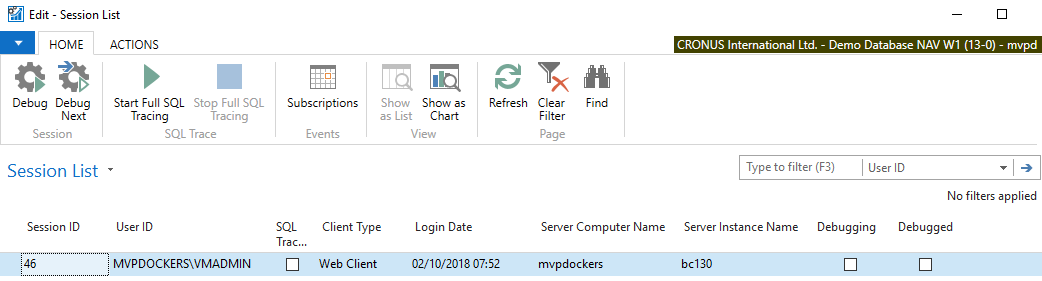
Go to Tools | Debugger | Debug Session; the Session List page will open, as shown in the following screenshot (the screenshot is taken from the Microsoft Dynamics 365 Business Central on-premise October release):
Note
Note that the page shows all sessions on the current database from all companies.
The session you select can be any of the following:
- A
Windows Client session - A
Web Client session - A
Mobile (Universal App Client) session - An
OData Web Services session - An
SOAP Web Services session - An
NAS (Navision Application Server) Services session
Place the...
A breakpoint is an intentional stop or pause placed in an object. It is a mark that you can set on a statement. When the program flow reaches the statement, the debugger intervenes and suspends execution until you instruct it to continue. During the interruption, you can inspect the environment, or start line-by-line code execution.
There are several methods for placing and removing breakpoints. This section will show you all the different ways, so that you can choose the one that best suits your debugging needs.
From the Microsoft Dynamics NAV Development Environment (both for Microsoft Dynamics NAV and Microsoft Dynamics 365 Business Central), select Table 270 Bank Account and click on the Design button to open the Table Designer window. Then, press F9 or click on View | C/AL Code to open the C/AL Editor.
Place the cursor on one statement, a line of code, and press F9. A red bullet will appear on the left-hand side of the statement, as seen in the...
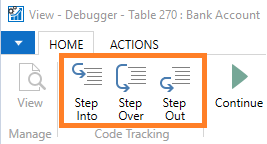
When the debugger stops the execution of the program flow, you have four options to continue the execution. You can find those options on the ribbon pane of the Debugger page, as shown in the following screenshot:
The following is a description of each of the options available to continue execution:
Step Into: Click on the Step Into icon or press F11 to execute the current statement. If the statement contains a function call, execute the function and break at the first statement inside the function.Step Over: Click on the Step Over icon or press F10 to execute the current statement. If the statement contains a function call, execute the function and break at the first statement outside the function.Step Out: Click on the Step Out icon or press Shift + F11 to execute the remaining statements in the current function, and break at the next statement in the calling function.Continue: Click on the Continue icon or press F5 to continue until the next break.
Let's see an example...
The Call Stack FactBox shows the active functions of the current execution. The Call Stack FactBox gives us information about the function that is currently being executed, and also from where this function has been called:
In the preceding screenshot, we can see the call stack corresponding to the code execution we were analyzing in the Step Into option.
We started debugging on the OnInsert trigger of the Bank Account table. We used the Step Into option until we reached a call to the InitSeries function. With this, we kept using the Step Into option until we reached the GetNextNo function. The The Step Into option section stopped there.
This is exactly what we see in the Call Stack FactBox.
The top line shows us the current function, while the bottom line shows the first function from where we started debugging. It also gives us valuable information, such as the object that contains the functions that are executed.
You can select any of the lines of the Call Stack FactBox...
The Watches FactBox is used to view the values of variables. You can select some variables from the Debugger Variables List window and add them to the Watches FactBox. Those variables will be shown until you delete them, even if they run out of scope. If this happens, the <Out of Scope> text will be displayed in the Value column of the Watches FactBox. All the variables added to the Watches FactBox persist between debugging sessions.
There are two ways to add a variable to the Watches FactBox:
- From the
Debugger Variable List window - From the
Code viewer
Adding variables from the Debugger Variables List window
To add variables from theDebugger Variables List window, follow these steps:
- On the
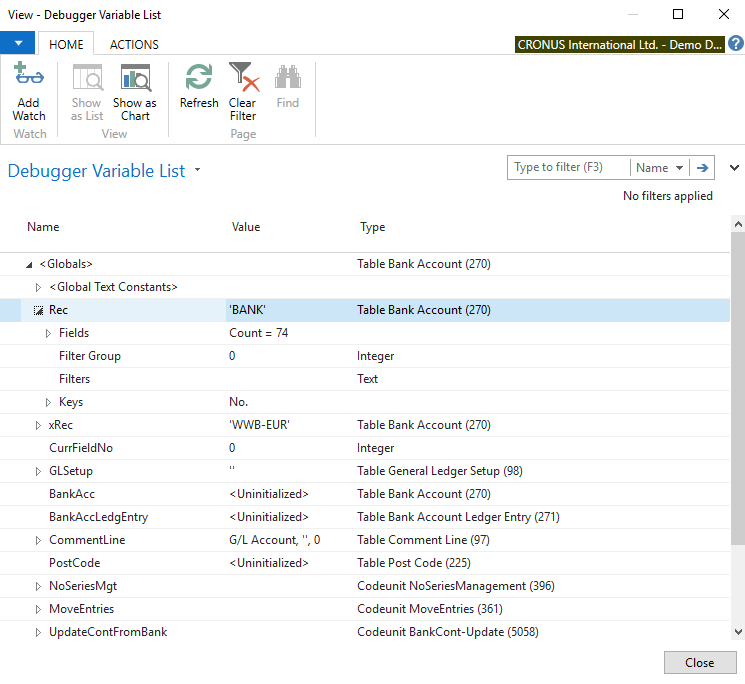
Debugger page, click on the Variables option found on the ACTIONS pane. The Debugger Variable List page will open, as shown in the following screenshot:
- Select a variable from the list and click on the
Add Watch icon. Then, click on the Close button. - Back on the
Debugger page, you will...
Debugging in the AL Development Environment
As already mentioned, debugging can also be done with the Modern Development Environment composed of Visual Studio Code and Microsoft AL Language Extension. Working with .al files and with the Visual Studio Code environment, debugging can be done differently than in a Microsoft Dynamics NAV development environment.
Debugging in Visual Studio Code
With Visual Studio Code and the AL Language extension, you get an integrated debugger to help you inspect your code to verify that your application can run as expected. You start a debugging session by pressing F5. (https://docs.microsoft.com/it-it/dynamics-nav/developer/devenv-debugging)
To bring up the debug view, click on the debug icon in the activity bar on the side of Visual Studio Code. You can also use the keyboard shortcut Ctrl + Shift + D.
The debug view displays all information related to debugging and has a top bar with debugging commands and configuration settings.
The Microsoft Al Language...
In this chapter, you saw that debugging is kind of an art that is used to examine program stats, find bugs, and enable them to be fixed. In addition, you saw that debugging can also be used to understand how an application works.
You also learned how to use the Microsoft Dynamics NAV debugger: how to start it, select a session to debug, place breakpoints, and do line-by-line execution. We also explained the Call Stack FactBox and the Watches FactBox.
We have also seen how to debug in Microsoft Dynamics 365 Business Central using Visual Studio Code and Microsoft AL Language Extension.
In the next chapter, we will talk about the query object, an object type included in Microsoft Dynamics NAV and in Microsoft Dynamics 365 Business Central, which will quickly summarize data for charts and reporting.