Chapter 3: Up and Running with Power BI Desktop
The first step to being able to do almost anything in Power BI is to get Power BI Desktop up and running and have some data loaded to use in creating visualizations. This chapter will get you up and running quickly with Power BI by showing you how to download and install Power BI Desktop, familiarizing you with the Power BI Desktop interface, and then showing you how to work with some simple data and visualizations.
The following topics will be covered in this chapter:
- Downloading and running Power BI Desktop
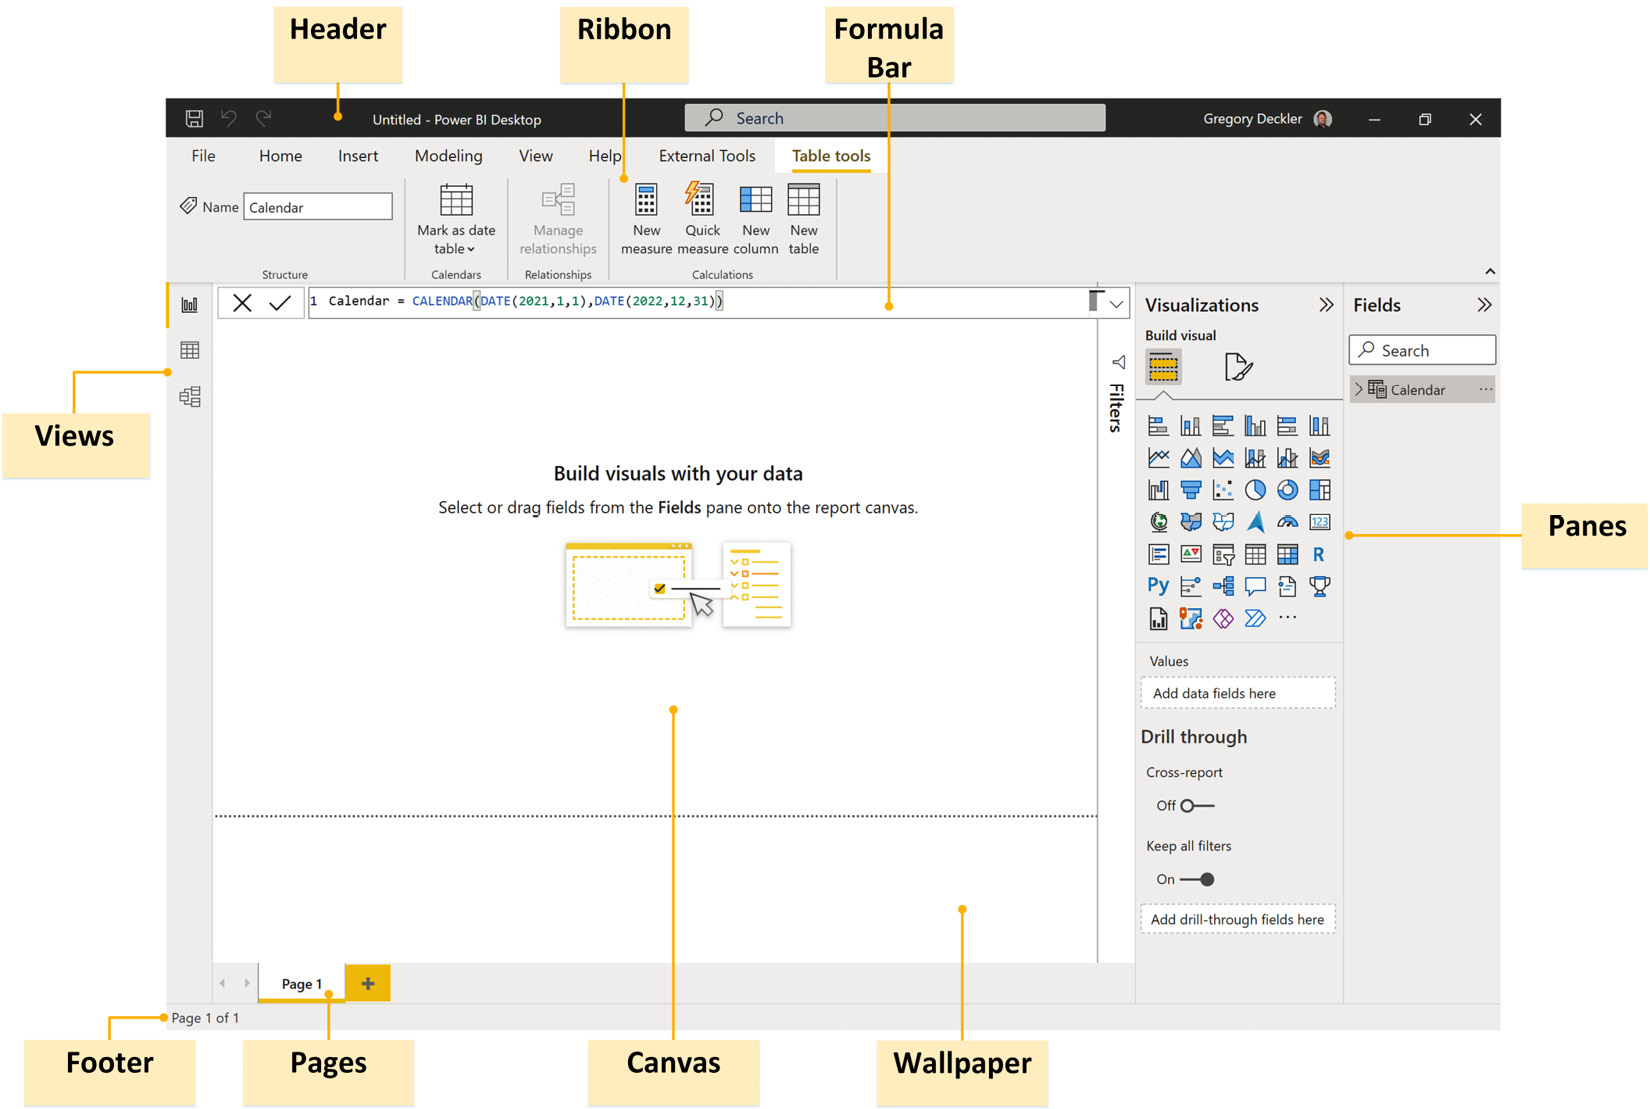
- Touring the desktop
- Generating data
- Creating visualizations