


THE TITANIC DATASET IN SEABORN
Listing 5.33 displays the contents of seaborn_titanic_plot.py that illustrates how to plot the Titanic dataset.
Listing 5.33: seaborn_titanic_plot.py
import matplotlib.pyplot as plt
import seaborn as sns

titanic = sns.load_dataset("titanic")
g = sns.factorplot("class", "survived", "sex",
data=titanic, kind="bar", palette="muted",
legend=False)

plt.show()
Listing 5.33 contains the same import statements as Listing 5.33, and then initializes the variable titanic with the contents of the built-in Titanic dataset. Next, the factorplot() API displays a graph with dataset attributes that are listed in the API invocation.
Figure 5.21 displays a plot of the data in the Titanic dataset based on the code in Listing 5.33.
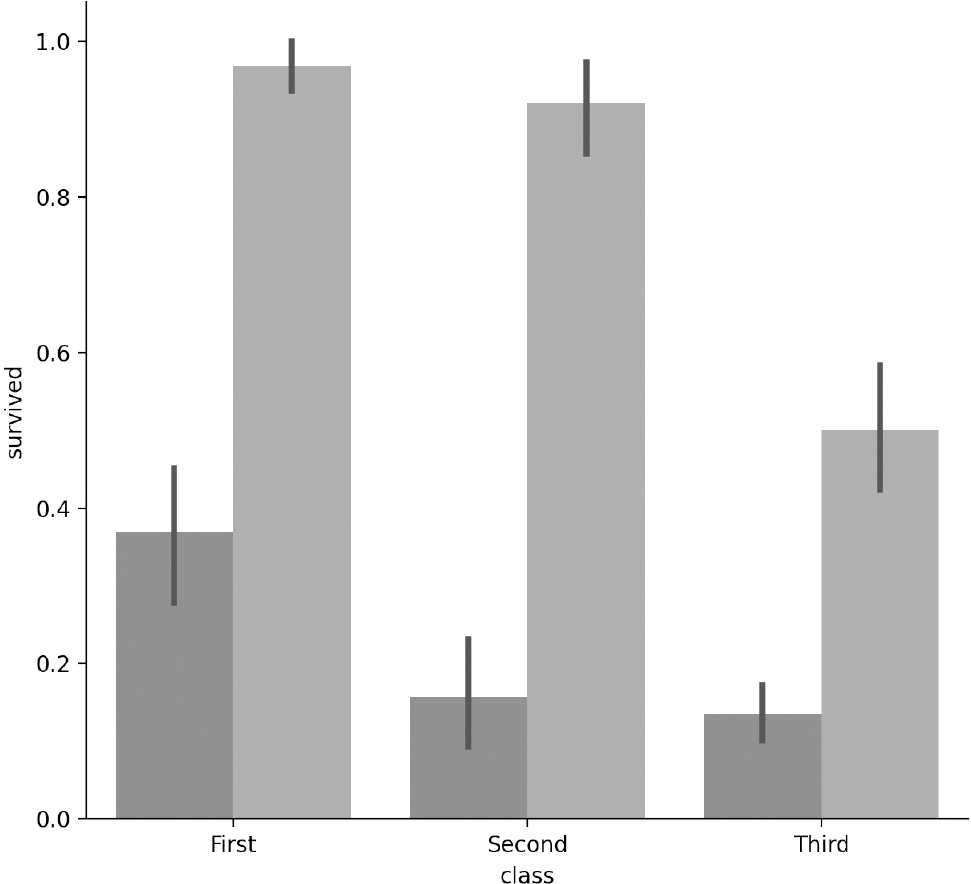
FIGURE 5.21: A HISTOGRAM OF THE TITANIC DATASET.


