


THE IRIS DATASET IN SEABORN
Listing 5.32 displays the contents of seaborn_iris.py that illustrates how to plot the Iris dataset.
Listing 5.32: seaborn_iris.py
import seaborn as sns
import matplotlib.pyplot as plt

# Load iris data
iris1 = sns.load_dataset("iris")

# Construct iris plot
sns.swarmplot(x="species", y="petal_length", data=iris1)

# Show plot
plt.show()
Listing 5.32 imports seaborn and Matplotlib.pyplot and then initializes the variable iris1 with the contents of the built-in Iris dataset. Next, the swarmplot() API displays a graph with the horizontal axis labeled species, the vertical axis labeled petal_length, and the displayed points are from the Iris dataset.
Figure 5.20 displays the images in the Iris dataset based on the code in Listing 5.32.
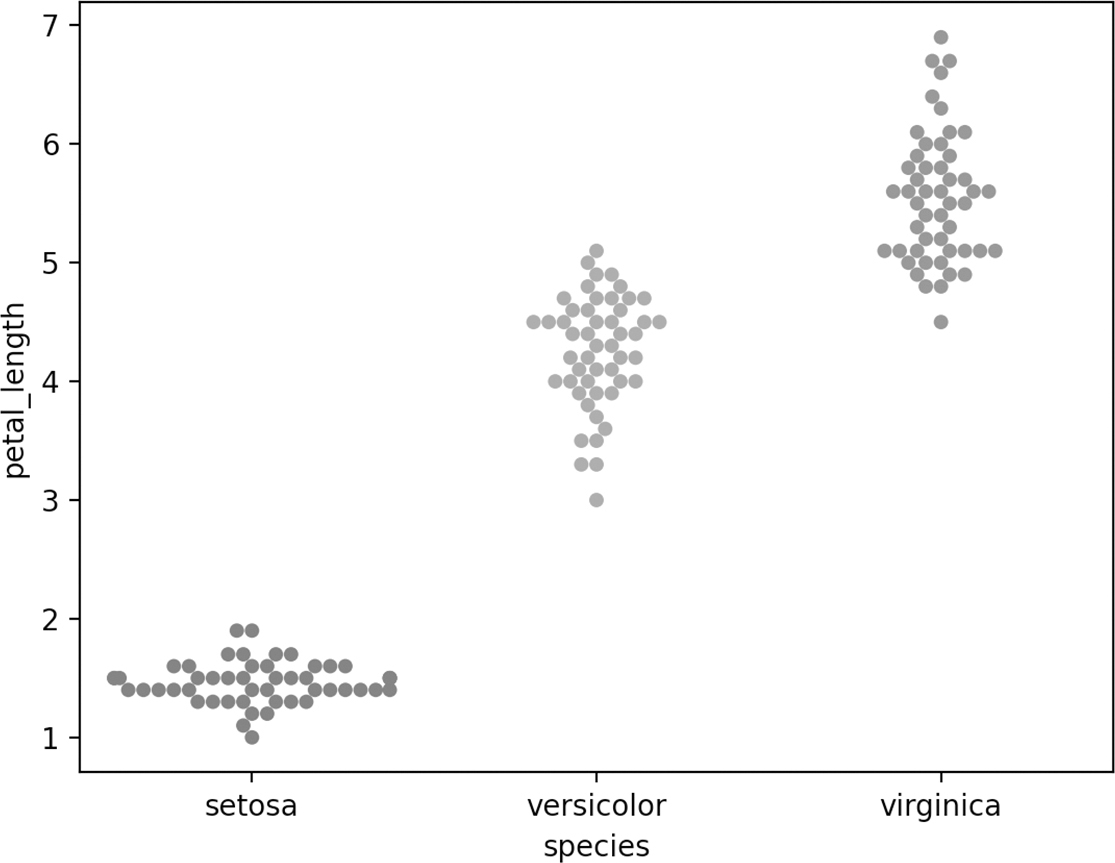
FIGURE 5.20 The Iris dataset.


