Search icon
Arrow left icon
All Products
Best Sellers
New Releases
Books
Videos
Audiobooks
Learning Hub
Newsletters
Free Learning
Arrow right icon
Mastering Microsoft Power BI – Second Edition - Second Edition

You're reading from  Mastering Microsoft Power BI – Second Edition - Second Edition

Product type Book
Published in Jun 2022
Publisher Packt
ISBN-13 9781801811484
Pages 712 pages
Edition 2nd Edition
Languages
Authors (2):
Gregory Deckler Gregory Deckler
Profile icon Gregory Deckler
Brett Powell Brett Powell
Profile icon Brett Powell
View More author details

Table of Contents (18) Chapters

Preface 1. Planning Power BI Projects 2. Preparing Data Sources 3. Connecting to Sources and Transforming Data with M 4. Designing Import, DirectQuery, and Composite Data Models 5. Developing DAX Measures and Security Roles 6. Planning Power BI Reports 7. Creating and Formatting Visualizations 8. Applying Advanced Analytics 9. Designing Dashboards 10. Managing Workspaces and Content 11. Managing the On-Premises Data Gateway 12. Deploying Paginated Reports 13. Creating Power BI Apps and Content Distribution 14. Administering Power BI for an Organization 15. Building Enterprise BI with Power BI Premium 16. Other Books You May Enjoy
17. Index

Visual interactions

Power BI reports are highly interactive by nature, allowing users to click on data points within visuals and cross-filter or highlight other filters on the page. When planning and designing reports, it is important to keep this default behavior in mind and consider whether or not the default visual interaction behavior should be changed.

By default, the filter selections applied to a single visual, such as clicking a bar on a column chart or a row on a table, impact all other data visualizations on the given report page with relationships to the selection.

In Figure 6.8, the bar representing the United States sales territory country has been selected and this causes the product category chart to highlight the portion of each product category related to the United States sales territory country ($45M):

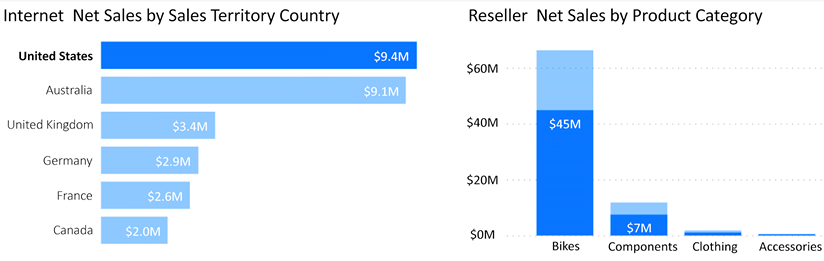
Figure 6.8: Visual interactions – Highlighting

Multiple values from the same column can be selected (for example, France and Canada)...

lock icon The rest of the chapter is locked
Register for a free Packt account to unlock a world of extra content!
A free Packt account unlocks extra newsletters, articles, discounted offers, and much more. Start advancing your knowledge today.
Unlock this book and the full library FREE for 7 days
Get unlimited access to 7000+ expert-authored eBooks and videos courses covering every tech area you can think of
Renews at €14.99/month. Cancel anytime}