


Examples of inaccessible spreadsheets
The United States Supreme Court Justice William Rehnquist once noted, “I may not be able to define pornography, but I know it when I see it.” Much the same can be said about inaccessible spreadsheets; often you know them when you see them. Although I have laid out some guidelines in this chapter, the 17 billion cells available within every Excel worksheet supply lots of room for users to create all kinds of chaos. Spreadsheets are always more accessible when you orient your data vertically, going down columns whenever possible, and in as few sheets as possible. Doing so enables you to use a wide variety of features in Excel that can make quick work of tasks. Psychologically though, many users feel compelled to orient their data horizontally, meaning going across rows. The further to the right that your data extends, the less accessible it is for everyone that uses the spreadsheet. Granted, sometimes, such spreadsheets are generated by an accounting program, such as the report shown in Figure 1.24:
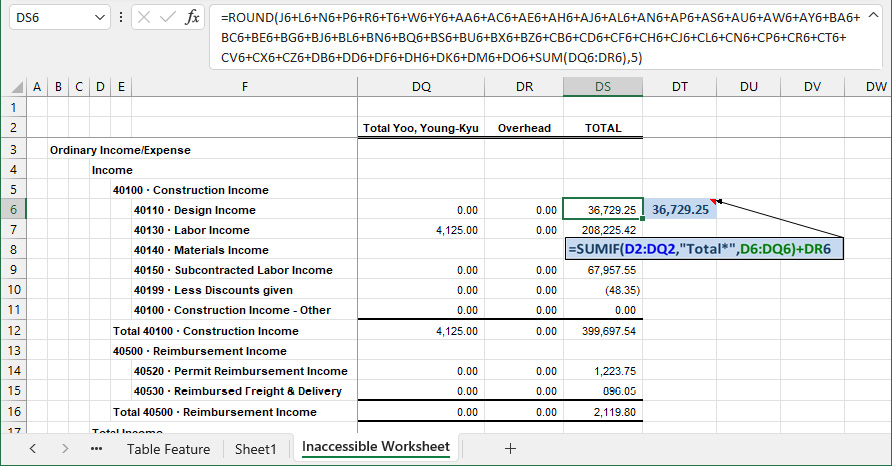
Figure 1.24 – An inaccessible accounting report
Three things make this report inaccessible:
- Account numbers appear in columns
D,E, andF, which can stymy users that wish to use lookup functions such asVLOOKUP,XLOOKUP, andSUMIF, which I discuss in Chapter 10, Lookup Functions and Dynamic Arrays. - The data in the spreadsheet starts in column
Aand ends in columnDS, which means it spans 123 columns. In Chapter 12, Power Query, I show how to unpivot this report, meaning transposing the data from going horizontally across rows to instead running vertically down columns.
Nuance
Enter =COLUMN() in any worksheet cell to return the column position within a worksheet, or in this case, =COLUMN(DS1), to return the position without physically scrolling to that column.
- Cell
DS6on the Inaccessible Worksheet tab contains the formula=ROUND(J6+L6+N6+P6+R6+T6+W6+Y6+AA6+AC6+AE6+AH6+AJ6+AL6+AN6+AP6+AS6+AU6+AW6 +AY6+BA6+BC6+BE6+BG6+BJ6+BL6+BN6+BQ6+BS6+BU6+BX6+BZ6+CB6 +CD6+CF6+CH6+CJ6+CL6+CN6+CP6+CR6+CT6+CV6+CX6+CZ6+DB6+DD6 +DF6+DH6+DK6+DM6+DO6+SUM(DQ6:DR6),5), which is completely inaccessible for most Excel users. Conversely, cellDT6contains the formula=SUMIF(G2:DQ2,"Total*",G6:DQ6)+DR6. TheSUMIFfunction has three arguments:- Range – This argument specifies the range of cells Excel should search, in this case,
G2:DQ2. - Criteria – This argument specifies the criteria that Excel should match on. In this case,
"Total*"enablesSUMIFto perform a partial match and add up the values from every column where the values in row2begin with the wordTotal. The asterisk is known as a wildcard character for performing partial matches such as this. - Sum_range – The range of cells that should be summed when matching criteria is found, in this case, cells
G6:DQ6.
- Range – This argument specifies the range of cells Excel should search, in this case,
Notice that the formula includes +DR6 because cell DR2 contains the word Overhead, and so it would be excluded based upon the criteria specified in the SUMIF function.
Inaccessible spreadsheets are a fact for many Excel users, but throughout this book, you’ll discover ways to turn the tide and improve their usability. I’ll leave you with one last rule of thumb, which is to use as few worksheets in a workbook as possible. For instance, stick with a single worksheet that has a month or period column that you fill in on each row, instead of creating 12 monthly worksheets to house data by period. In general, resist the urge to recreate the same sheet over and over, such as separate worksheets for each vehicle, department, project, or what have you, and instead, make minor modifications to keep the data to a single worksheet. Doing so treats Excel more like a database and unlocks many ways to use your data more effectively.
Choose Review | Workbook Statistics to determine of worksheets in a workbook, as shown in Figure 1.25. A double-digit number of worksheets doesn’t automatically make a workbook inaccessible, but inaccessible workbooks typically have double-digit worksheet counts or sometimes more.
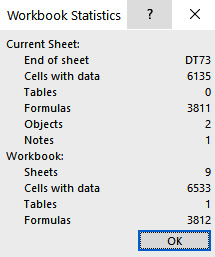
Figure 1.25 – Workbook Statistics dialog box
Nuance
The Workbook Statistics dialog box includes both hidden and visible sheets, along with the number of filled cells, the number of Tables, formulas, and objects. Objects are anything that floats above the worksheet, such as the WordArt that we created earlier.
Let’s now look at what you’ve learned in this chapter.