


Reading Excel files to R
In this section, we are going to read data from Excel with a few different R libraries. We need to do this before we can even consider performing any type of manipulation or analysis on the data contained in the sheets of the Excel files.
As mentioned in the Technical requirements section, we are going to be using the readxl, openxlsx, and xlsx packages to read data into R.
Installing and loading libraries
In this section, we are going to install and load the necessary libraries if you do not yet have them. We are going to use the openxlsx, xlsx, readxl, and readxlsb libraries. To install and load them, run the following code block:
pkgs <- c("openxlsx", "xlsx", "readxl")
install.packages(pkgs, dependencies = TRUE)
lapply(pkgs, library, character.only = TRUE)
The lapply() function in R is a versatile tool for applying a function to each element of a list, vector, or DataFrame. It takes two arguments, x and FUN, where x is the list and FUN is the function that is applied to the list object, x.
Now that the libraries have been installed, we can get to work. To do this, we are going to read a spreadsheet built from the Iris dataset that is built into base R. We are going to read the file with three different libraries, and then we are going to create a custom function to work with the readxl library that will read all the sheets of an Excel file. We will call this the read_excel_sheets() function.
Let’s start reading the files. The first library we will use to open an Excel file is openxlsx. To read the Excel file we are working with, you can run the code in the chapter1 folder of this book’s GitHub repository called ch1_create_iris_dataset.R Refer to the following screenshot to see how to read the file into R.
You will notice a variable called f_pat. This is the path to where the Iris dataset was saved as an Excel file – for example, C:/User/UserName/Documents/iris_data.xlsx:
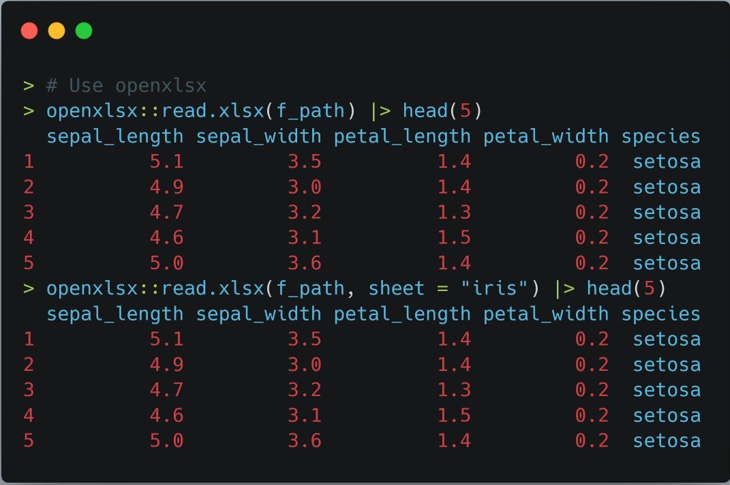
Figure 1.1 – Using the openxlsx package to read the Excel file
The preceding screenshot shows how to read an Excel file. This example assumes that you have used the ch1_create_iris_datase.R file to create the example Excel file. In reality, you can read in any Excel file that you would like or need.
Now, we will perform the same type of operation, but this time with the xlsx library. Refer to the following screenshot, which uses the same methodology as with the openxlsx package:
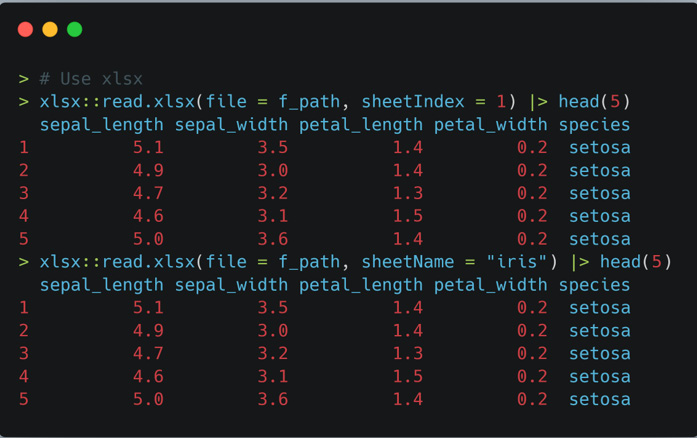
Figure 1.2 – Using the xlsx library and the read.xlsx() function to open the Excel file we’ve created
Finally, we will use the readxl library, which is part of the tidyverse:
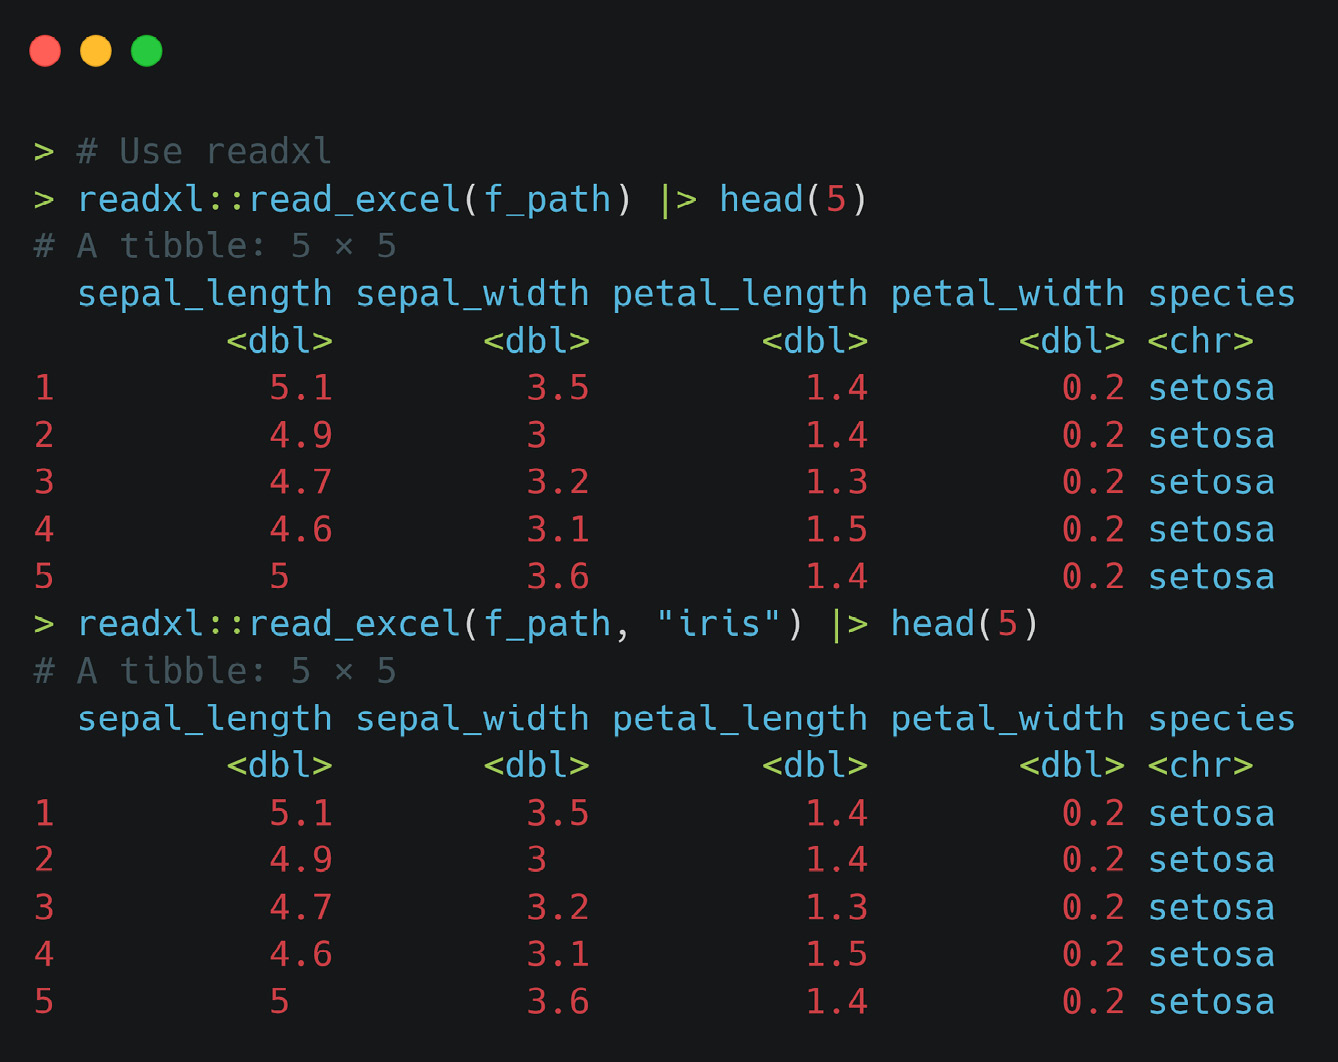
Figure 1.3 – Using the readxl library and the read_excel() function to read the Excel file into memory
In this section, we learned how to read in an Excel file with a few different packages. While these packages can do more than simply read in an Excel file, that is what we needed to focus on in this section. You should now be familiar with how to use the readxl::read_excel(), xlsx::read.xlsx(), and openxlsx::read.xlsx() functions.
Building upon our expertise in reading Excel files into R, we’ll now embark on the next phase of our journey: unraveling the secrets of efficiently extracting data from multiple sheets within an Excel file.