

Building and running the project
In this section, we will learn how to build and run the project and introduce some useful tools to help you test the APIs. To make it compatible with all platforms, we will use .NET CLI commands to build and run the project. We will also learn how to debug the project in VS Code.
Building the project
The easiest way to build and run the project is to use the dotnet command. You can run the following command to build the project:
dotnet build
The preceding command will build the project and its dependencies and generate a set of binaries. You can find these binaries in the bin folder. The bin folder is the default output folder for the dotnet build command. You can use the --output option to specify the output folder. However, it is recommended to use the default bin folder. The binaries are some Intermediate Language (IL) files with a .dll extension.
You might see the following popups when you use VS Code to open the project:

Figure 2.3 – VS Code prompts to restore dependencies
This is because VS Code inspects that the project is a .NET project, and it is trying to restore the dependencies. You can click the Restore button to restore the dependencies. Similarly, if you see other prompts from VS Code to add assets to debug the project, please select Yes in the dialog:

Figure 2.4 – VS Code prompts to add required assets to build and debug
Some commands, such as dotnet build, dotnet run, dotnet test, and dotnet publish, will implicitly restore dependencies. So don't worry if you missed out on these prompts.
If no errors or warnings are shown, that means the build is successful.
Running the project
You can run the following command to run the project:
dotnet run
The dotnet run command is a convenient way of running the project from the source code. Keep in mind that it is useful in development, but not for production. The reason is that if the dependencies are outside of the shared runtime, the dotnet run command will resolve the dependencies from the NuGet cache. To run the application in production, you need to create a deployment package with the dotnet publish command and deploy it. We will explore the deployment process in future chapters.
You should be able to see the following output:
Building...info: Microsoft.Hosting.Lifetime[14]
      Now listening on: https://localhost:7291
info: Microsoft.Hosting.Lifetime[14]
      Now listening on: http://localhost:5247
info: Microsoft.Hosting.Lifetime[0]
      Application started. Press Ctrl+C to shut down.
info: Microsoft.Hosting.Lifetime[0]
      Hosting environment: Development
info: Microsoft.Hosting.Lifetime[0]
      Content root path: C:\example_code\chapter2\MyFirstApi\MyFirstApi
info: Microsoft.Hosting.Lifetime[0]
      Application is shutting down...
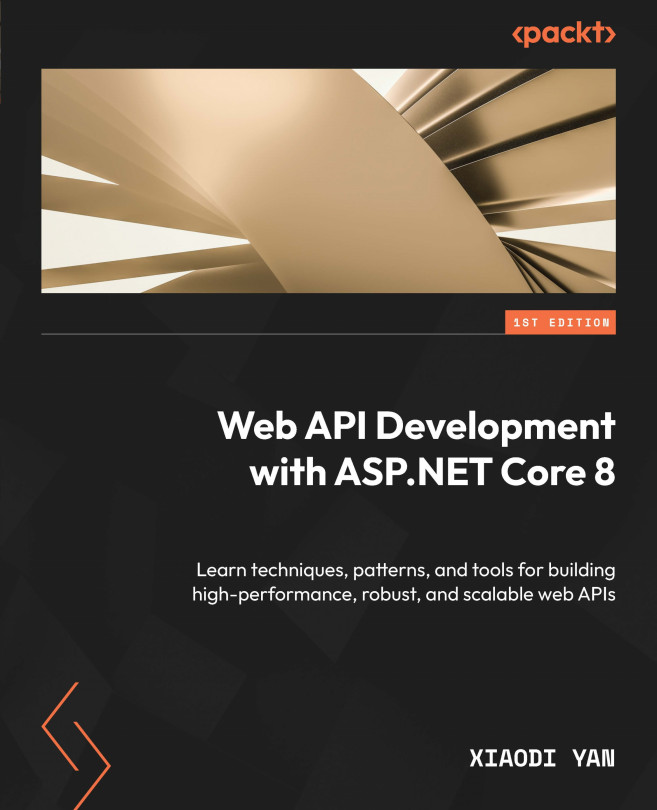
There is a link in the output, such as http://localhost:5247. The port number was randomly generated when we created the project. In a browser, navigate to http://localhost:<your_port>/swagger. You will see the web API documentation with Swagger UI, which offers a web-based UI to provide information and tools to interact with the API. You can use Swagger UI to test APIs:
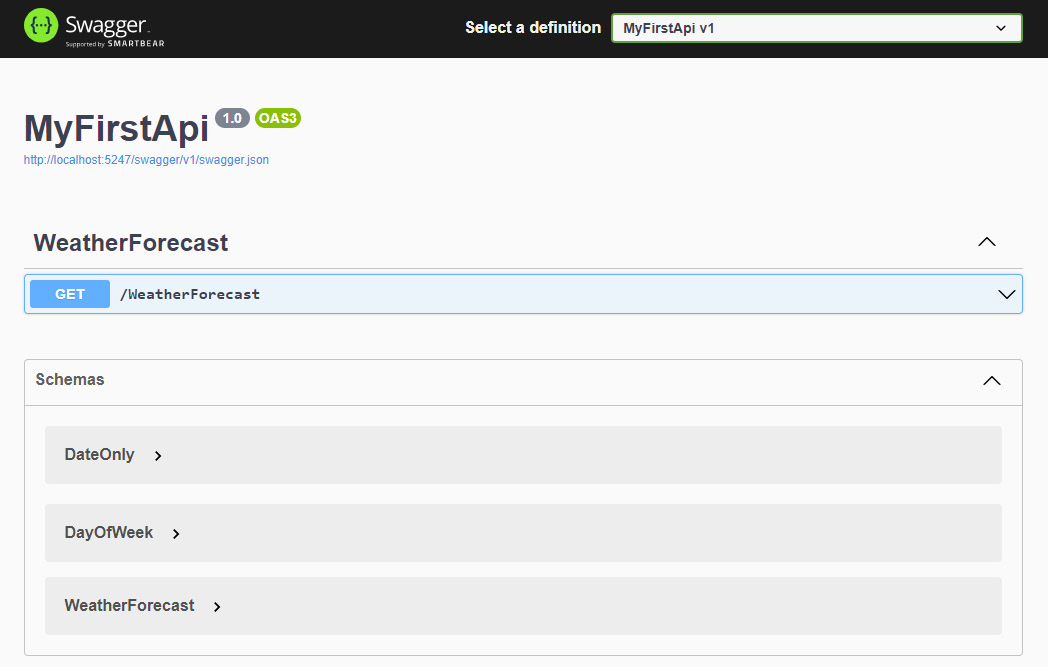
Figure 2.5 – Swagger UI
The API project is now running! You can see the web API template provides a /WeatherForecast endpoint. If you navigate to the http://localhost:5247/WeatherForecast link in the browser, you will see the API response.
To support HTTPS, you may need to trust the HTTPS development certificate by running the following command:
dotnet dev-certs https --trust
You will see a dialog if the certificate was not previously trusted. Select Yes to trust the development certificate:
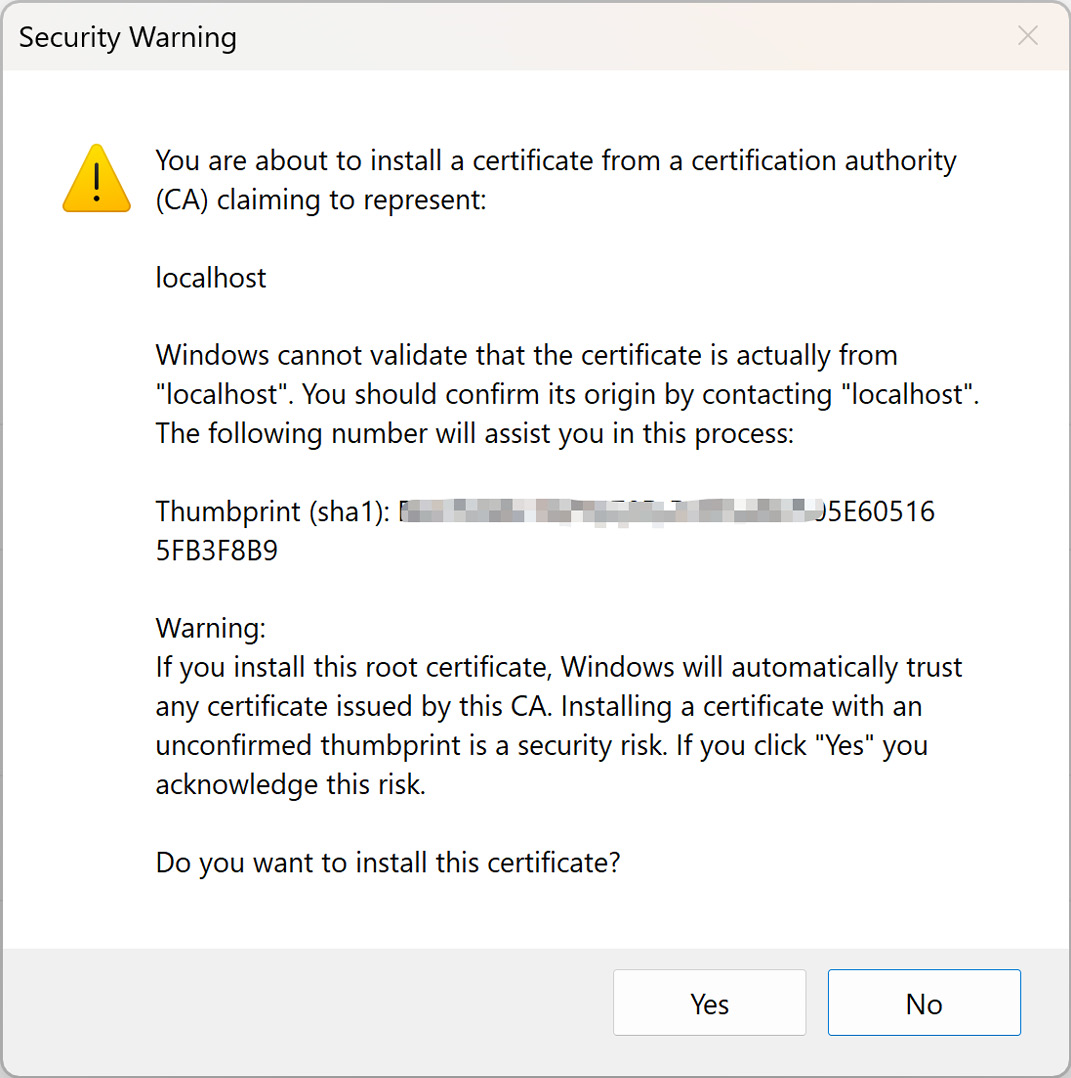
Figure 2.6 – Installing the certificate for local development
Please note that the preceding command does not work on Linux. See your Linux distribution documentation for more details.
Changing the port number
The port number is defined in the launchSettings.json file in the Properties folder. You can change the port number by editing the file. Based on the convention, when the web API project was created, a port from 5000 to 5300 will be selected for HTTP, and from 7000 to 7300 for HTTPS. Here is an example of the launchSettings.json file:
{  "$schema": "https://json.schemastore.org/launchsettings.json",
  ...
  "profiles": {
    "https": {
      "commandName": "Project",
      "dotnetRunMessages": true,
      "launchBrowser": true,
      "launchUrl": "swagger",
      "applicationUrl": "https://localhost:7291;http://localhost:5247",
      "environmentVariables": {
        "ASPNETCORE_ENVIRONMENT": "Development"
      }
    },
    ...
  }
}
You can update the port number here. Just keep in mind that the port number should be unique on your machine to avoid conflicts.
Hot Reload
When you use dotnet run to run the project, if you change the code, you need to stop the project and start it again. If your project is complicated, it takes time to stop and restart. To speed up development, you can use the dotnet watch command to enable the Hot Reload feature.
.NET Hot Reload is a feature that allows you to apply code changes to a running app without restarting the app. It was first provided with .NET 6. Instead of using dotnet run, you can use dotnet watch to activate Hot Reload in development. Once you update the code, the web browser will automatically refresh the page. However, Hot Reload does not support all code changes. In some cases, dotnet watch will ask you if you want to restart the application. There are some options: Yes, No, Always, and Never. Choose the appropriate option for the code change you want to apply, as shown next:
dotnet watch  File changed: .\Services\IService.cs.dotnet watch  Unable to apply hot reload because of a rude edit.
   Do you want to restart your app - Yes (y) / No (n) / Always (a) / Never (v)?
The API project is now running, and we can start to test the API.
Testing the API endpoint
The browser can send a GET request easily, but it is not as simple for POST endpoints. There are various ways to call the API for testing purposes, such as Swagger UI, Postman, and other tools. In this section, we will introduce some tools you can use in the development stage.
Swagger UI
We introduced how to use SwaggerHub to design APIs in Chapter 1. From version 5.0, ASP.NET Core enables OpenAPI support by default. It uses the Swashbuckle.AspNetCore NuGet package, which provides the Swagger UI to document and test the APIs.
We can use Swagger UI to test the API directly. Expand the first /WeatherForecast API in Swagger UI and click the Try it out button. You will see an Execute button. Click the button, and you will see the following response:
Figure 2.7 – Testing an endpoint in Swagger UI
Figure 2.7 demonstrates that the API is functioning correctly and is providing the expected response. To learn more about Swagger and OpenAPI, you can check the following links:
- Swagger: https://swagger.io/
- OpenAPI: https://www.openapis.org/
- SmartBear: https://www.smartbear.com/
Postman
Postman is a powerful API platform for building and using APIs. It is widely used by many individual developers and organizations. You can download it here: https://www.postman.com/downloads/.
Click the + button to create a new tab. Use http://localhost:5247/WeatherForecast as the URL. Then, click the Send button. You will see the response next:
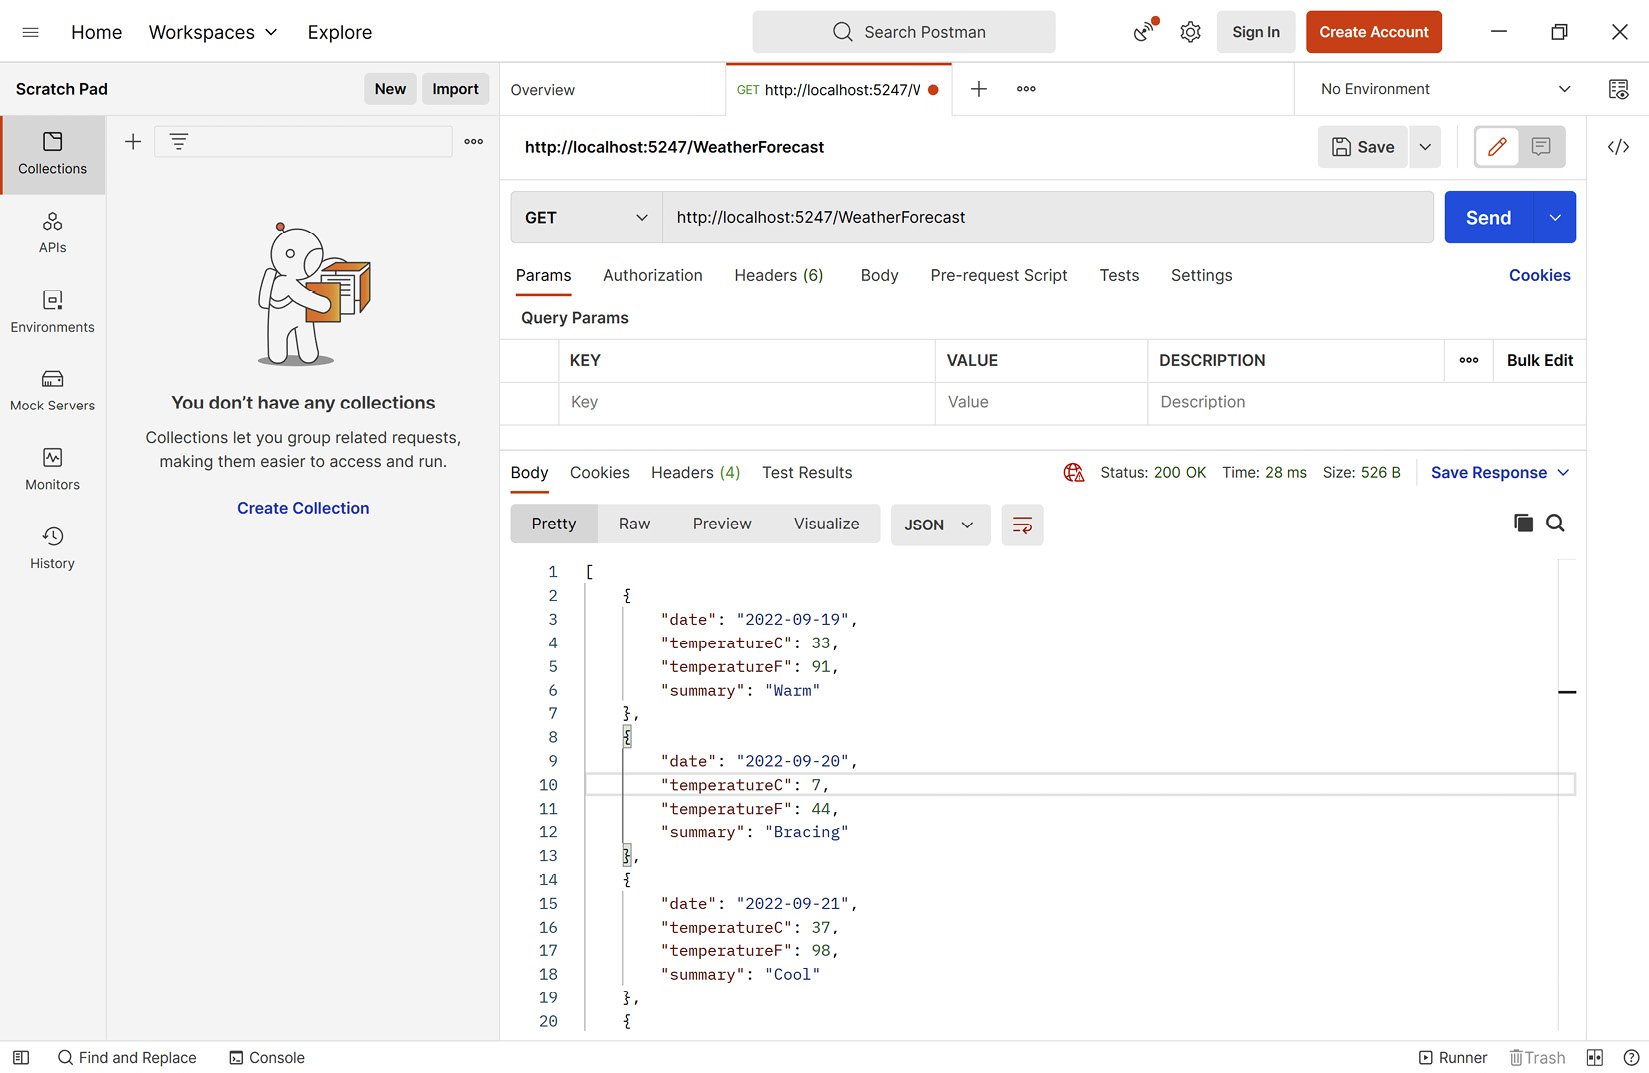
Figure 2.8 – Using Postman to call the API
Postman provides a rich set of features to test APIs. To learn more about Postman, check the official documentation: https://learning.postman.com/docs/getting-started/introduction/.
HttpRepl
HTTP Read-Eval-Print Loop (HttpRepl) is a command-line tool that allows you to test APIs. It is lightweight and cross-platform, so it can run anywhere. It supports the GET, POST, PUT, DELETE, HEAD, OPTIONS, and PATCH HTTP verbs.
To install HttpRepl, you can use the following command:
dotnet tool install -g Microsoft.dotnet-httprepl
After the installation, you can use the following command to connect to our API:
httprepl <ROOT URL>/
<ROOT URL> is the base URL of the web API, such as the following:
httprepl http://localhost:5247/
After the connection is built, you can use the ls or dir command to list the endpoints, such as the following:
http://localhost:5247/> ls.                 []
WeatherForecast   [GET]
The preceding command shows the WeatherForecast endpoint supports a GET operation. Then, we can use the cd command to navigate to the endpoint, such as the following:
http://localhost:5247/> cd WeatherForecast/WeatherForecast [GET]
Then, we can use the get command to test the endpoint, such as the following:
http://localhost:5247/WeatherForecast> get
The output looks like this:
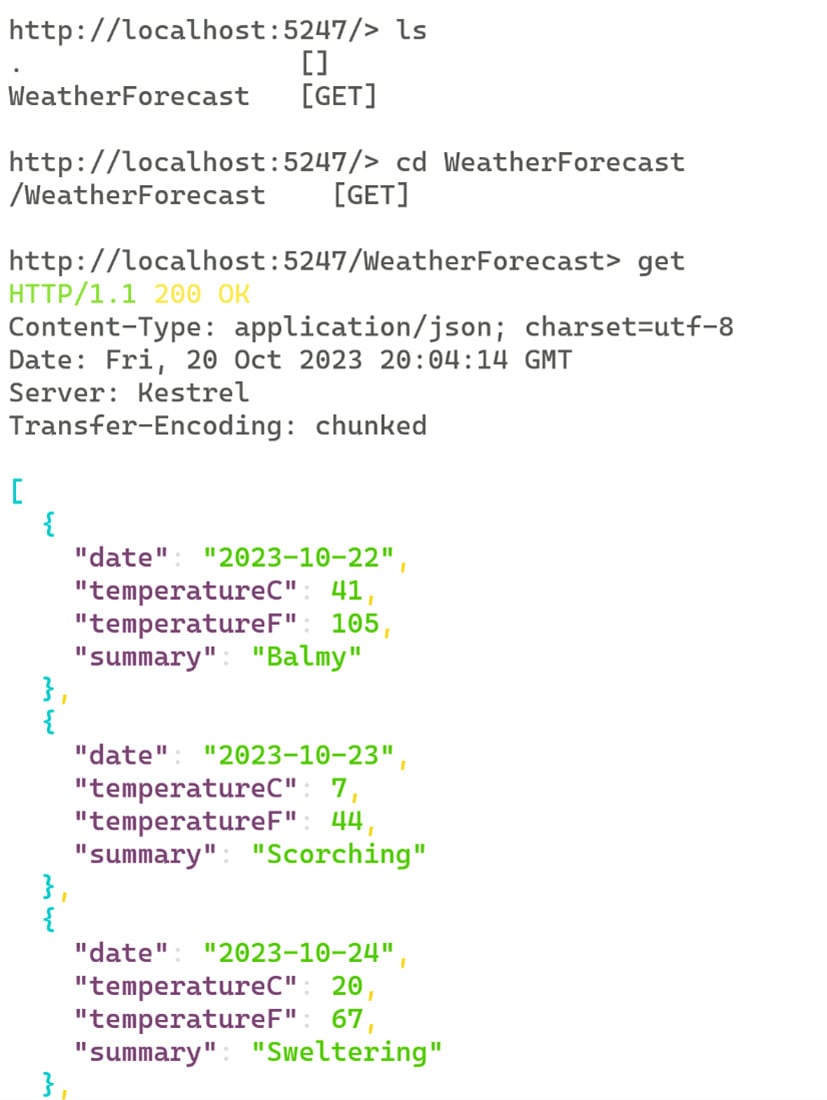
Figure 2.9 – Output of HttpRepl
To disconnect, press Ctrl + C to exit.
You can find more information about HttpRepl at https://docs.microsoft.com/en-us/aspnet/core/web-api/http-repl/.
Thunder Client
If you prefer to do everything in VS Code, Thunder Client is a great tool for testing APIs. Thunder Client is a lightweight REST API client extension for VS Code, allowing users to test their APIs without having to leave VS Code. This makes it an ideal choice for developers who want to streamline their workflow:
Figure 2.10 – The Thunder Client extension for VS Code
After the installation, click the Thunder Client icon on the Action bar. From the sidebar, click the New Request button. The following UI will be shown:
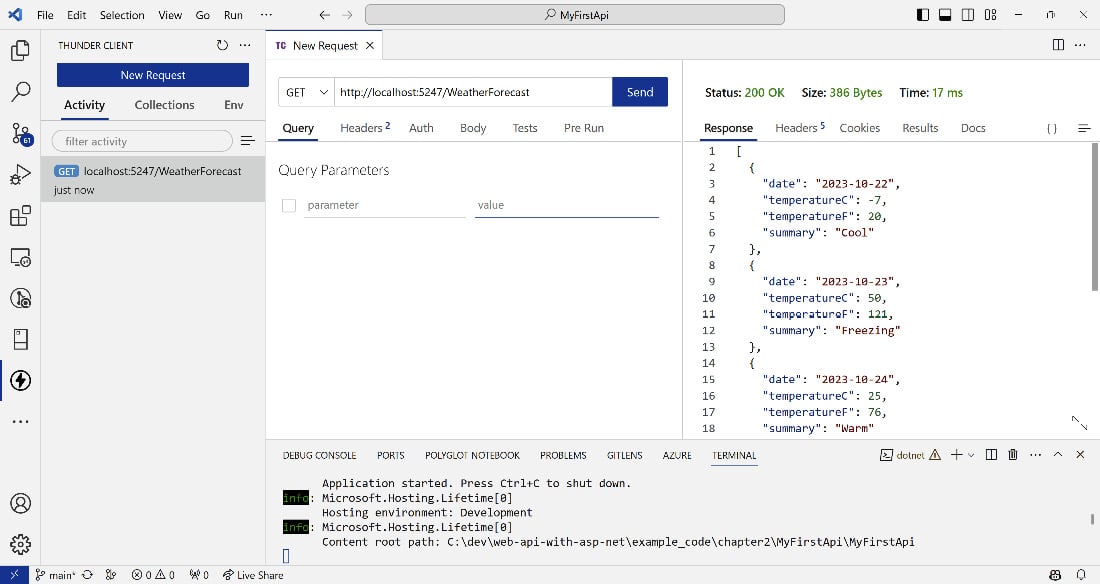
Figure 2.11 – Testing the API with Thunder Client
To learn more about Thunder Client, visit their GitHub page: https://github.com/rangav/thunder-client-support.
Using .http files in VS 2022
If you use Visual Studio 2022, you can use the .http file to test the API. The .http file is a text file that contains definitions of HTTP requests. The latest ASP.NET Core 8 template project provides a default .http file. You can find it in the MyFirstApi folder. The content of the file is as follows:
@MyFirstApi_HostAddress = http://localhost:5247GET {{MyFirstApi_HostAddress}}/weatherforecast/
Accept: application/json
###
The first line defines a variable named MyFirstApi_HostAddress with the value of the root URL of the API. The second line defines a GET request to the /weatherforecast endpoint. The third line defines an Accept header. In this case, it accepts the application/json content type. Open this file in Visual Studio 2022, and you will see the Send Request button on the left side of the request. Click the button, and you will see the response as follows:
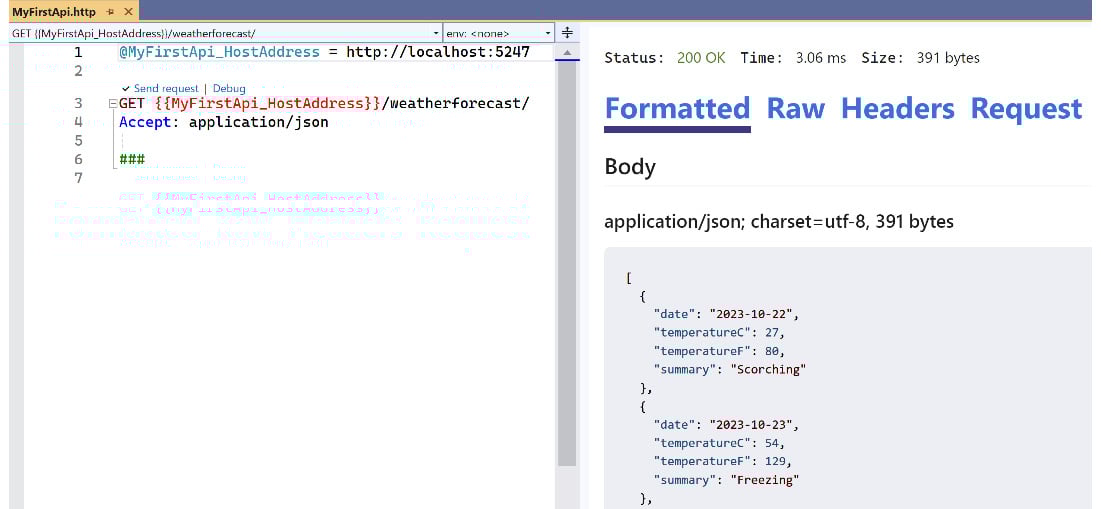
Figure 2.12 – Using the .http file to test the API in Visual Studio 2022
However, when this book was written, the .http files lacked some features, such as environment variables. Also, this feature is only available in Visual Studio 2022, so we will not use it in this book. But if you are interested in exploring this feature further, please refer to the Microsoft docs at https://learn.microsoft.com/en-us/aspnet/core/test/http-files for more information.
We have introduced some tools to test APIs. Let's now learn how to debug APIs.
Debugging
VS Code has a built-in debugging feature that allows you to debug code. Unlike Visual Studio, it needs a launch.json configuration for debugging. When you open an ASP.NET Core project in VS Code, it will prompt you to add some assets. If you choose Yes, VS Code can generate a launch.json file in the .vscode folder.
If you missed it, you can add it manually from the Debug view:
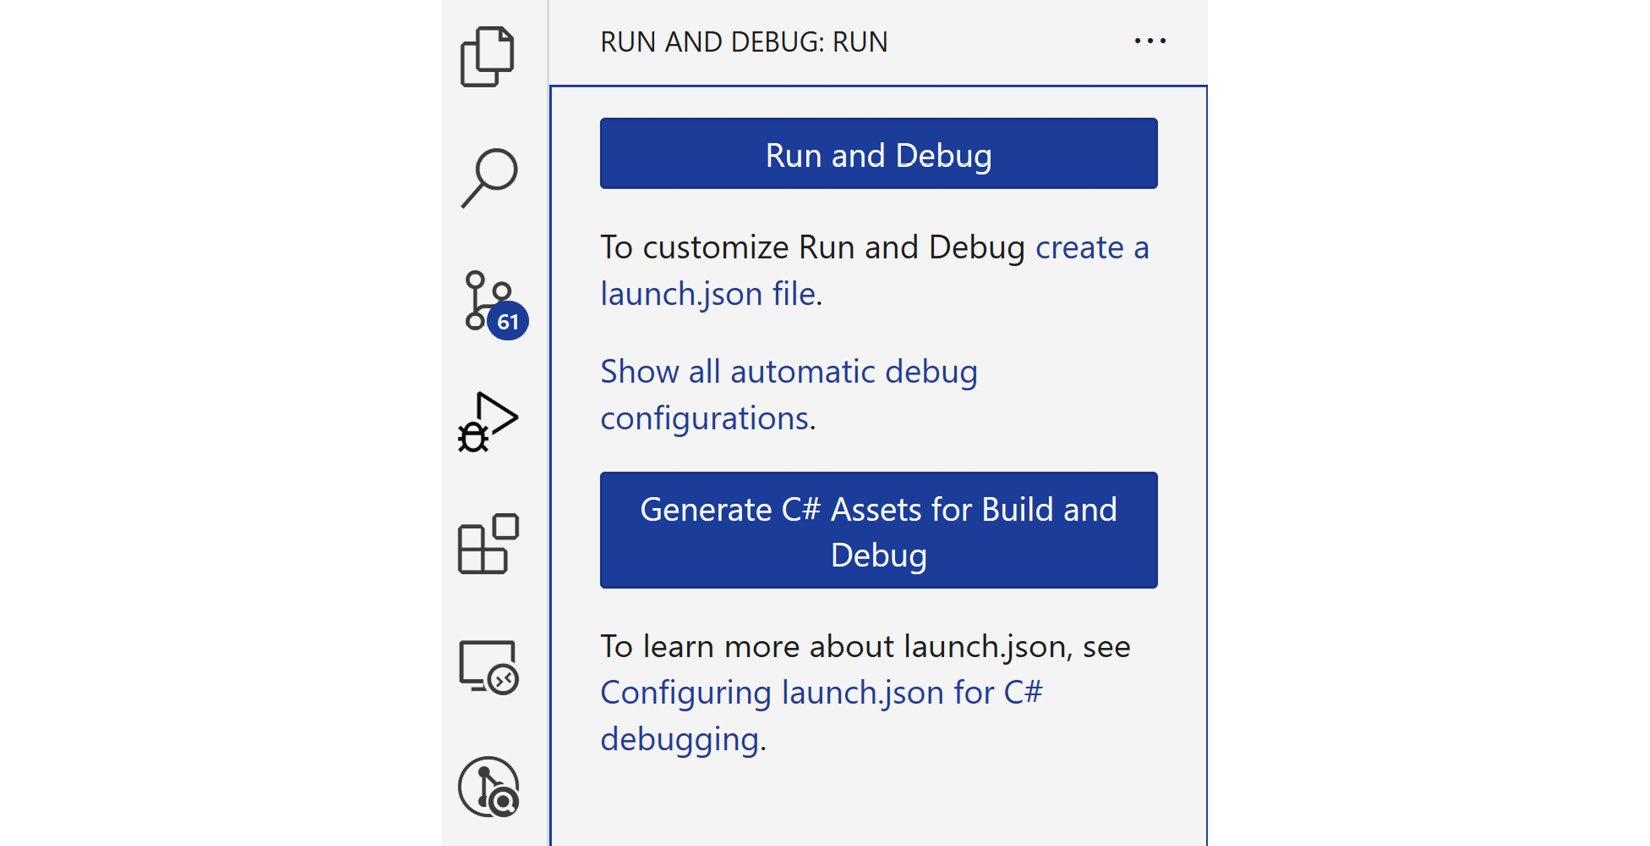
Figure 2.13 – Creating a launch.json file from the Debug view
If you cannot see the buttons in Figure 2.13, you can open the Command Palette by pressing Ctrl + Shift + P (on Windows) or Command + Shift + P (on macOS), then type .net and choose .NET: Generate Assets for Build and Debug. It will then generate a launch.json file in the .vscode folder:
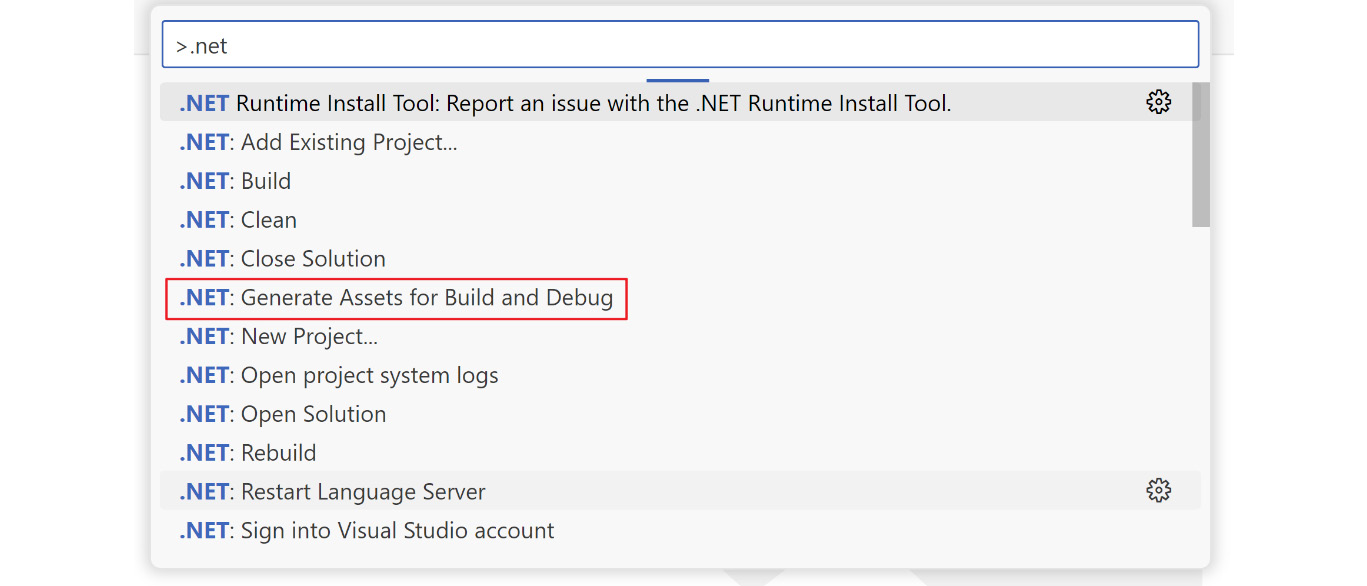
Figure 2.14 – Generating a launch.json file from the Command Palette
The content of the default launch.json configuration is shown next:
{    "version": "0.2.0",
    "configurations": [
        {
            // Use IntelliSense to find out which attributes exist for C# debugging
            // Use hover for the description of the existing attributes
            // For further information visit https://github.com/dotnet/vscode-csharp/blob/main/debugger-launchjson.md.
            "name": ".NET Core Launch (web)",
            "type": "coreclr",
            "request": "launch",
            "preLaunchTask": "build",
            // If you have changed target frameworks, make sure to update the program path.
            "program": "${workspaceFolder}/bin/Debug/net8.0/MyFirstApi.dll",
            "args": [],
            "cwd": "${workspaceFolder}",
            "stopAtEntry": false,
            // Enable launching a web browser when ASP.NET Core starts. For more information: https://aka.ms/VSCode-CS-LaunchJson-WebBrowser
            "serverReadyAction": {
                "action": "openExternally",
                "pattern": "\\bNow listening on:\\s+(https?://\\S+)"
            },
            "env": {
                "ASPNETCORE_ENVIRONMENT": "Development"
            },
            "sourceFileMap": {
                "/Views": "${workspaceFolder}/Views"
            }
        },
        {
            "name": ".NET Core Attach",
            "type": "coreclr",
            "request": "attach"
        }
    ]
}
This file specifies the configuration for debugging. Some important attributes are described next:
- The
programattribute specifies the path to the executable file - The
argsattribute specifies the arguments to pass to the executable file - The
cwdattribute specifies the working directory - The
envattribute specifies the environment variables
We do not need to change anything in this file now.
Set up a breakpoint in the app. For example, we can set a breakpoint in the Get() method in the WeatherForecastController.cs file by clicking in the left margin of the code window. Once the breakpoint is set, you will see a red dot before the line number in the left margin:
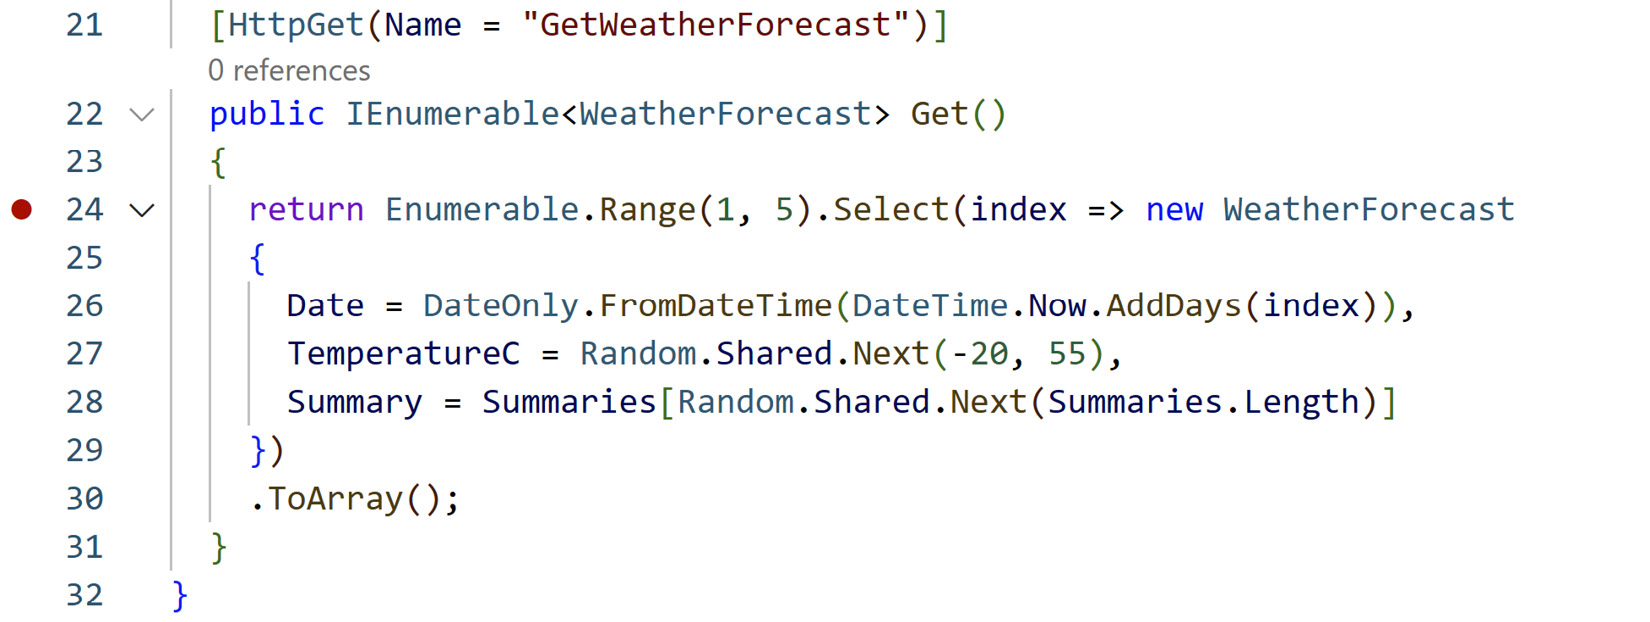
Figure 2.15 – Setting up a breakpoint in VS Code
To debug the app, open the Debug view by selecting the Debugging icon on the left-side menu. Make sure you choose the correct debugging configuration from the drop-down menu. For this case, please select .NET Core Launch (web). Then, select the green arrow at the top of the pane:

Figure 2.16 – Debugging the API in VS Code
Send a request from any of the tools in the previous section, and you will see the program execution stops when it reaches the breakpoint, as shown next:

Figure 2.17 – Hitting the breakpoint in VS Code
The Locals section of the VARIABLES window will display the values of variables that are defined in the current context.
You can also type a variable in the DEBUG CONSOLE window to check the value directly. To execute the next step, you can use the control toolbar at the top of the VS Code window. You can run the code line by line to monitor its execution. It is helpful if we need to know how the program works.
Now we have learned how to build, run, and test APIs, it is time to look at the code of APIs.