


Simplicity of visualization of pandas data
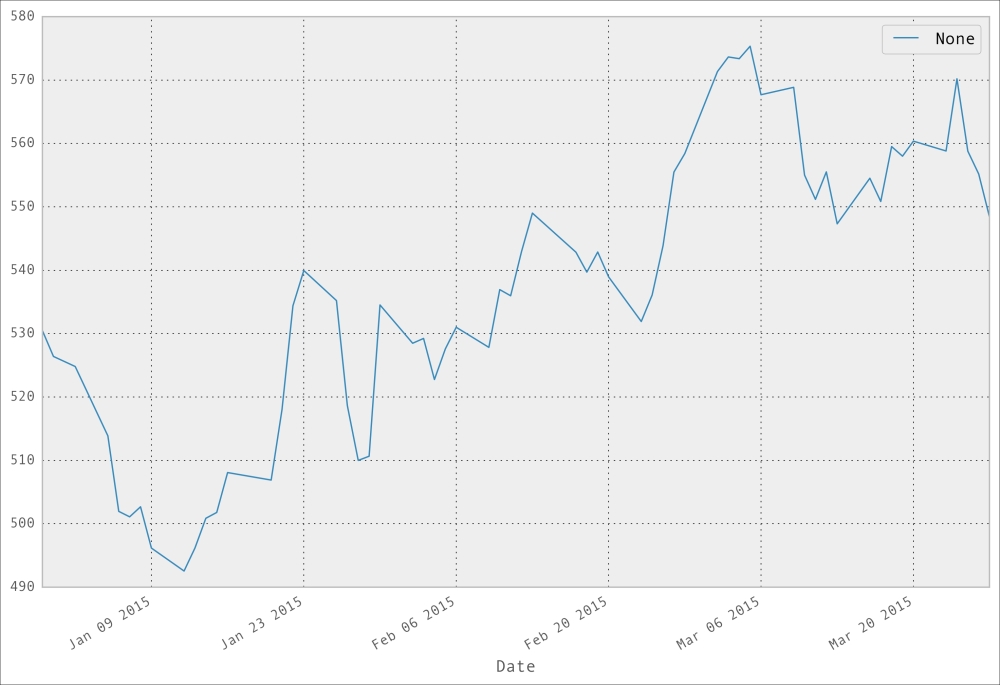
Visualizing pandas data is incredibly simple as pandas is built with tight integration with the matplotlib framework. To demonstrate how simple it is to visualize data with pandas, the following code plots the stock data we just retrieved from Yahoo! Finance:
In [40]:
   # plot the Adj Close values we just read in
   goog.plot(y='Adj Close');
Note
We will dive deeper and broader into pandas data visualization in a section dedicated to it later in this book.


