
Before we get into modelling and try to figure out what the trade-off is, let's understand what bias and variance are from the following diagram:
There are two types of errors that are developed in the bias-variance trade off, as follows:
- Training error: This is a measure of deviation of the fitted value from the actual value while predicting the output by using the training inputs. This error depends majorly on the model's complexity. As the model's complexity increases, the error appears to plummet.
- Development error: This is a measure of deviation of the predicted value, and is used by the development set as input (while using the same model trained on training data) from the actual values. Here, the prediction is being done on unseen data. We need to minimize this error. Minimizing this error will determine how good this model will be in the actual scenario.
As the complexity of the algorithm keeps on increasing, the training error goes down. However, the development error or validation error keeps going down until a certain point, and then rises, as shown in the following diagram:
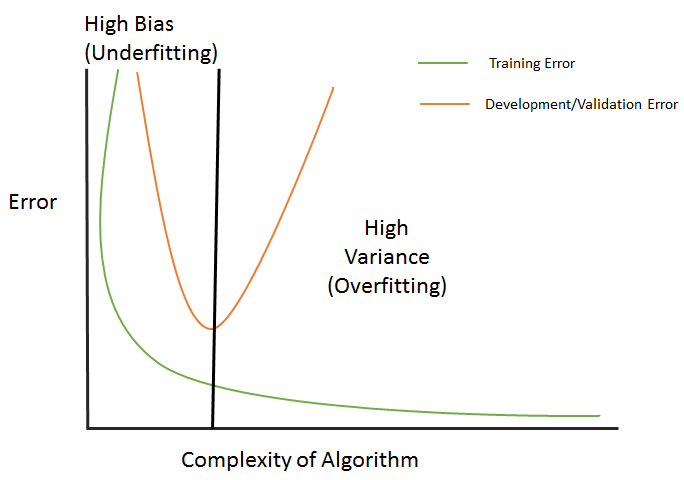
The preceding diagram can be explained as follows:
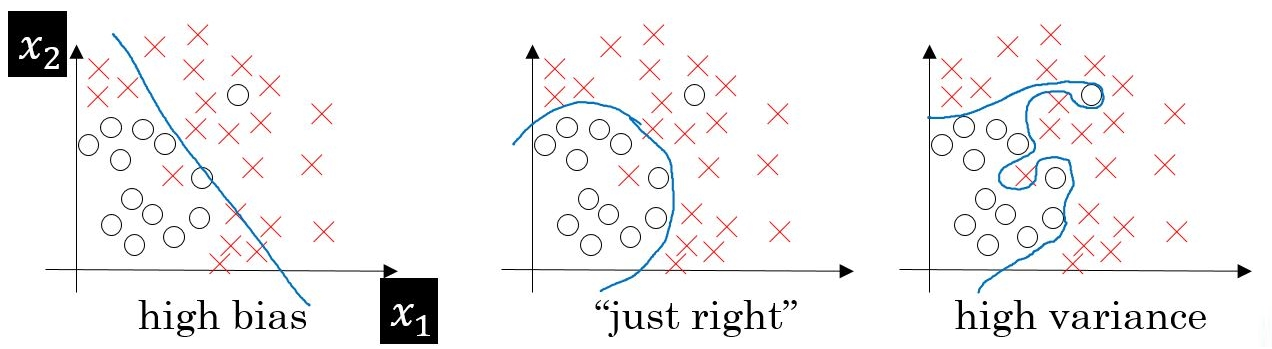
- Underfitting: Every dataset has a specific pattern and properties due to the existing variables in the dataset. Along with that, it also has a random and latent pattern which is caused by the variables that are not part of the dataset. Whenever we come up with a model, the model should ideally be learning patterns from the existing variables. However, the learning of these patterns also depends on how good and robust your algorithm is. Let's say we have picked up a model that is not able to derive even the essential patterns out of the dataset—this is called underfitting. In the preceding plots, it is a scenario of classification and we are trying to classify x and o. In plot 1, we are trying to use a linear classification algorithm to classify the data, but we can see that it is resulting in lots of misclassification errors. This is a case of underfitting.
- Overfitting: Going further afield from plot 1, we are trying to use complex algorithms to find out the patterns and classify them. It is noticeable that the misclassification errors have gone down in the second plot, since the complex model being used here is able to detect the patterns. The development error (as shown in the preceding diagram) goes down too. We will increase the complexity of the model and see what happens. Plot 3 suggests that there is no misclassification error in the model now. However, if we look at the plot below it, we can see that the development error is way too high now. This happens because the model is learning from the misleading and random patterns that were exhibited due to the non-existent variables in the dataset. This means that it has started to learn the noise that's present in the set. This phenomenon is called overfitting.
- Bias: How often have we seen this? This occurs in a situation wherein we have used an algorithm and it doesn't fit properly. This means that the function that's being used here has been of little relevance to this scenario and it's not able to extract the correct patterns. This causes an error called bias. It crops up majorly due to making a certain assumption about the data and using a model that might be correct but isn't. For example, if we had to use a second degree polynomial for a situation, we would use simple linear regression, which doesn't establish a correct relationship between the response and explanatory variables.
- Variance: When we have a dataset that is being used for training the model, the model should remain immune, even if we change the training set to a set that's coming from the same population. If variation in the dataset brings in a change in the performance of the model, it is termed a variance error. This takes place due to noise (an unexplained variation) being learned by the model and, due to that, this model doesn't give a good result on unseen data:
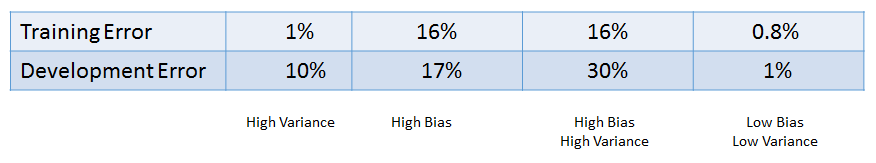
We will explain the preceding diagram as follows:
- If the Training Error goes down and (Development Error-Training Error) rises, it implies a High Variance situation (scenario 1 in the preceding table)
- If the Training Error and Development Error rises and (Development Error-Training Error) goes down, it implies a High Bias situation (scenario 2 in the preceding table)
- If the Training Error and Development Error rises and (Development Error-Training Error) goes up as well, it implies High Bias and High Variance (scenario 3 in the preceding table)
- If the Training Error goes up and the Development Error declines, that is, (Development Error-Training Error) goes down, it implies Low Bias and Low Variance (scenario 4 in the preceding table)
We should always strive for the fourth scenario, which depicts the training error being low, as well as a low development set error. In the preceding table, this is where we have to find out a bias variance trade-off, which is depicted by a vertical line.
Now, the following question arises: how we can counter overfitting? Let's find out the answer to this by moving on to the next section.