
Data ranking
Another common way to present small datasets is to rank the data, assigning ordinal labels (first, second, third, and so on) to the data points. This can be done by sorting the data on the key field.
Figure 3-17 shows an Excel worksheet with data on students' grade-point averages (GPAs).
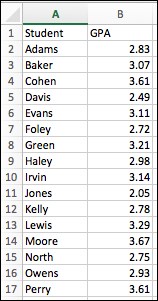
Figure 3-17. Excel data
To rank these, select Tools | Data Analysis | Rank and Percentile to bring up the Moving Average dialog box:
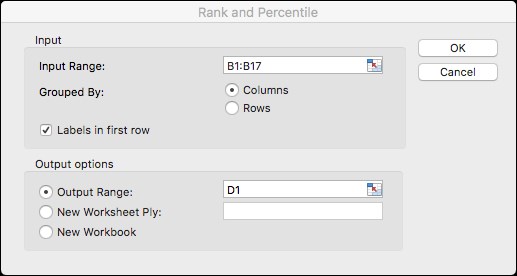
Figure 3-18. Ranking scores in Excel
Here, we have identified cells B1 to B17 as holding the data, with the first cell being a label. The output is to start in cell D1. The results are shown in the following screenshot:
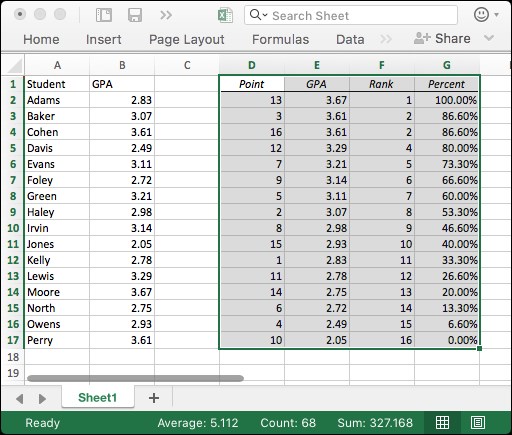
Figure 3-19. Results from Excel ranking
Column D contains the (relative) index of the record being ranked. For example, cells D3-G3 show the record of the third student in the original list (in column A) with name Cohen: that student ranks second, at the 86th percentile.