Let's look at some of the model evaluation techniques that are currently being used.
Model evaluation
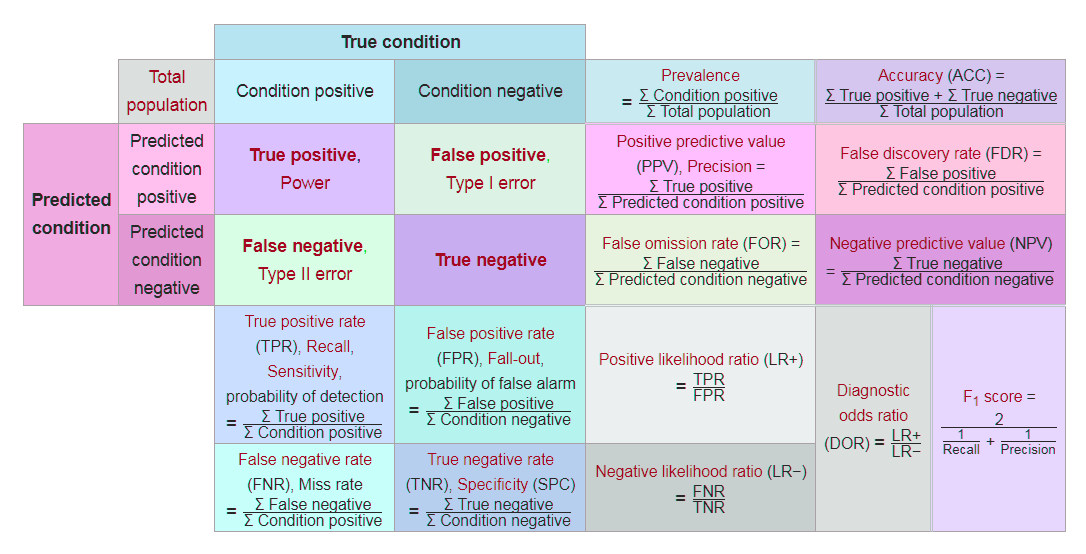
Confusion matrix
A confusion matrix is a table that helps in assessing how good the classification model is. It is used when true values/labels are known. Most beginners in the field of data science feel intimidated by the confusion matrix and think it looks more difficult to comprehend than it really is; let me tell you—it's pretty simple and easy.
Let's understand this by going through an example. Let's say that we have built a classification model that predicts whether a customer would like to buy a certain product or not. To do this, we need to assess the model on unseen data.
There are two classes:
- Yes: The customer will buy the product
- No: The customer will not buy the product
From this, we have put the matrix together:
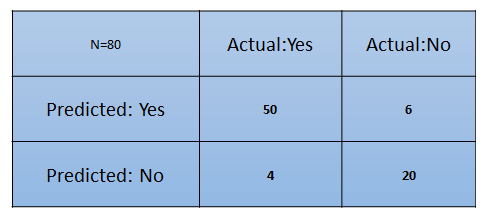
What are the inferences we can draw from the preceding matrix at first glance?
- The classifier has made a total of 80 predictions. What this means is that 80 customers were tested in total to find out whether he/she will buy the product or not.
- 54 customers bought the product and 26 didn't.
- The classifier predicts that 56 customers will buy the product and that 24 won't:
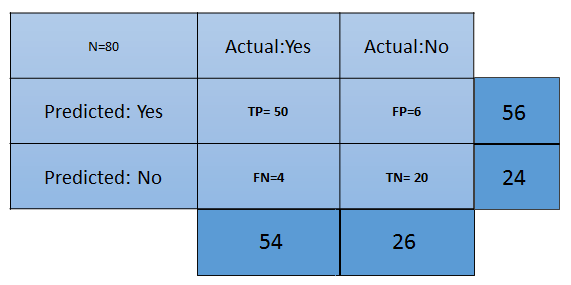
The different terms pertaining to the confusion matrix are as follows:
- True Positive (TP): These are the cases in which we predicted that the customer will buy the product and they did.
- True Negative (TN): These are the cases in which we predicted that the customer won't buy the product and they didn't.
- False Positive (FP): We predicted Yes the customer will buy the product, but they didn't. This is known as a Type 1 error.
- False Negative (FN): We predicted No, but the customer bought the product. This is known as a Type 2 error.
Now, let's talk about a few metrics that are required for the assessment of a classification model:
- Accuracy: This measures the overall accuracy of the classifier. To calculate this, we will use the following formula: (TP+TN)/Total cases. In the preceding scenario, the accuracy is (50+20)/80, which turns out to be 0.875. So, we can say that this classifier will predict correctly in 87.5% of scenarios.
- Misclassification rate: This measures how often the classifier has got the results wrong. The formula (FP+FN)/Total cases will give the result. In the preceding scenario, the misclassification rate is (6+4)/80, which is 0.125. So, in 12.5% of cases, it won't produce correct results. It can also be calculated as (1- Accuracy).
- TP rate: This is a measure of what the chances are that it would predict yes as the answer, and the answer actually is yes. The formula to calculate this is TP/(Actual:Yes). In this scenario, TPR = (50/54)= 0.92. It's also called Sensitivity or Recall.
- FP rate: This is a measure of what the chances are that it would predict yes, when the actual answer is no. The formula to calculate this rate is FP/(Actual:No). For the preceding example, FPR = (6/26)= 0.23.
- TN rate: This is a measure of what the chances are that it would predict no, when the answer is actually no. The formula to calculate this is TN/(Actual:No). In this scenario, TNR= (20/26)= 0.76. It can also be calculated using (1-FPR). It's also called Specificity.
- Precision: This is a measure of correctness of the prediction of yes out of all the yes predictions. It finds out how many times a prediction of yes was made correctly out of total yes predictions. The formula to calculate this is TP/(Predicted:Yes). Here, Precision = (50/56)=0.89.
- Prevalence: This is a measure of how many yes were given out of the total sample. The formula is (Actual:Yes/ Total Sample). Here, this is 54/80 = 0.67.
- Null error rate: This is a measure of how wrong the classifier would be if it predicted just the majority class. The formula is (Actual:No/Total Sample). Here, this is 26/80=0.325.
- Cohen's Kappa value: This is a measure of how well the classifier performed compared to how well it would have performed simply by chance.
- F-Score: This is a harmonic mean of recall and precision, that is, (2*Recall*Precision)/(Recall+Precision). It considers both Recall and Precision as important measures of a model's evaluation. The best value of the F-score is 1, wherein Recall and Precision are at their maximum. The worst value of the F-score is 0. The higher the score, the better the model is: