


Debugging CUDA code with VS Code
Debugging CUDA applications can sometimes feel like untangling a knot in the dark, but with the right tools the process becomes much more manageable. The official documentation for cuda-gdb, NVIDIA’s debugger for CUDA applications, can be found at https://docs.nvidia.com/cuda/cuda-gdb. However, a powerful combination for CUDA debugging is to use cuda-gdb with VS Code. This setup offers an intuitive interface and seamless experience for tracking down issues in GPU code.
Our setup already has everything we need to debug our code. We just need to add launch configurations for the programs we would like to debug. First, we click on the Run and Debug icon on the sidebar.
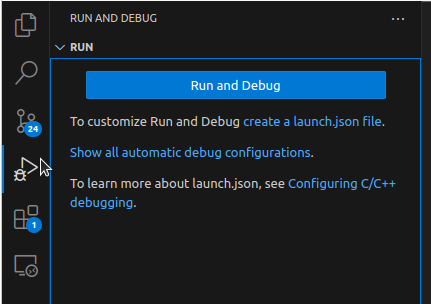
Figure 8.1: Accessing Debug configuration
As we can see in Figure 8.1, we need to create a launch.json file. This file is needed because it’s where we can configure some actions for VS Code to perform for us. To create the file click on the create a launch...


