


In this chapter, we will cover the following recipes:
Debugging source code using breakpoints
Using DataTips during debugging
Debugging a multithreaded program
Exploring the Command and Immediate windows
Making use of IntelliTrace in Visual Studio
Debugging a .NET program using the framework library source
Debugging a process that is already deployed
Being one of the best IDEs available, it may often seem that our knowledge about Visual Studio falls short when some special circumstances appear. Visual Studio provides hundreds of tools inside it and also some tools as extensions to help programmers develop software in the best possible ways. It incorporates features such as refactoring, code analysis, clone code finder, and so on to let a developer write better code and have the best experience while inside the IDE. Visual Studio has been so popular that it is not constrained to just software development; some people use it to edit documents and images, or even to publish content. It is so user friendly and easy to use that anyone can work on it at a basic level.
Debugging is the most important part of any application development process. People like to start debugging a program while developing code. Debugging is a process that lets you have a quick look at the current state of a program by walking through your code step by step and letting you identify what exactly is happening while the program is running. Developers expect an IDE to give them as much information as possible during a certain state of the program. Visual Studio has taken every step to improve the debugging experience of the IDE and make small tools to let developers find better ways to quickly find the possible problems in code (if any).
After opening the IDE, it is often the case that people start typing some code. But, it is unlikely that developers will always finish writing the code before they start debugging. After some part of the development is done, they tend to start debugging it to have a better understanding of the logic and functionalities. Some people start debugging even before they have written a single line of code. So debugging is not just identifying bugs, it is determining the merits and demerits of the code as well. Debugging inside Visual Studio is perhaps the best selling point of the IDE.
Visual Studio separates the environment layout completely while debugging. After writing your code, when you press F5 on the keyboard or go to Debug | Start Debugging, Visual Studio adjusts the whole layout of the window and creates an environment that is best suited for debugging; for instance, when you are in the debug mode, generally the Solution Explorer, Toolbox, the Properties window, and so on get hidden. Instead, windows such as IntelliTrace, Autos, Locals, Watch, and Call Stack automatically open inside the IDE and get docked/adjusted to the layout inside the IDE. The IDE is smart enough to store the layout information of all the opened windows inside it when the debugging session is closed by the user for a particular project. Therefore, when you start debugging again, the IDE provides you an environment that is exactly adjusted to the left-hand side when the previous debug session is closed.
In this chapter, we will try to demonstrate some of the important debugging tools available in the IDE. Let's start with a simple class that consists of a few properties and methods:
public class TestClass
{
  public int Start { get; set; }
  public int End { get; set; }

  public TestClass(int start, int end)
  {
    this.Start = start;
    this.End = end;
  }
  public int GetSum(int start, int end)
  {
    var sum = 0;
    for (var i = start; i <= end; i++)
      sum += i;
    return sum;
  }

  public string GetMessage()
  {
    var sum = this.GetSum(this.Start, this.End);
    return string.Format("Sum of all numbers between {0} and {1}  is {2}", this.Start, this.End, sum);
  }
  public void PrintMessage()
    {
      var message = this.GetMessage();
      Console.WriteLine(message);
      Console.ReadKey(true);
    }

  }
  class Program
  {
    static void Main(string[] args)
    {
      var tclass = new TestClass(20, 30);
      tclass.PrintMessage();
    }
  }
}
The dummy code that we are using here has a TestClass, which takes two arguments and stores data in the data members Start and End. GetSum is a method that sums up all the integers between Start and End. The GetMessage returns a message after calling Sum with Start and End, and finally PrintMessage prints the message on the console.
The program creates an object of TestClass and calls PrintMessage with 20, 30. If you run the program, it shows 275 on the console.
Breakpoints are used to notify the debugger to pause execution of the program at a certain line. The debugger stores the information of the line number and source code file inside the PDB file (known as the program database). The program built in the debug mode will have more information in the PDB file than the one in the release mode. Visual Studio reads the PDB file and pauses/resumes debugging based on the Halt statement it finds during the execution of the program.
Now let's create our first source code and try out debugging for the first time:
Click on the left-hand sidebar of the code or press F9 on the keyboard being on the line where you want to pause execution of the program. The whole line will be colored in a dark red border (in general) with a red circle on the sidebar.
Press F5 on the keyboard to start the program in the debug mode.
As soon as the program gets started, it will break at the point where the breakpoint is hit. Let's suppose we put a breakpoint on the first line of the
Mainmethod where theTestClassis instantiated:
In the preceding screenshot, the red dot on the left-hand sidebar shows the breakpoint. The yellow block indicates the hit of the breakpoint. When you put the breakpoint on a line, the line is turned red by the IDE, and the current line is marked using a yellow block as shown with a small arrow on the left-hand side pane.
Press F10 to skip the line and move to the next line.
Press F11 to initiate the
PrintMessagemethod. Press F11 a couple more times to move to the actual calculation.Inspect each and every line of the code to identify your bug (if any).
To continue executing the program, press F5 again; the program will continue executing the rest of the code until it either finds another breakpoint on the code during its execution path or the program finishes execution.
The debugger is a tool attached with the Visual Studio IDE that works in the background and inspects execution of the program. It holds a database of all the debug-related information and stores it in a program database file. The Visual Studio debugger stores the checksum of the file associated with the debugger, its full path, the line number, and the number of characters of the file. When we create a breakpoint in the file, the information gets stored on the PDB file or sometimes in the memory, and this will get evaluated when the program is running under the debug mode.
The debugger cannot work in certain situations when the debug information related to the file is invalid (when file checksum fails) or does not exist. For instance, say you have compiled the executable in a different source other than the one you are debugging with. In this case, Visual Studio is capable of determining whether the source code and the process running are the same.
Now let's look at how to take advantage of breakpoints in the Visual Studio IDE.
The Visual Studio debugger is very smart and capable of doing a lot of things. You can change the execution path directly inside the debugger by not executing a certain line of the code or executing a certain line more than once.
While you are at the breakpoint, you can right-click on any line inside the IDE and select Set Next Statement or use Ctrl + Shift + F10 to move the debugger to that line, as shown in the following screenshot:
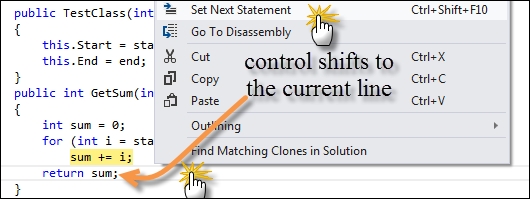
You can also drag the cursor of the current line using the mouse to move the cursor to any line in the code.
If you choose Run to Cursor from the right-click menu instead of Set Next Statement, the debugger will execute the lines in between and stop at the line that you select. If the line you select does not belong to the following execution of code, it will finish execution in regular course.
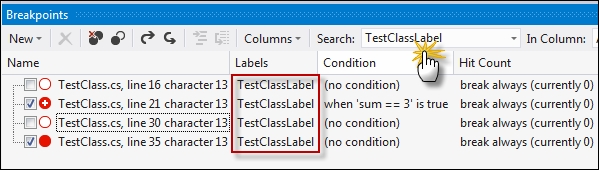
When working with a large project, there are situations when you need to label your breakpoints for better management and categorization such that you can enable/disable a certain group of breakpoints depending on your requirements. Let's put some breakpoints on the code and start debugging using F5 from the keyboard. The program will stop at the line where the first breakpoint is set, as shown in the following screenshot. Navigate to Debug | Windows | Breakpoints or press Ctrl + D + B.
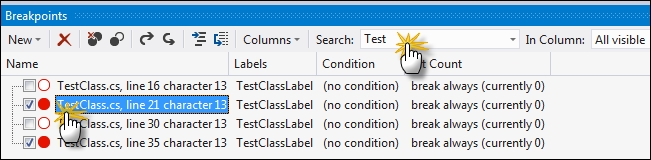
A window will appear that will show all the breakpoints you have set in the code. In the preceding screenshot, you can see TestClassLabel. Now, let us right-click either on the breakpoint in the code or in the Tool window and select Edit labels, as shown in the following screenshot:
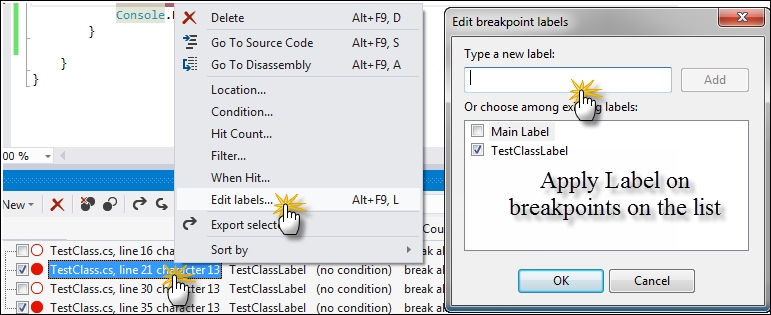
The command will pop up the Edit breakpoint labels dialog box, which lists all the labels and allows you to create a new label. Initially, it will be blank, but as you create more labels, the list will fill up. Once you have created the labels, you can choose any of the labels associated with the current breakpoint. You can also choose multiple breakpoints to select a label. Once you have selected the label for all the breakpoints individually, you can search in the Search box of the Breakpoints tool window to filter breakpoints from the list.
It is important to note that labels play a very important role in naming a breakpoint. When dealing with large projects, it will be really easy to manage breakpoints with labels to identify exactly which breakpoint it shows. The label is an alias to a breakpoint.
The breakpoint window also allows you to enable/disable an existing breakpoint. For instance, you can uncheck a breakpoint to disable the breakpoint in the actual code. Even though the breakpoint exists in the code, it is marked as disabled, and hence the program will not halt at that point.
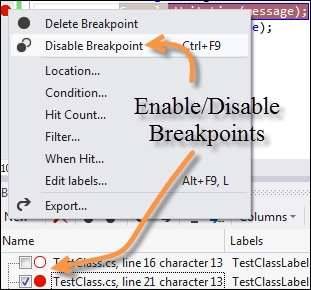
The preceding screenshot shows how to disable a breakpoint from the right-click menu. It can also be accessed using Ctrl + F9.
Breakpoints can hold conditions and often come in handy when used in the iteration of a list or numeric value. Putting a halt inside an iteration means redundant breakpoints, and when the problem arises on a certain index of the loop, it is very hard to catch the exact value of the index. Conditions can help in putting a break only when a certain precondition is met. The conditional break allows placing an expression based on the current context and breaks only when the condition is met.
Right-click on the breakpoint either in the tool window or on the sidebar pane where the red breakpoint icon is shown and select a condition, as shown in the following screenshot:
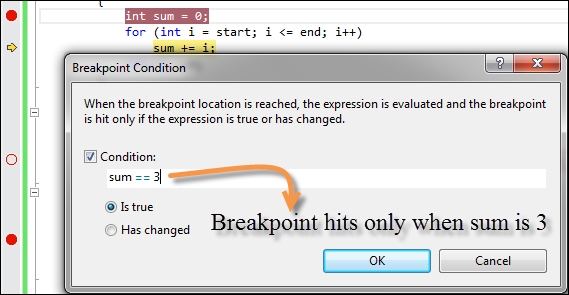
You can declare a local variable using the Watch window and use it in the conditions. The IDE validates the condition and stores it in the PDB file. The textbox that appears is also capable of showing the IntelliSense menu inside it to enhance condition writing.
The two radio buttons indicate what needs to be considered from the condition. If the condition returns a Boolean value, we choose the option Is true; otherwise, we choose Has changed, where the condition can be anything.
Note that after choosing a condition, the red breakpoint icon will show a plus symbol, which indicates that it is conditional.
Visual Studio allows you to import/export breakpoints. If many developers are working on the same code, you can share the breakpoints that you have created in one project with others or save it. So, if you have breakpoints organized with labels, everything is exported to a file that can be used later, as shown:
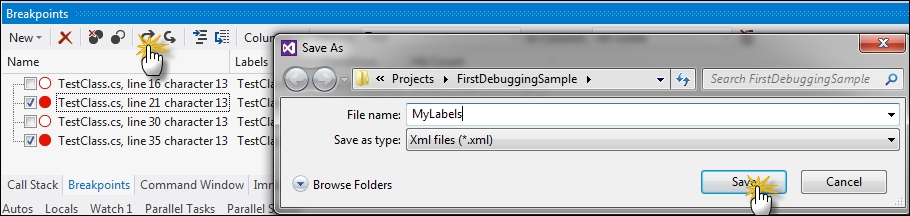
The file is actually an XML file, which produces XML content of all the breakpoints. A breakpoint, once exported, can be imported back again by choosing the Import Breakpoint button on the Breakpoint tool window.
A breakpoint hit counter is used to determine how many times a breakpoint has been hit on a particular line. Sometimes, it is needed to halt a program only when a certain number of breakpoints have already been hit. Consider a situation where you are iterating with a large number of loops. In these cases, we can configure the breakpoint to stop only when the number of hits it encounters reaches a threshold, as shown in the following screenshot:
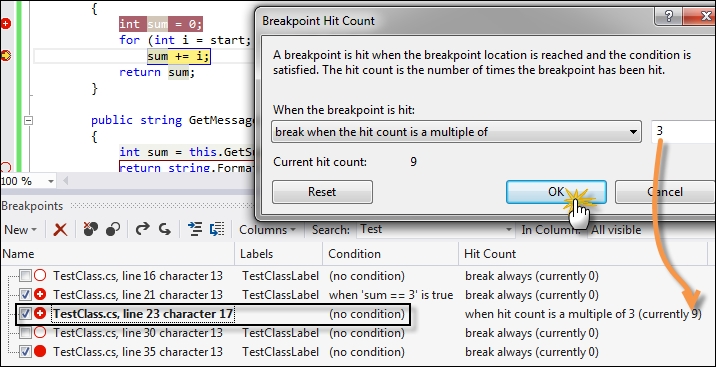
In the preceding screenshot, you can see the breakpoint hit count box, which is opened by right-clicking on the breakpoint and selecting Hit Count. The default setting is Break always but we can configure it to hit on a counter or a multiple of a counter, or even greater than equal to a counter.
As a default, when a breakpoint is hit, it will halt the execution of the program and pause it until we run the program again. But when the application is pretty large, you may want to continue the program and either run a macro when the breakpoint is hit or invoke a trace method. The breakpoint in such cases is called a tracepoint. To open the tracepoint window, right-click on a breakpoint and select When Hit.
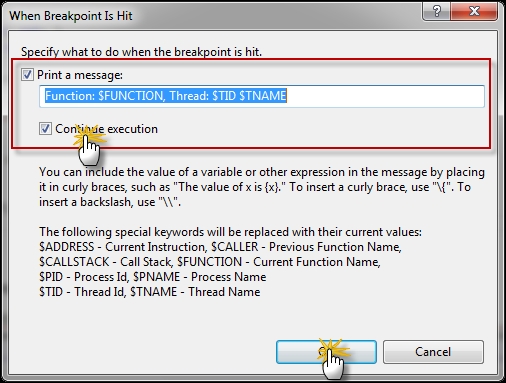
Notice that we print the function name, thread ID, and thread name when the breakpoint is hit. The tracepoints can print items on the output window based on the options listed on the window. Keywords such as $ADDRESS, $CALLER, and so on specified on the window provide macros that evaluate the specific context. After you place a tracepoint, the breakpoint identifier in the left-hand side of the screen will appear as a red diamond instead of a circle.
If you choose Continue execution, it means the macro that we selected will be executed without stopping the code execution.
Breakpoint filters allow you to specify any additional criteria of the breakpoint. With filters applied, you can specify the breakpoint to hit only for a specific machine, or a specific process or a thread. This is often required if you are executing your program several times with a different process ID each time and want to debug only on a certain process ID.
In the preceding screenshot, we filter the breakpoints based on the name of the computer and the process ID. The search box allows you to type in text and, based on the input, the window will filter all the breakpoints that match the labels of the searched string.
In this recipe, we will see how to work with DataTips during debugging. DataTips are individual data elements that can be seen on the editor when the program is debugged. They are advanced tooltip messages that can inspect objects and variables running in the current context.
Let's now see how to use DataTips with the following simple steps:
Place a breakpoint in the program and run it.
Hover over an object instance in the code or a variable to open a tooltip associated with the object.
A tooltip is a tree of members that can be expanded over the editor. You can toggle one object directly using the toggle button on the right-hand side of each object/value.
The pinned objects are placed on the screen and can be dragged inside the editor or you can even add comments on the toggled DataTips, as shown in the following screenshot:
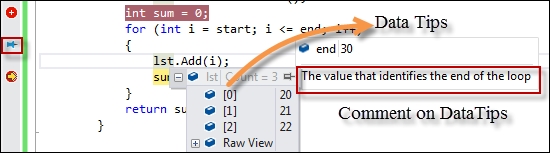
While debugging, the value changes to a contextual value while the last value is restored when the debug session is over. You can view the last value by hovering over the left-hand gutter, which leaves behind a blue-colored anchor pin.
DataTips actually use the data type information about an object to display each value. Each object has a type associated with it. The debugger analyzes the type information about the object and recursively loads all the object information in the form of a hierarchical structure in the same way as we programmatically do using reflection APIs.
The IDE stores the DataTip information in persistent storage but not the data that represents the state of a program.
Let's now explore some of the additional options that are available on DataTips for the IDE.
DataTips can be imported or exported just like breakpoints. From the main menu, go to Debug | Export DataTips. It will show you a dialog box to store the DataTips in a file as shown in the following screenshot. Once the DataTips are stored in the file, you can open it to see its content. It's a SOAP-based XML file with all the information that is required to reload the DataTips again to a certain point. For instance, your comments or watched items will be kept intact in an XML file using tags such as Comments or WatchItem#. You can add any item as watch using the right-click context menu. The following screenshot shows the XML output on the right-hand side:
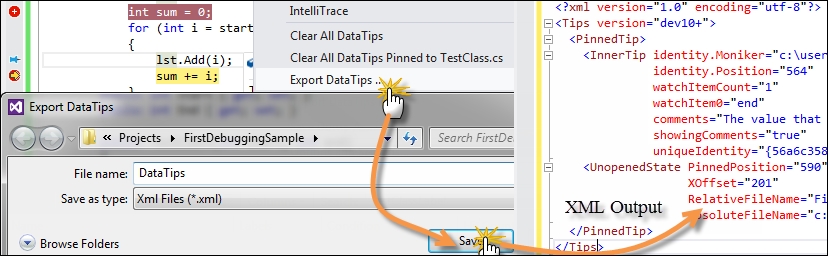
Once the file has been exported, Visual Studio can import the file in another Visual Studio IDE or in the same one and load the same environment of the DataTips when needed.
DataTips are really helpful for debugging and testing a large project.
DataTips can be cleared either by dismissing each individual DataTip or using the Debug menu. You have the following two options:
Clear All DataTips: This clears DataTips from all over the solution
Clear All DataTips pinned to [FileName]: This clears DataTips associated only to the current file
While debugging complex objects, the debugger is associated with a number of visualizers that help in displaying complex structures in better ways.
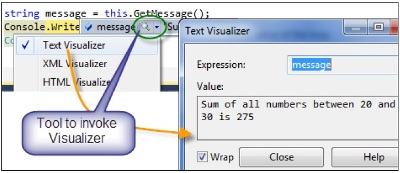
The visualizer creates a dialog box that appears on the Visual Studio IDE when an appropriate data type is loaded on the debugger. For instance, for a string instance, we generally have three visualizers associated. The Text Visualizer shows the string in the text format in a new window, as shown in the following screenshot. If the string content is XML, you can see the content in the associated XML visualizer and the HTML visualizer.
The debugger visualizer is associated with the data type of a class and is shown corresponding to either its loaded DataTips or in Watch windows. We can use a number of visualizers for a certain data type. We will see how to create a custom debugger visualizer later in this book.
Watch windows are places where you investigate objects just like DataTips. It is an alternative to DataTips. There are various types of Watch windows.
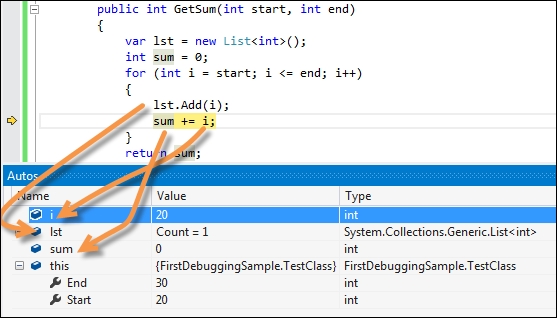
When the debugger hits a breakpoint, the Autos window shows all the objects and variables that are used in producing the current statement or items in context. Visual Studio automatically identifies the variables for you and shows them in this window. References are also listed inside Autos implicitly, as shown in the following screenshot:
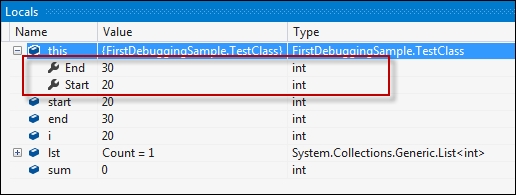
Locals are variables that are local to the current context and thread of execution. You can view and modify the value of a variable in the break mode using Locals, as shown in the following screenshot. The Locals window updates its value when the program is in the break mode.
Watch windows are customized windows that show objects and variables based on what users customize. While in the break mode, you can right-click on any variable and select Add to watch to add the selected object in the Watch window. You can also drag-and-drop expressions in the Watch window. Notably, there are actually four Watch windows available in Visual Studio to separate variables from one another, and to ensure that you can group similar objects in a Watch window when dealing with a large number of variables at the same time.
Generally, when you right-click and select Add to watch, an object will always be added to the Watch 1 window, but you can drag the expression from Watch 1 to any of the Watch windows.
In the following screenshot, you can see four Watch windows; each of them capable of showing variables in sync. The Watch windows show a grid with the Name, Value, and Type of each expression. You can directly type the value of a variable inside the Watch windows to change the value of the watched variable. Watch windows are also capable of showing calculated values.
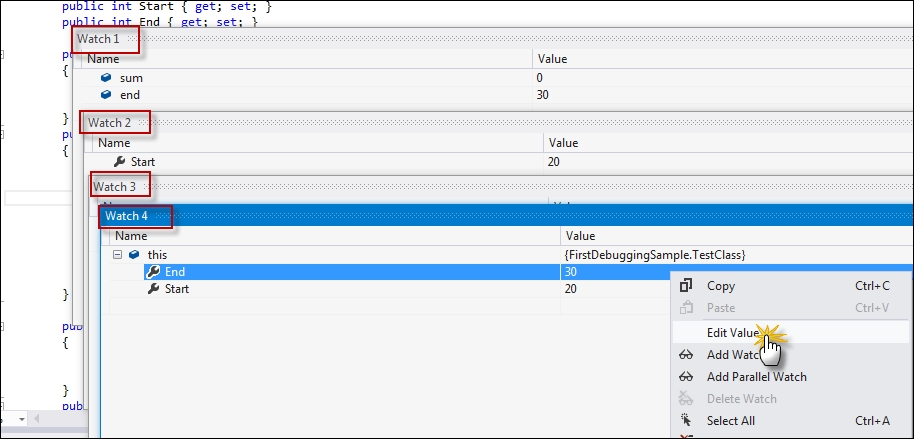
Like all other windows, Watch windows also show a tree when a complex object is loaded onto it. For instance, an object of a class in the preceding screenshot shows its properties inside a tree.
You can create an object ID of an object or variable from inside a Watch window as well. An object ID is an aliasing mechanism to edit the value of a variable using an identifier. Objects with object IDs can be accessed directly in all debugging tools (immediate window, command window, watch window, and so on). Right-click on any object in the Watch window and select Make Object ID, as shown in the following screenshot:
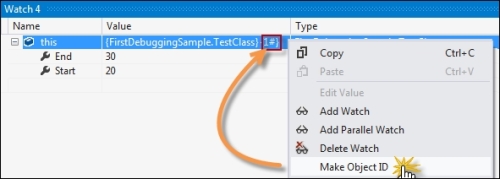
Once the object ID is created, Visual Studio puts a n# number corresponding to the variable that can be tracked easily by calling it later.
Another important tool window that is most often required by any debugging session is the Error List window. After you build your project, this window appears automatically to show any errors, warnings, or information that you need to know. You can move the cursor to the exact location with details when we double-click on any record from the error list. The error list displays a description of the message, the file where the error occurred, column number, line number, and the project name.
You can toggle errors, warnings, and even messages. It also provides you with a search box to search in case the error list is pretty long, as shown in the following screenshot:
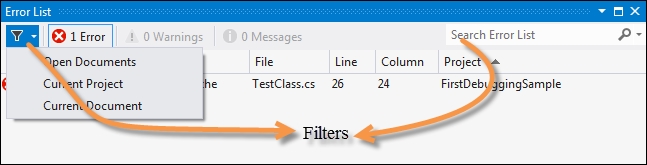
The Error List window also allows you to filter errors on Open Documents, Current Project, and even Current Document.
Multithreaded programming is one of the primary needs in modern day programming. In this recipe, let's take a look at how to debug a multithreaded program.
To test a multithreaded program, let's consider the following code:
static void Main()
{
  Thread.CurrentThread.Name = "Main Thread";
  Thread t1 = new Thread(new ThreadStart(Run));
  t1.Name = "Thread 1";
  Thread t2 = new Thread(new ThreadStart(Run));
  t2.Name = "Thread 2";
  t1.Start();
  t2.Start();
  Run();
}
static void Run()
{
  Console.WriteLine("hello {0}!", Thread.CurrentThread.Name);
  Thread.Sleep(1000);
}
Tip
Downloading the example code
You can download the example code files for all Packt books you have purchased from your account at http://www.packtpub.com. If you purchased this book elsewhere, you can visit http://www.packtpub.com/support and register to have the files e-mailed directly to you.
Here, we created two threads in parallel, each of them calling the Run method. We have given each thread a name to identify it in the editor.
Now, let's try debugging the concurrent program using Visual Studio with the following simple steps:
Place a breakpoint in the
Runmethod and run the program by pressing F5.The program will pause during the first
Runmethod.Open the Threads tool window by navigating to Debug | Windows | Threads or using Ctrl + Alt + H, as shown in the following screenshot:

You can see in the preceding screenshot that the threads are listed in the window with their respective thread names and other information.
A Threads window lists all the information about all the threads running in the current process. Other than a few default columns, you can add columns into the grid using Columns.
When we first run the program, the first call to the Run method is made. In the Threads window, it will show the current thread being executed using a yellow arrow sign. If you press F5 again, the previous thread goes into a sleep, wait, or join mode. This means that the thread execution is either finished or the thread is in the sleep mode.
In our case, since we did not invoke a join or wait statement, the thread must have been destroyed after the complete execution, but as the process is still running, the thread object will still show up in the window until it is disposed. Obviously, the thread running is a background thread (IsBackground = False).
Note that you can also expand the thread location for any thread to get the call stack that is currently being executed. The call stack will remain open automatically during debugging, and double-clicking on the Thread pane will change the context of the current stack.
Now let's discuss some of the other options that are available in the IDE that can help in our multithreaded programs. Let's explore them one by one.
When running the sample code, there are two types of threads that are created inside the process. We created three threads from the user code, but you can find a few other threads that run with the user threads as well, for example, the Finalizer thread, which is set at the highest priority, Jitter, and so on. These threads should always be set aside.
It is sometimes important to identify the threads created by the user.
In the previous screenshot, you can select Flag Just My Code to flag threads that are created by the user code.
Another important technique is to debug parallel programs. Parallel programs are concurrent programs that may or may not induce a thread inside it. So, you cannot always handle a parallel program simply by using threads. The Visual Studio IDE comes with a number of additional tools that help in debugging parallel programs.
Let's consider the following code:
class Program
{
  static void Main(string[] args)
  {
    Task task_a = Task.Factory. StartNew(() => DoSomeWork(10000));
    Task task_b = Task.Factory.StartNew(() => DoSomeWork(5000));
    Task task_c = Task.Factory.StartNew(() => DoSomeWork(1000));

    Task.WaitAll(task_a, task_b, task_c);
  }

  static void DoSomeWork(int time)
  {
    Task.Delay(time);
  }
}
This is similar to the previously used code but using parallel asynchrony.
Similar to the Thread window, the parallel execution programs have Parallel Stacks and Parallel Tasks windows. Open them by navigating to Debug | Windows. Place a break point on Task.Delay and run the program, as shown in the following screenshot:
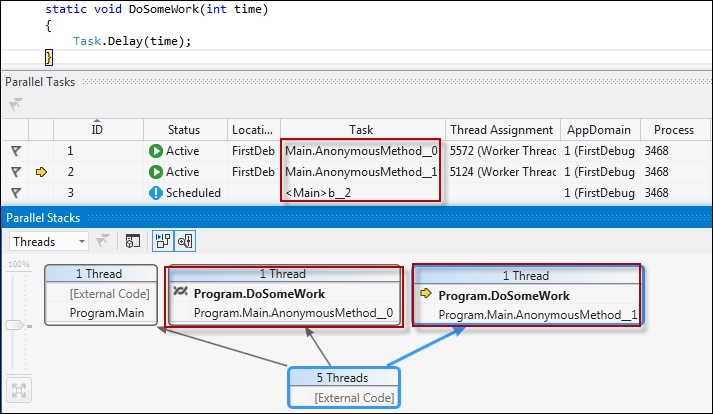
The Parallel Tasks window shows the different tasks that have been created for the program and the current status of each of the tasks. In the same way, Parallel Stacks shows the graphical view of all the task creations and how they are related to each other.
A debugger needs additional information about the project to work internally. The metadata information needs to be stored separately outside the actual executable such that the debugger can preload certain extent of the information prior to the execution of code; for instance, in Visual Studio, when you initiate a method or start debugging, the debugger automatically opens the appropriate files from the filesystem. This information is not available to the debugger inside the executable itself, but in a new type of file that coexists with the executable called program database files (PDB files). The basic schema of PDB files is:
Each PDB file is identified by a globally unique identifier (GUID). This GUID is stored in the header information of the file and it identifies the actual executable.
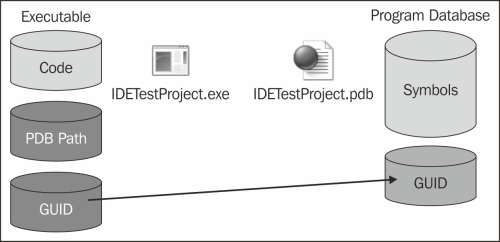
In the preceding figure, it is clear that the executable has the information about the source code file path and a GUID to uniquely identify itself. The PDB file holds this information as well. When the debugger loads the executable, it gets the PDB file path and loads the symbols from the file, if they are found. If the PDB files are not found, the debugger does not have any connection with the line the executable executes and the debug info on the same in the source file. Hence, the debugger cannot give you the flexibility of a line-by-line execution of a program.
The PDB files are generally much more important to the debugger than the source code itself. The PDB file loads the symbols into the vshost debugging environment and links the source code blocks with symbols. You can also maintain symbol servers to store the PDB files so that it is available to you while debugging.
You can learn more about parallel application debugging from http://bit.ly/debugparallel
The Command window in the Visual Studio IDE is a special window that is useful to invoke commands inside Visual Studio; either those that are available through menu commands or that are hidden inside the IDE. You can use the Command window to edit, test, build, and debug applications. Instead of using the mouse to search commands, seasoned users of Visual Studio can save a considerable amount of time by using the Command window.
Being the most important part of the debugging tool, let's inspect how to use the Command and Immediate windows in the following steps:
To display the Command window, select Other Windows in the View menu and select Command Window, or simply press Ctrl + Alt + A on the keyboard.
When you are in the Command window, you will see a > symbol placed before every input. This is called a prompt.
The Command and Immediate windows are very powerful. Almost every commonly used command that you can invoke from the IDE is available as a command from these windows. Let's start operating the Command window by using
Build.Compile.The very first thing that you will notice is the lntelliSense menu that pops up as you start typing. When you press enter to run the command, the project will be compiled. This is the same as pressing F6. Similarly, you can use
Debug.Startto start debugging the application.The Command and Immediate windows can help with things that are hard to find and not just the items that you can easily find inside the IDE. Type
Debug.ListMemorywhen you are in a breakpoint. You will see the list of memory used with the current line. You can explore the Build and Debug menus to find out more interesting commands such as these.Let's look at some of the shortcuts available for the Command or Immediate windows:
?: This gives you the value of a variable (you can also useDebug.Printto do the same)??: This sends the variable to the Watch windowLocals: This shows the Locals windowAutos: This shows the Autos windowGotoLn: This sets the cursor to a specific linebp: This places a breakpoint to the current line
Similar to the Command window, the Immediate window lets you test the code without having to run it. The Intermediate window is used to evaluate, execute statements, or print variable values.
To open the Immediate window, navigate to Debug | Windows and select Immediate.
Visual Studio is a huge environment with a lot of API support exposed from within it. Each of these sets of API commands are exposed through the Command window such that you can easily execute them by writing the command directly being within the IDE. Some of the commands that you can invoke through the Command window are still available to the IDE itself as visual tools, but there are a number of other commands that are not often used and are hidden from the normal users. They can be invoked only using commands. The Command window lets the user invoke commands on Visual Studio either in the debugging mode or in the normal mode. It would be good to specify some of the commands that are not available in the normal mode, for instance, Debug.BuildSolution or anything associated with the Debug interface. Some of the commands such as Build.AttachtoProcess or anything associated with the build interface are available only in the normal mode.
Immediate windows are generally used while debugging. It is the most popular tool to evaluate expressions at runtime, create variables on the fly, and/or print values.
Some of the commonly used commands in the Visual Studio IDE are associated with a command alias. For instance, if you use ?, it is equivalent to Debug.Print, the ?? command is equivalent to Debug.QuickWatch, addproj is equivalent to File.AddNewProject, tabify is used to invoke Edit.TabifySelection, and so on. You can use interfaces in the Command window, such as Debug, File, Edit, View, Tools, and Window, each of which provides a lot of the associated commands.
Now let's consider some of the other items that you need to know.
Even though both the Command and Immediate windows can be used interchangeably while debugging an application, there is one basic difference between the use cases of these windows.
The Command window is used to execute commands or aliases directly from being within the IDE. You can execute almost all the commands that are either available in menus of the IDE or hidden somewhere. The Command window can load dlls or packages into the IDE as well.
The Immediate window, on the other hand, is solely used during debugging and is useful to execute statements, print values of a contextual variable, or even evaluate expressions. Generally, the Immediate window is quite capable of executing large expressions while being in the debugging mode in the same way as it does inside Watch windows.
You can see http://bit.ly/commandalias to get a list of all the command aliases available
IntelliTrace is another great feature of the Visual Studio IDE. IntelliTrace debugging is sometimes called historical debugging. It operates in the background and records each and every thing you do during debugging. IntelliTrace traces all the information for all the events that occur during debugging and you can get information for all those tasks when required.
Let's demonstrate how to use IntelliTrace while debugging inside Visual Studio:
Once the debugger has started, open IntelliTrace in the Debug menu if you don't see it opened already.
After running a couple of steps in the code, you can see the debugger IntelliTrace logs in the IntelliTrace tool window.
Open each window to inspect each event status.

Each of the blocks contain Call Stack information and a Locals set, as shown in the preceding screenshot. The command opens its respective tool window with appropriate data. The editor also gets highlighted when a particular event is highlighted in IntelliTrace.
You can filter IntelliTrace logs by choosing the appropriate categories and threads.
IntelliTrace traces each of the events that go on with the program during debugging and produces trace files of the .itrace extension. Debugging more will increase the size of the file. The IntelliTrace files are by default stored in your hard drive. To see where these files are stored, navigate to Tools | Options | IntelliTrace | Advanced, or simply type IntelliTrace and navigate to IntelliTrace | Advanced, as shown in the following screenshot:
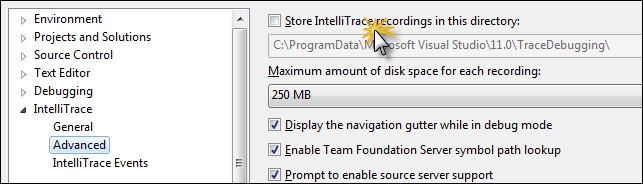
In this dialog box, you can configure how much IntelliTrace debug information needs to be stored. You can uncheck the option to stop storing the IntelliTrace debugger information.
You can go to the filesystem and select the Store IntelliTrace in this directory option to choose the TraceDebugging directory.
Now let's look into some of the other interesting features of IntelliTrace that we may have missed.
An IntelliTrace file can be saved directly to the hard drive (.itrace) by choosing the Save button from the tool window. When you choose the Save button, it prompts the location where you want to save the content. Once you save the content, you can double-click and reopen the content in Visual Studio to get the entire report of the debugging session.
In the report, it produces a neat graph of the complete execution of the application with all the modules that are loaded, the entire system info, exceptions occurred during execution (if any), test data (if any), and the threads. It also lists the web requests that are made from the application, as shown in the following screenshot:
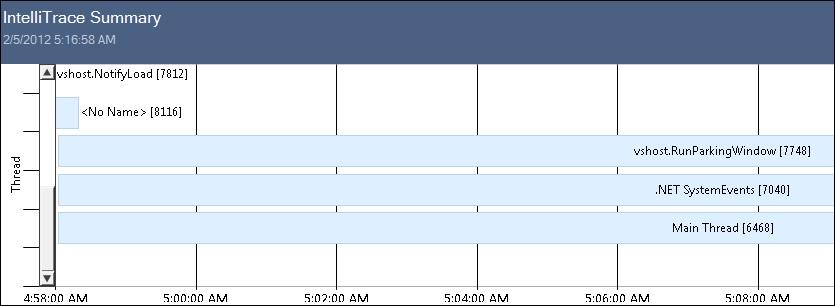
The IntelliTrace logs are so elaborate that the IDE can produce the same environment when you double-click on the any of the threads (or in particular, the main thread).
As we can see, IntelliTrace files are considerable in size; we can filter them to log trace information only to the modules specific to our requirement. Go to Tools | Options and then IntelliTrace | Modules, or directly type IntelliTrace in the IDE search box and type IntelliTrace to open the following screen:
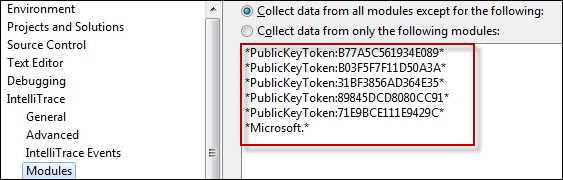
To capture data, you can choose either the modules you want except the listed modules or the reverse based on the radio button you choose. Generally, we bother only about our own code. Let's select the first radio button and then select the Add button. Specify the filename that you need to omit the IntelliTrace information from and select OK.
To test our application, we will create a new dll and write the name of the dll in the Add a Pattern dialog box. Now, when you debug the code, the detailed information for the calls to the dll will be missing.
Debugger Canvas is another interesting tool for advanced debugging. It is actually built on top of IntelliTrace and helps in getting all the information about debugging in one single instance.
To work with Debugger Canvas, you need to install it from the following location: http://bit.ly/debuggercanvas.
Once you install Debugger Canvas to the IDE, you can open a new canvas by navigating to Debug | Debugger Canvas | Create New Canvas. Now let's put a breakpoint in the code and run the program.
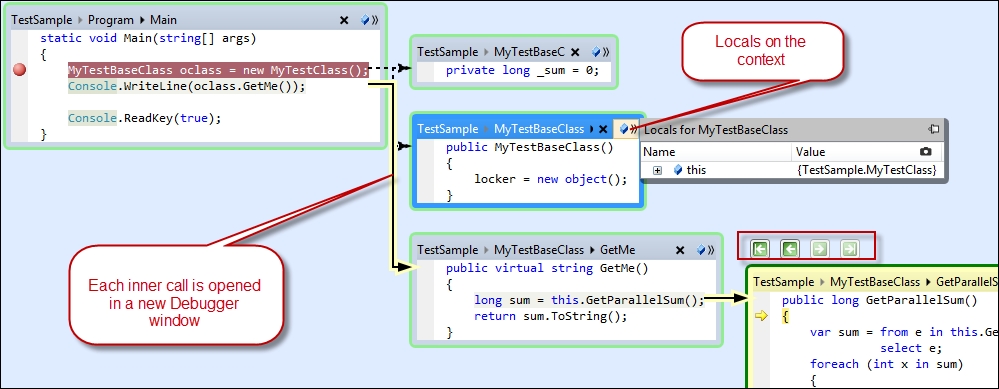
You can see that the code is now shown inside Debugger Canvas on the IDE. On choosing Step Into from the menu or pressing F11, it produces another box with the code where the cursor is moved to. There are navigation keys to move back and forth between these windows.
Debugger Canvas is helpful at times when you want to see the entire call stack of the code and easily move back from one call stack to another easily. Debugger Canvas also has an option in the right-hand side corner of each canvas element, which shows the locals of the current execution block as seen in the preceding screenshot.
The .NET library source code has already been released. This gives you a chance to locate and debug the actual source code that has been used to build the library that you are using. This is very useful as the code that has been downloaded from the server will contain a lot of comments, which will help you with the internals of the library that we are using.
Source code debugging is another technique for .NET library debugging. Let's take a look at how you can use Visual Studio to step into Microsoft Source for the .NET library:
To debug your code with the .NET library source code, you first need to go to Tools | Options and then navigate to Debugging | General.
Turn off Enable Just My Code.
Turn on Enable source server support, as shown in the following screenshot:

Now, in the Symbols tab of the window, you need to specify the cache server location where it can get the program debug information.
Set the symbol file location to
http://referencesource.microsoft.com/symbols.Set the cache location where the symbols will get downloaded as soon as you use it during debugging. You need to make sure that the location is accessible from your user account.
You can select a list of options for which the reference server will be connected to the symbols. For best results, we should select the modules that you need to load symbols to.
You can also load all the symbols once at this time and use them during debugging.
You can now start debugging.
Microsoft actually maintains a number of servers that hold static files. These files are available based on the checksum. Once the symbols are loaded onto your machine, the reference server can be used to download the appropriate source file directly while you are debugging your application and press Step Into to a method that is defined in the .NET class library. As we already know, a program database (PDB) file holds all the information about line numbers, location, and even the checksum of the file. Visual Studio invokes a request to a file by sending this information available in the symbol files and downloads the appropriate file.
Let's start our sample application and place a breakpoint in the first line of the code. Now run the project until the breakpoint is hit. Open Call Stack, right-click on MSCorlib, and select Load Symbols. This will download the symbols of MScorlib, which will take a considerable amount of time. Once the symbols are downloaded, you can start debugging your application.
You can see that when the download is complete, the Call Stack frames turn dark because all the line numbers are now available. Now you can press F11 to step into the library code, say, for instance, Console.WriteLine.
You will be prompted with a license agreement when you choose Call Stack for the first time. You can even use Call Stack to move back and forth to different call statements.
Tip
You cannot evaluate some of the variables and values while debugging as .NET bits that are shipped with the .NET framework are built in the optimized mode. Putting a break just above the line can show the content of the code.
Don't expect the source of all .NET dlls to be available. Most of the dlls are already made available and as time goes, it will increase the numbers. If you see that Load Symbols is disabled or the PDB isn't loading, then you should consider that the dll is not available.
It is sometimes necessary to debug a process that is already running. This is necessary when building a Windows service or an application that cannot have a user interface or an entry point assigned to it. The debugging process helps the IDE to debug a running process from inside the IDE if the appropriate debug symbols are there within the IDE.
To debug a running process, you need to first run the program. You can either run the program on the current machine by going to the bin folder of the project and double-clicking on the .exe file, or you can host it in another computer on the network.
Let's now take a look at debugging an already deployed process in the following simple steps:
To debug a process, you need to open the exact code that built the project to create the process.
Once you open the code, go to Debug | Attach to Process, where an IDE window will pop up, as shown in the following screenshot:
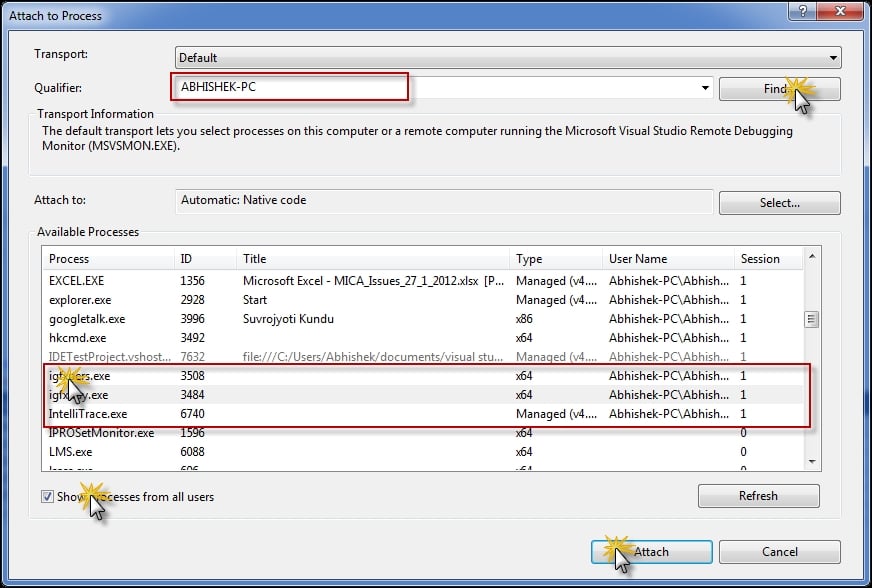
The Attach to Process dialog box allows you to either select a process from the list on your machine, or select a process running on the remote machine by either choosing the PC using the Browse button in the Qualifier or typing the IP address of the machine.
Once you select the machine, choose the process that you want to debug.
You can choose Show process from all users or Show process from all sessions to get a list of processes that are run by other users in other sessions too.
Once you find the process that you want to debug, select it and click on Attach.
If everything is fine, the process will get attached with the source code.
To clarify how the Attach to Process feature works, you need to first understand how the debugger works inside Visual Studio. Visual Studio Debugger is a module running inside Visual Studio, which can inspect each IL instruction that is being executed by the process and matches the source code in the project. This mapping is done using a special file that holds information of each and every instruction, the file info, its checksum, and so on, called the PDB file. When the process gets executed, the actual mapping instruction set is also read from the PDB file by the debugger, and when it finds any halt or break or even an exception in the process, it automatically pauses the process inside Visual Studio and opens the source code corresponding to the IL statement just encountered. Visual Studio Debugger is also capable of displaying the local information and other related debugging information in the exact source code line.
In the case of remote debugging, one must run the Remote Debugging Monitor called MSVSMon.exe on the same machine where the remote process is running. This file comes free with your Visual Studio installation and you can run it directly from the Visual Studio command prompt. The remote debugging needs an exception of MSVSMon against the firewall.
Note
To debug a process, it can be deployed in the debug mode; otherwise, the release mode process can also be attached with reduced debugging functionalities.
You must also run as an administrator or the same user who is running the process. Sometimes, it can ask for the user ID and password when logging in to a remote machine.
Working with a debugger for a running process is very interesting and useful. Let's look at some of the other interesting debugging techniques that you might apply to improve the debugging experiences of a program.
For users who want to debug by writing, the .NET class library opens up some interesting debugger APIs that you can invoke from your source code to call the debugger manually.
From the very beginning, there is a DEBUG preprocessor variable that determines whether the project is built in the debug mode.
You can write the following:
#IF DEBUG
/// The code runs only in debug mode
#ENDIF
The preprocessor directives are actually evaluated during compile time, which means the code inside #IF DEBUG will only be compiled in the assembly when the symbol is included.
There are other options such as Debug.Assert, Debug.Fail, Debug.Print, and so on. All of them only work in the debug mode. In the release mode, these APIs won't get compiled.
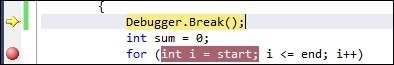
You can also call the debugger attached with the process, if any, using Debugger.Break(), which will break the debugger in the current line. You can check Debugger.IsAttached to find whether the debugger is attached to the current process, as shown in the following screenshot:
We can also load and attach a process directly to the debugger using code by referencing the EnvDTE packages. We will discuss them later in this book.
Note
When you start debugging your code, Visual Studio launches the actual process and one in .vshost in its filename. Visual Studio enhances the experience of debugging by enabling partial trust debugging and improved F5 experience using the vshost file. These files act specially in the background to attach the actual process with predefined AppDomain to experience flawless debugging. The .vshost files are solely used by the IDE and shouldn't be shipped in an actual project.
Visual Studio needs Terminal Services to run inside Visual Studio as it communicates with the process even when it is in the same machine using Terminal Services to maintain a seamless experience on both the normal and remote debugging of a process.