


In this chapter, we will start with a basic introduction to Visual Studio IDE, and understand how we can increase the productivity of our development using some of the tools and features present in the IDE. After going through the chapter, you will understand the following recipes:
Identifying the various components of Visual Studio IDE
Working with Solution Explorer and Class View
Working with the main workspace area of IDE
Navigating between code inside the IDE
Extending Visual Studio templates
Using Code Snippets in Visual Studio
Using Smart Tags and Refactor in Visual Studio
Ever since Microsoft announced .NET for the first time almost 10 years ago, there has been a lot of noise in the developer community about the way the changes are going. .NET led its way to modernize the ideas of coding with more sophisticated techniques by adopting more object-oriented paradigm in programming and also changing the style of coding altogether. The Microsoft forerunner VB was announced to be modernized in the new environment and redesigned to be named as VB.NET, and also some other languages that are totally different in syntax, such as C#, J#, and C++ have been announced. All of these languages are built on top of the .NET Runtime (known as Common Language Runtime or CLR) and produce the same intermediate output in Microsoft Intermediate Language (MSIL).
Microsoft announced .NET runtime as a separate entity by defining standardized rules and specifications that every language must follow to take advantage of CLR. The entirely new set of libraries, classes, syntaxes, or even the way of coding in Microsoft technologies, created a huge hindrance in the developer community. Many developers switched their jobs, while there are a few who really switched gears to understand how to work with the new technology that is totally different from its predecessors. The community has already started to realize that the existing set of Microsoft tools might not satisfy the needs of new evolving technology. Microsoft had to give a strong toolset to help the developers to work easier and better with the new technology.
Visual Studio is the answer to some of them. Microsoft Visual Studio is an Integrated Development Environment (IDE) to work with Microsoft languages. It is the premier tool that developers can posses to easily work with Microsoft technologies. But you should note, Visual Studio is not a new product from Microsoft. It has been around for quite sometime, but the new Visual Studio had been redesigned totally and released as Visual Studio 7.0 to support .NET languages.
As time progressed, Microsoft released newer versions of Visual Studio with additional benefits and enhancements. Visual Studio being a plugin host to host number of services as plugins, has evolved considerably with a lot of tools and extensions available; it has been the integral part of every developer's day-to-day activity. Visual Studio is not only a tool used by developers, but it has been identified that a large number of people who are not a part of the developer community have been loving this IDE and using it for editing/managing documents. The wide acceptance of Visual Studio to the community had made the product even better.
This year, Microsoft has released the latest version of Visual Studio. In this chapter, we will tour Visual Studio IDE features, its utilities, and mostly cover parts that can really help to make your work done more quickly.
Visual Studio 2012 has come up with lots of new enhancements and features. Some of these features widely enhance productivity of development. Knowing your IDE better is always an advantage to a developer. In this recipe, we will try to get our hands on to various Visual Studio IDE features to get started with using Visual Studio.
Before we start using Visual Studio, we need to first make a choice on which version practically suits us. Let's have a look at the features of all the versions of Visual Studio.
Visual Studio Express: If you are looking to try out small applications or medium-sized applications and do not want to spend a single penny from your pocket, Visual Studio Express is the right choice for you. Microsoft has given the Express build free to everyone that is capable of doing all the basic needs of software build up.
Visual Studio Professional: This edition of Visual studio is for individual development with most of the important debugging tools and all the things a developer commonly needs. So if your primary orientation of using the IDE is basic development, this would be the right choice for you. This edition is reasonable in price too.
Visual Studio Premium: Visual studio Premium edition is for people who make high-quality usage of the IDE. It adds tools for testing, code analysis, debugging, profiling, discovers common coding errors, generate test data, and so on.
Visual Studio Ultimate: This is the ultimate edition of the product with all the components that could exist within Visual Studio. This edition provides advanced debugging capabilities with all architecture and modeling tools with it.
You can find the entire comparison list between all the versions of Visual Studio from the link below:
http://www.microsoft.com/visualstudio/eng/products/compare
Once you are determined on what suits your requirement best, you can install it on your machine and we are ready to go.
In this recipe, we will understand the different sections of the Visual Studio 2012 IDE and will show you where to start.
To start with the recipe, let us navigate to the Start menu | All Programs, choose the
Visual Studio 2012folder and select Visual Studio 2012. This will launch the Visual Studio IDE.After displaying the initial splash screen for a while when the IDE has been loaded, it presents you with a Start page with a three main options:
Connect to Team foundation server
New Project
Open Project
We can use either New Project here from the link, or we can navigate to File | New Project to create a new project. This pops up a New Project dialog box. In this dialog box, we have a number of options available based on the packages that are currently installed with the IDE. On the left-hand side of the dialog box, we see a tree of various items installed within the IDE. You can see there are a number of templates listed in the tree. When one item on the left-hand side gets selected, the corresponding templates associated with that group will be listed in the middle section of the dialog box (marked as 2 in the next screenshot).
Select an appropriate name for your project in the Name: field (marked as 3 in the next screenshot).
You can select the Create directory for the solution checkbox (marked as 4 in the next screenshot) to indicate that a new folder with the name just specified will be created inside the location you specify, which will hold the various files rather than storing them directly inside the specified location.
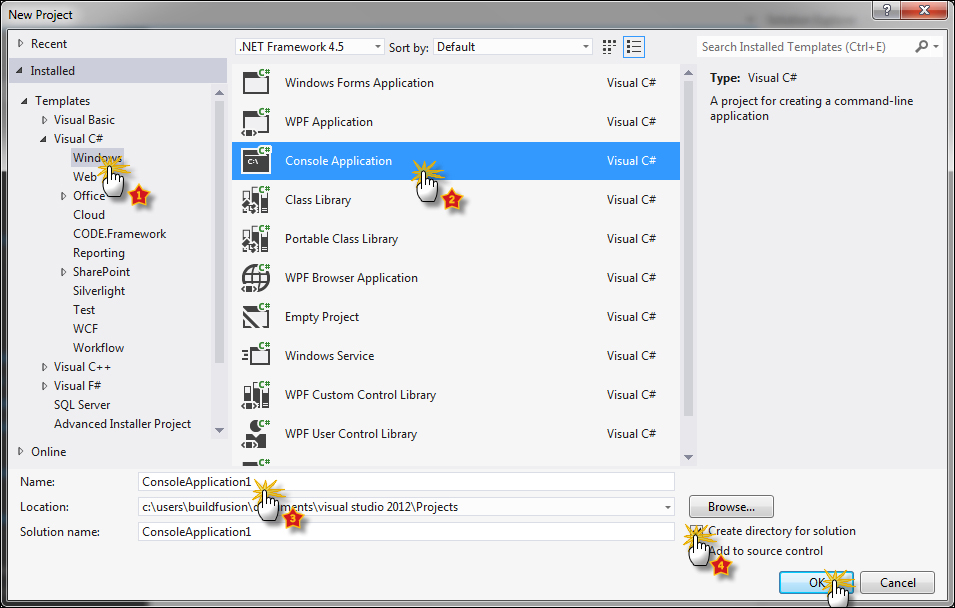
We choose Visual C# from the left-hand side pane, Console Application from the middle pane; keeping the default name we click on OK as shown in the previous screenshot. If everything is good, it opens the IDE and displays something as shown in the following screenshot:

In the previous screenshot, we have marked a few sections of the IDE which need special attention. They are as follows:
The first section is IDE Search, which is just a blank textbox to search the IDE component.
Tool Windows are docked on the left, right, or bottom of the screen. When a tool window is open as shown in TaskList Tool Window at the bottom, it shows up a small dockable container and when it is collapsed, it shows a reference of it in the IDE sidebar as shown in the left-hand and right-hand side of the window.
The main IDE workspace area represents the main working area of the IDE. This forms the major portion of the IDE and mainly the application developer writes code here.
A special Zoom Control is also there inside the IDE, which helps to zoom in and out of the editor.
Finally, you can start writing your code in the main working area of the IDE or start exploring other options in the IDE yourself.
There are a
few things that need attention when a Visual Studio IDE is opened. Visual Studio is a process that is launched using an executable called devenv (which can be spelled as Developer's Environment). You can either double-click on the Visual Studio icon from the Start menu (which most of the people do), or go to Start and then search for devenv to run the IDE. The IDE is generally invoked in default permission mode. Sometimes, it is important to open the IDE as Administrator to enjoy administrative features on the environment. To change this behavior, you can right-click on the shortcut and select Run as Administrator. You can also permanently set the IDE to run as administrator from the Properties menu.
After the Visual Studio initial splash screen is displayed during the opening sequence, the first thing that you see is the Start page. We have navigated to File | New Project to open the New Project dialog box. As shown in the first screenshot, on the left-hand side of the window (marked as 1), we see a tree of all the installed project type groups into collapsible panels.
If you do not find your template, you can also use Search Installed Template to search any template by its name in the right-hand corner of the dialog box.
As more than one framework can coexist in the same PC, the New Project dialog box is smart enough to allow you to choose the Framework that you need to use while deploying the application. By default it shows .NET 4.0 as the framework for the project, but you can change it by selecting the dropdown. The whole environment will change itself to give you only the options available for your current selection.
We choose Visual C# from the left tree and select Console Application from the middle pane as project template. Upon choosing any template, the description of the current template is loaded on the right-hand side of the screen. It gives you a brief idea on what Console Application is and is capable of doing.
At the bottom, we have the option to name the project and the solution, and we also have option to select the location where the project needs to be created (marked as 3). You can select your own folder path to store the files you create inside the project by choosing the appropriate filesystem path in the box.
There are two checkboxes available as well. One of them is Create directory for solution, when selected (which is by default remains selected) creates a directory below the chosen path and places the files inside it. Otherwise it will create files just inside the folder chosen. To make it a habit, it is good to keep it selected.
Finally, click on OK to create the project with default files.
After the project is created, the basic IDE you see looks like the screenshot in step 5. We will now divide the whole IDE into those parts and explore the IDE together in the recipes that follow.
Let's paste the code inside the Main method that you see when you open the program class and paste the following code between the curly braces of Main method:
string content = "This is the test string to demonstrate Visual Studio IDE features. ";
string content2 = "This is another string content";
Debug.Assert(content.Equals(content2), "The contents of the two strings are not same");
Console.WriteLine("Thanks!");
Console.ReadKey(true);
Tip
Downloading the example code
You can download the example code files for all Packt books you have purchased from your account at http://www.packtpub.com. If you purchased this book elsewhere, you can visit http://www.packtpub.com/support and register to have the files e-mailed directly to you.
After you paste the code, let's press F5 on the keyboard. You will see a Console window that appears inside the IDE showing a message. Press the Enter key to close the Console.
There are lots of other options that Visual Studio comes up with. In spite of opening Visual Studio normally, you can also use some special options to handle Visual Studio better. Let's try to look into other options that can be good to eye on.
Visual Studio being a normal executable that runs under Windows also provides some switches that can be used when we open the IDE. To use Visual Studio with these switches, we need to either use command prompt or use Run to add switches to the IDE. To use command prompt, just navigate to the location %systemdrive%\Program Files\Microsoft Visual Studio 11\VC and type in devenv /? to get a list of all the command switches available for the IDE. For instance devenv /resetsettings.
This command switch will reset all the user settings that have been applied to the IDE. The reset settings can also be used to specify the vssettings file, which has been used up to override settings for the current IDE. Similarly, you can use devenv /resetSkipPkgs.
This command will reset loading of all user-related tags associated to the packages that need to load to make everything work smoothly with Visual Studio. Sometimes if the IDE gets corrupted or loading time increases, you can also turn on diagnostic load using devenv /SafeMode.
You can also try running a project without opening the IDE totally. I mean if you only need to open the IDE, run the project, and exit. The best option is to use Command switch devenv /runexit "[solution/Project Path]".
You need to replace the [solution/Project path] with the path where you find the Solution file (.sln extension) or project files (.csproj/.vbproj files).
To see all the command switches supported by the executable, you can try devenv /? from the command prompt too.
The most important part of the IDE that you need most often is your Solution Explorer. Solution Explorer, which resides on the right-hand side of the IDE, is the most widely used navigation tool between files and classes. It is shown in the following screenshot:
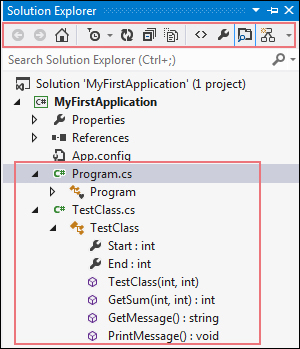
In the above screenshot, you see the basic structure of Solution Explorer when the IDE is loaded with a project. The Solution Explorer window starts with the Solution file and loads all the projects that are associated with the solution in a tree. The very next node of the Solution file generally is the project file. For the sake of identifying each of the files in the IDE, it provides you the proper icon and also makes the project file names bold.
In this recipe, we are going to explore Solution Explorer.
On the right-hand side of the IDE, you will see Solution Explorer as shown in the preceding screenshot. This is the main screen area where you can interact with the files and folders associated with your project. If you do not see Solution Explorer, please navigate to View | Solution Explorer from the menu or press Ctrl + W, S from the keyboard.
Once you see the Solution Explorer, it should contain a tree of all the files and folders that are associated with the project. Toggle each node in the tree to see its related information. You can see in the figure, the Solution Explorer is capable of showing the list of members of a type that is written inside a file as well. The node TestClass, when opened, shows a tree of all its members in subsequent nodes.
The header section of Solution Explorer contains a number of buttons. These buttons are commands associated with the current selection of the tree node.
Solution Explorer
is the main window that lists the entire solution that is loaded to the IDE. It gives you an organized view of projects and files that are associated with the solution for easy navigation in a form of a tree. The outermost node of the Solution Explorer is the Solution itself, and below it are the projects, then files/folders. The Solution file also supports you to load folders directly inside the solution and even store documents in the first level. The project that is set as startup is marked in bold.
There are a number of buttons stacked at the top of the Solution Explorer window called toolbar buttons, and based on the type of file that is selected in the tree will be made available or disabled. Let's talk about each of them individually:
The solution tree in Visual Studio 2012 also loads the entire structure of the class into its nodes. Just expand the .cs file and you will see all its members and classes are listed. Visual Studio also has a class view window, but Solution Explorer is smart enough to list all the Class View elements inside its own hierarchy. You can open Class View by navigating to View | ClassView or pressing Ctrl + W, C, to see only the portion of class and its members.
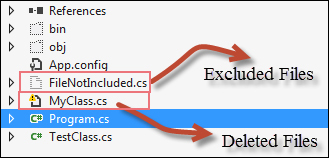
Another important consideration is Solution Explorer as it shows the files from the Solution file, it also tracks the actual existence of the file in the physical locations too. While loading the files sometimes, it might show exclamatory signs if the file doesn't exists in physical location.
Here the MyClass file, even though it is a .cs file, does not show up the usual icon, but shows one exclamatory sign which indicates that the file is added to the solution, but the physical file does not exists.
On the contrary, some files are shown in the solution as blank files, (in our case FileNotIncluded.cs or folders like bin/obj). These files, even though they exist in the filesystem, are not included in the solution file.
Each of the files show one Additional Information button on the right-hand side of the tree node in the solution. This button gives extra information associated with the file. For instance, if you click on the button corresponding to a .cs file it will pop up a menu with Contains. This will get the associated class view for the particular file in the solution. The menu can be pretty long depending on the items that cannot be shown in generalized toolbar buttons. When the solution loads additional information, there are forward/back buttons which can be used to navigate between views in the solution.
In addition to the basic updates to Solution Explorer, there are lots of other enhancements that are made to the Solution Explorer to increase productivity and better user experience to the IDE. Let's explore them one by one.
Solution Explorer shows a preview of images just by hovering on the image without actually opening the image. This is a new enhancement to Solution Explorer and is not available with any previous version of Visual Studio IDE.
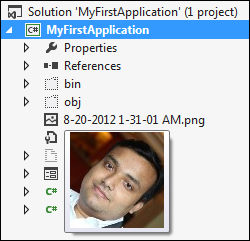
Add an image in the solution by right-clicking on the project and navigating to Add | Add Existing Item and select an image from the filesystem.
If you did it correctly, the image will be loaded in the tree as in the screenshot. Just hover the mouse pointer over the image, and you will see a small preview of the image as shown in the previous screenshot.
Visual Studio comes with a number of editors installed within it by default. Based on the type of the file, this editor gets loaded onto the IDE. For instance, if you double-click on an image it will open it in image editor, while when you choose a .cs file, it will open it in a C# editor.
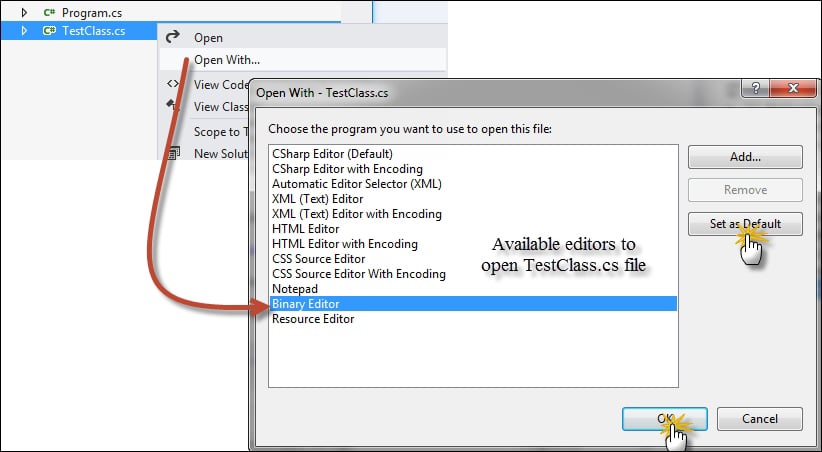
You can right-click on any file from the Solution and select Open With... rather than using the normal double-click to open a dialog box, which lists all the available editors that can load the selected file. Some of the default IDE editors are C# Editor, C# Editor with Encoding, Automatic Editor Selector, XML Editor, HTML Editor, Notepad, Binary Editor, Resource Editor, and so on.
To open a CS file in Binary Editor, right-click on the CS file and choose Open With… choose Binary Editor and select OK. You can see from the following screenshot that the code file looks like a sequence of binary characters:
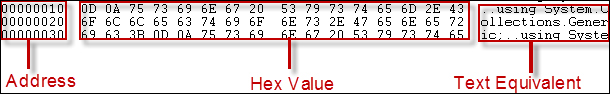
The first column shows the address of the bytes in the file, the second shows the actual byte content, and the third contains the string equivalent of the same.
You can also try out other editors in the list.
This section represents the main workspace area of the screen. This is the most important section of the Visual Studio IDE which the developers mostly use. The workspace generally fills up the entire IDE or most of the portion of the IDE. Each of the windows that can be loaded inside the IDE has the feature to toggle hidden, can float outside the IDE, and even be snapped into different dock positions.
In the main workspace area, a file has already been loaded for us with a class named class1. The editor associated with .cs file is loaded in the screen to show the file. There are a number of editors available with Visual Studio, each of them can be loaded directly in this section. Generally, we do our main development in this section of the IDE.
We will work the main workspace area of IDE by performing the following steps:
Close all associated windows in the IDE that you can see the portion of the IDE that still remain on the screen is the main workspace area.
Open Solution Explorer, double-click on some files. You can see each file produces a stack of tabs. Upon opening a new file, you can see the new tabs are stacked on the left-hand side of the tabs. Opening a large number of files in the IDE will produce a menu on the top-right corner of the screen.
Drag a tab and place it in between other tabs to reposition.
Change something in the file without saving the content. The tab header will indicate the update with a star sign. It will show a lock sign when you open a read-only file.
Use the Toggle button on one of the tabs to make it sticky, so that opening new files does not changes its position. If you are in the Preview tab, you will see a special Promote button, which will promote it as a new window to work on. The workspace contains the editor which forms the most of the part of IDE. This section loads the content of the actual file. The changes in the editor are tracked in yellow (when the change is not saved) and green (when the content is saved).
You can zoom the content of the editor using the Zoom dropdown in the bottom-left corner of the screen.
The workspace loads the editors in tabs. So, when you pick two nodes from Solution Explorer to open the code window, Visual Studio keeps links to each of the files that are opened in separate tabs. Each tab header contains a few fixed set of items.
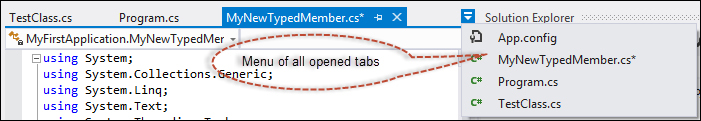
In the previous screenshot, you can see that the tab header containing the name of the file (MyNewTypedMember.cs) that links to the tab, it shows a * when the item needs to be saved, it has a toggle pinner button (just like all other IDE tool windows), which makes the tab sticky on the left-hand side, and the close button. The title section sometimes also indicates an additional status, like when the file is locked it shows a lock icon, when the object is loaded from metadata it shows that in square braces as in the screenshot. In this section, as we keep on opening files it goes in to a stack of tab pages-one after another until it reaches the end. After the whole area is occupied, it finally creates a menu in the right most corner of the workspace title to hold a list of all the files that cannot be shown on the screen. You can select from this menu to choose which file you need to open. Ctrl + Tab can also be used to toggle between the tabs that are already loaded in the workspace.
Below the title of the tab, before the main workable area, there are two dropdowns. One has been loaded with the class that is opened in the IDE and the right one loads all the members that are created in the file. These dropdowns help easier navigation in the file by listing all the classes that are loaded in the current file on the left. On the right-hand side there is another which contextually lists all the members that are there in the class that is chosen on the right-hand side. These two dropdowns are smart enough to update automatically whenever any new code is added to the editor.
The main workspace area is bounded by two scroll bars that handle the overflow of the document. But after the vertical scroll bar, there is a special button to split the window.
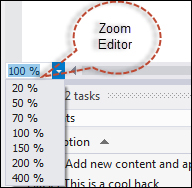
The horizontal scroll bar on the other hand holds another dropdown that shows the current zoom of the editor. Visual Studio now allows you to scale your editor to your preferred zoom level. The shortcut for the zoom is Ctrl + the scroll mouse wheel.
As our basic overview of the Visual Studio 2012 IDE is over, let us have an insight on a few other features that are available inside the IDE.
Let's go on opening a few of the windows in the IDE. You can start from View | Windows Menu of the IDE. After you have opened up quite a number of tool windows, you will find a requirement for easy arrangement of the windows. Visual Studio IDE is composed of a number of dock holders, each of which can freely flow both inside or outside of the main IDE. You can move a window by dragging its title bar as you do for any normal window. When you move the panel just inside Visual Studio, a set of controls appear as shown in the following screenshot, which indicates the dock positions available for the current window:
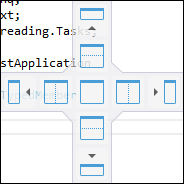
When you hold against the dock position, it will show you how it appears when stacked in a certain position (shown in the previous screenshot). Visual Studio will automatically adjust the stacks of items that are stacked through the Dock Managers.
The whole IDE has a stack of tabs on each side of its workspace, which holds tabs to link each of these windows. As I have already mentioned, each of the tabbed window is capable of toggling to auto hide. When the window is hidden it shows only the tab link, while when the window is open, it associates itself into a set of tabs.
The other parts of the IDE consists of the menu bar, the standard toolbar, and the status bar. Each of them is used to give commands to the IDE.
On the top-right corner of the screen, you will find a new search box. This is called the IDE search box. Visual Studio IDE is vast. There are thousands of options available inside IDE, which you can configure. Sometimes, it is hard to find a specific option that you want. The IDE search feature helps you find an option more easily.
As shown in the previous recipe, say if I forget where the option for Preview File tab on single click is available, I can type Preview in the search box.
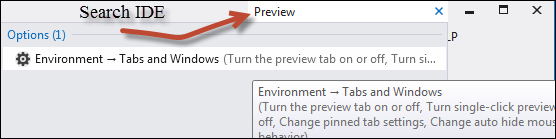
As shown in the screenshot, Visual Studio will open a list of all the options where you can see the Preview text available. On choosing the first option, you will navigate to the appropriate location.
Visual Studio IDE has a feature to preview files without opening the same in the IDE. Just with a single click on the file, it will open up in the main workspace area as preview. As we have already seen, the preview of the file is generally opened on the right-hand side of the IDE, and selecting another file replaces the previous preview, it is called as a temporary preview of file. The file can be promoted or opened either by working directly inside the preview, or by using a special promote button on the title of the preview tab.
Generally this option is disabled by default. You can navigate to Tools | Options, then in the left tree, Environment | Tabs and Windows, check the Allow new files to be opened in preview Tab.
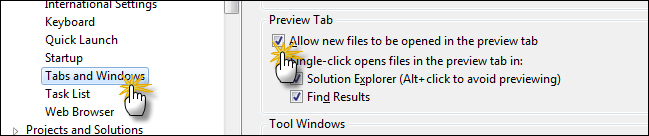
The Preview Tab option is generally useful when you are working with a large number of files and loaded in the IDE.
Visual Studio comes with a number of useful code navigators; most of them are pretty useful and handy. First of all let us try the Code Highlighting feature in Visual Studio.
To try the Code Highlighting feature in Visual Studio, perform the following:
Double-click on a C# file to highlight each occurrence of the same type in the code.
Press Ctrl + Shift + down/up arrow to navigate between references.
Press Ctrl + ,(comma) to open the Navigate to dialog box to list all the navigation options available for the current selection (or under cursor position).
Right-click on any method or type and select Go To Definition to move to the definition of it.
Right-click on any of the type and select Find All References to list all the references in a new tool window.
You can select View Call Hierarchy from the right-click pop-up menu to list all the references to and from the member you have selected.
You can rename a type in the IDE and press Ctrl + .(dot) to open a menu and rename all its references.
Navigating from one file to another and one type to another is an important thing while working with any project. Visual Studio IDE did a splendid job by giving us tools and features that help in navigating from one place to another easily.
Select any text in the project document by double-clicking on it, which highlights all the occurrences of the same code in the file. You can press Ctrl + Shift + down/up arrows to navigate between the references:
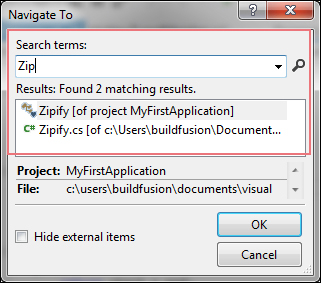
For advanced code navigation, you can press Ctrl + , to open a new window named Navigate To that quickly searches code members and files and list them.
The Navigate To dialog box also shows the file from which the window is invoked and the name of the project.
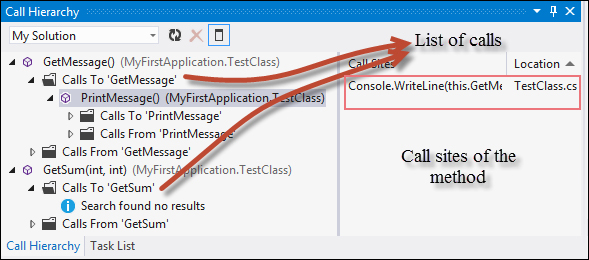
Another important code navigation tool is the Call Hierarchy window. You can invoke this window using right-click and selecting View Call Hierarchy. The Call Hierarchy window gives you the overview of all the references that are using the same code. You can also view the overrides of the method if you have any. The right-hand side of the window also lists all the calls by giving the exact line and the filename where the call has been made.
In addition to the basic navigation tools inside the IDE, there are a few advanced options available to the IDE that help in navigating within the UI quickly, logically, and efficiently. Let's now take a look at a few other options available to us.
One of the coolest additions to Visual Studio recently is Architecture Explorer. The tool helps you to navigate between the solutions assets very easily. Let's navigate to View | Architecture Explorer to get a window similar to the following screenshot:
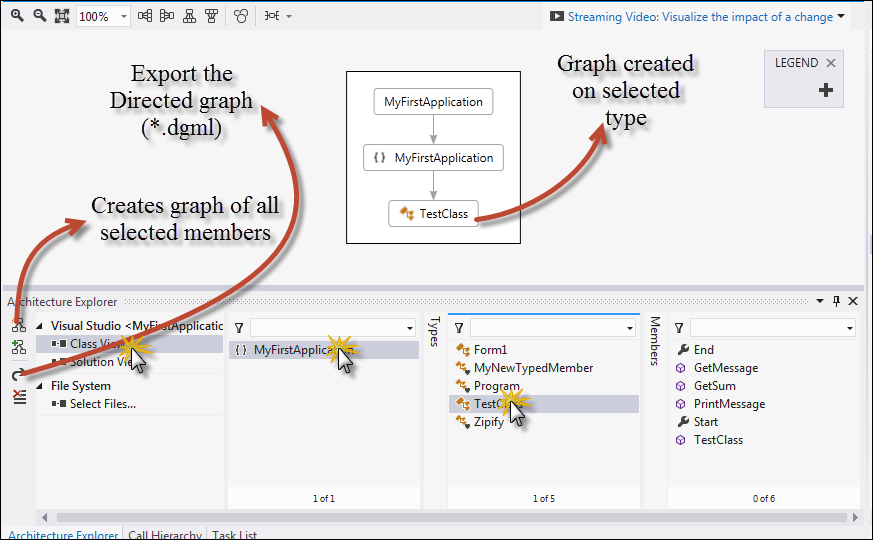
In the Architecture Explorer window you can view, navigate to the content of any class, namespace, or method. Visual Studio also has the facility to export the Architecture Explorer window in a graph document. You can select the items that you need to show in the graph and select the Create New Graph Document button on the top-left corner of the Architecture Explorer window. The graph will show up to analyze code members, circular references, unreferenced nodes, and so on and create a pictorial representation of the entire library. You can even export the document as a directed graph using the Export Directed graph button on the explorer.
The graph in the Architecture Explorer window can be exported to XPS document for future reference too.
You can generate sequence diagrams from Visual Studio IDE by directly right-clicking on a method and by selecting the Generate Sequence Diagram option. This option is only available in the Ultimate version of Visual Studio. Sequence diagram will show a diagrammatic representation of the complete method body using a diagram.
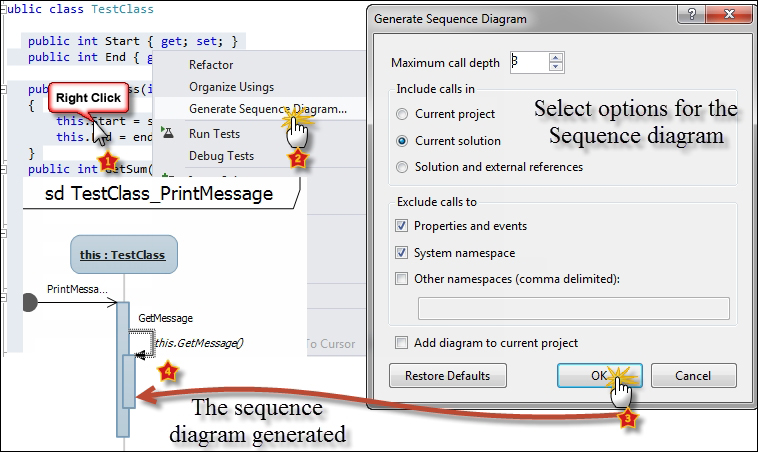
You can see in this method that I have used a few classes and objects, which are shown in the diagram based on their usage.
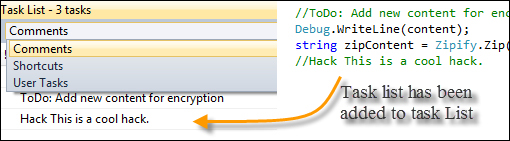
Visual Studio can be used to list task information on the project. You can open Task List from the View menu, which lists all the tasks that are outstanding in the project.
There are a number of options that you can use to create tasks in the project.
When you comment something in the code with Task List tokens, your task will get listed in the Comments section. For example:
// ToDo This is a task that is outstanding or // Hack This hack need to be changed
The ToDo task will be listed on the Tasklist Tool window.
You can also create tasks directly inside the task window. Choose User Tasks and click on the button just beside the combo. You can also specify the priority of a task.
The commented tasks can be double-clicked to navigate to the appropriate line where the comment is written.
Another important window to manage code is Bookmarks. You can also use Bookmarks to navigate between code. To add a bookmark, go to the line where you want to apply a bookmark to, and select the Toggle Bookmark option in Edit | Bookmarks ,or press Ctrl + B, T. A white box will appear against the line. Once the bookmark is set, you can move to next and previous bookmarks using Ctrl + B, N and Ctrl + B, P respectively. You can clear all breakpoints either from the menu or simply choosing Ctrl + B, C from the keyboard. You can also open the Bookmark tool window to navigate between bookmarks more easily.

The Bookmark tool window can be opened using Ctrl + W, B or by navigating to View | Other Window | Bookmarks. You can manipulate bookmarks from this window.
This is a read-only editor present inside the IDE which displays the definition of types and methods while the user navigates on the code in the editor. As you move the cursor over the IDE or change the selection on Class View, Object Browser, or Call Browser, the content of the Code Definition window automatically gets updated with either the actual code from within the application, or it displays metadata content of a selected type.
To open the Code Definition window, navigate to View | Code Definition window.
The Code Definition window not only displays the definition of the code in the navigation, but it also allows you to copy code, use Edit Definition to edit the definition, put breakpoints, and so on. The Code Definition window is very useful in certain cases while working with large applications.
Visual Studio supports extensibility. A large number of Visual Studio IDE components are now extensible. Extension Manager is a special section which allows you to view, control, or uninstall any extension associated with Visual Studio.
Navigate to Tools | Extension Manager to open the window. If you choose Online Extension from the left-hand side, it will connect to the online extension gallery. You can select an extension from the list and download the extension and install.
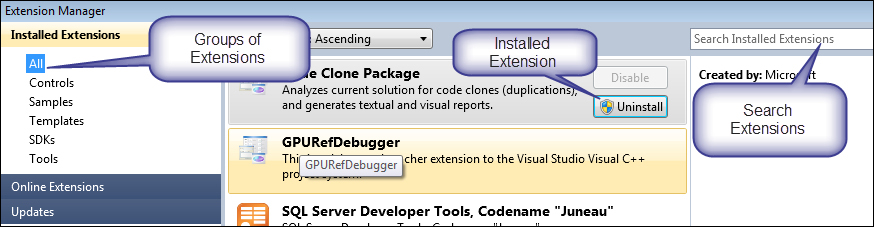
Once the extension is installed, it will show you the option to either disable or uninstall the extension.
The Microsoft Build Engine is a platform to simplify the build process when there are a large number of files that need to be compiled together. Visual Studio build process uses the MSBuild environment to provide transparent build experience on all the files and folder structures together in one library. The entire build process needs a project file, which is an XML-based file that provides the basic structure of the library.
Visual studio has a project file to maintain all the items that are included in the project and this file is later passed on to the MSBuild interface to invoke build process. In case of advanced scenarios when you don't have Visual Studio available, but you need to build a hierarchy of project structure, MSBuild can be invoked manually too by writing the project file manually.
Let us examine each section of a project file.
Item: It represents the items that comprise the build process. They are grouped together into user-defined collection.
<ItemGroup> <Compile Include = "Program.cs" /> <Compile Include = "TestClass.cs" /> </ItemGroup>Properties: It presents the key/value pair of all the properties that configure builds.
<PropertyGroup> <BuildDir>Build</Build> </PropertyGroup>Task: They are tasks that needs to be performed while the build process is on.
<Target Name"MakeBuildDirectory">
  <MakeDir Directories="$(BuildDir)"/>
</Target>
Targets: They form the entry point of the build process. Targets are grouped into individual build process.
<Target Name="Compile">
   <Csc Sources="@(Compile)" />
</Target>
These sections provide valuable information about how the project needs to be built. After successfully creating the project file, you can use it to create the actual executable:
MSBuild.exe TestApplication.proj /property:Configurtion=Release
Thus, the project will be built in the release mode.
After the application has been created successfully, the next step is to run the application from inside the IDE and debug it. Debugging an application inside Visual Studio IDE is fun. You can execute the application step-by-step to clearly understand the code that is running and also identify any problem(s) that the code might have while executing.
To debug the application, either you click on Start from the toolbar, or select Debug | Start Debugging from the menu. The shortcut for start debugging the current application is F5.
When the application runs inside the IDE, every step the application performs is monitored by the IDE, and any changes made to the application directly pass through the IDE execution host engine. Breakpoints are special indicators inside the code which allows the IDE to halt the execution of the program at a certain point. When the application breaks at a breakpoint, the program stops its execution and everything in the state gets evaluated in the environment.
To go over the program line by line, we can either choose Debug | Step over or press F10 in the IDE, or to step into the definition of the code, we can navigate to Debug | Step into or press F11 from the IDE. Visual Studio provides a new environment for the IDE to execute the program while debugging. The environment also supports a large number of tools that help in clearly identifying what is going on at a particular point for the application.
You can try the productivity power tools for Visual Studio 2012 for other extensions to the IDE available at http://bit.ly/ProductivityPowerTools.
Visual Studio files are created using templates. There are a large number of templates associated with Visual Studio that are stored with your IDE, which are automatically copied when you create files and projects in the application. These files are called templates in Visual Studio.
We can use Visual Studio to produce custom templates that can automate these things for us, by using the pre-defined structure for the project file type such that whenever you start a new project or add a new item to your project, most of these items are generated for you.
In this recipe, we will cover how to use all the predefined templates that are preinstalled with in the Visual Studio IDE and also talk on how to create a template of your own.
There are two types of templates:
Project Templates: These files are related to projects and are used when a new project is created or added to a solution. The templates that we create in the project are listed inside the New Project dialog box of Visual Studio.
Item Template: These are item files that are listed in New Item dialog box of the project. So when we add a new item to the project, the item templates that are listed in the dialog box are deployed as Item Templates.
The default location of project and item template folders is listed in the Options dialog box of Visual Studio as shown in the following screenshot:
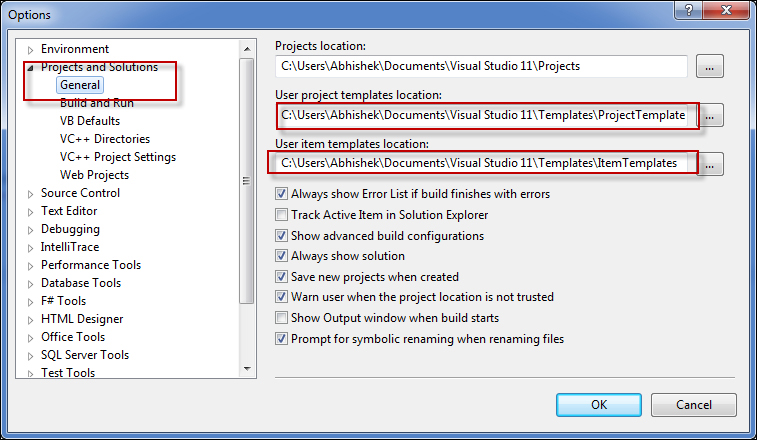
In the previous screenshot, you can see that the Project and Item templates are located to a specified unc path. They are basically a zipped content archive that we can place in the same location to ensure that it is listed on the project and item dialogs.
The basic Project Templates and Item Templates are located inside the Program Files\[Microsoft Visual Studio Installation Directory]\Common7\IDE\Project Templates and Program Files\[Microsoft Visual Studio Installation Directory]\Common7\IDE\ItemTemplates folders respectively.
Let us create a new project and item templates in this recipe and look into their details.
Create a custom project by writing the code that is actually needed whenever someone uses the template.
Include references of assemblies that need to be referenced on the final project.
Select File | Export Template. A new wizard will open up where you can choose either Project Template or Item Template. Let us choose Project Template so that the entire project gets exported.
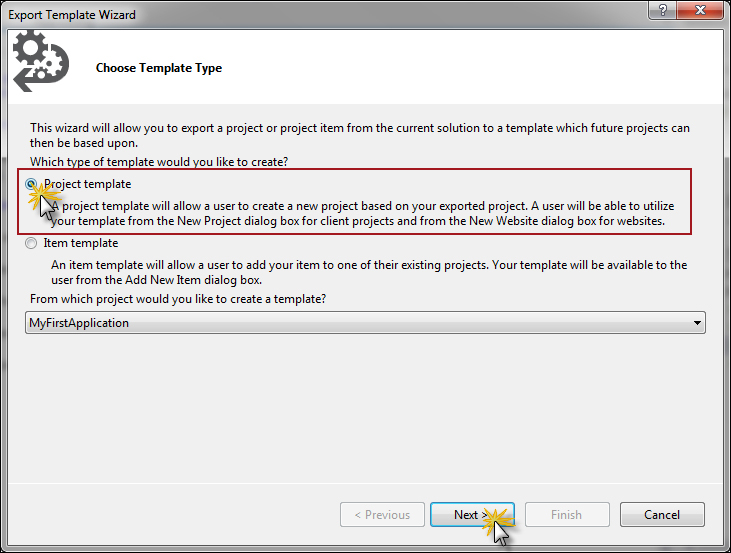
If you have multiple projects in the same solution, you can use either of them from the dropdown at the bottom of the screen.
In the next screen, we need to specify the name of the template which it needs to show in the New Project dialog box and description of the template. This information will be shown inside the New Project Template dialog box either in tooltip or in the separate description pane.
The Template Options window also gives you options to choose the icon file that is to be used and a preview image for the template icon. In our case, we leave it blank.
Notice, the output location is shown in a textbox below these options and it shows that a ZIP file will be created in the location specified:
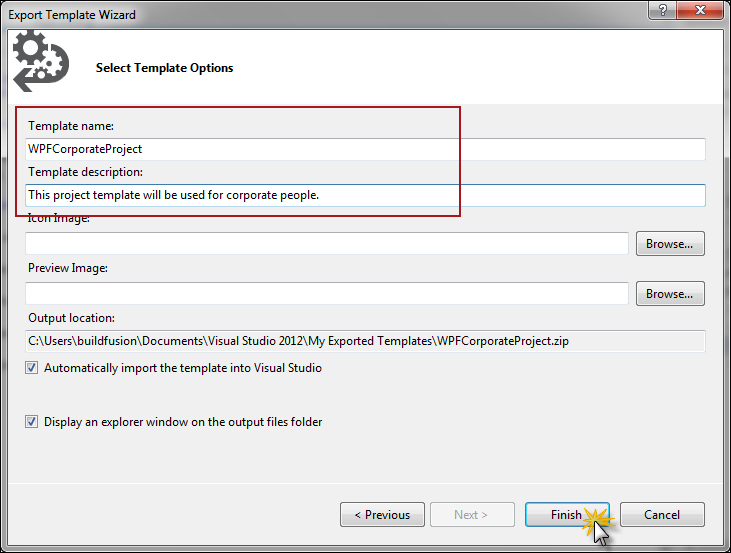
Once everything is done, click on Finish. The
WPFCorporateProject.zipfile will be created. The file is actually exported toMy Exported Templatelocation. To make it list in the New Project dialog box, you need to copy the file to the template location.Finally when we open the New Project dialog box, it shows our WPFCorporateProject as shown in the following screenshot:
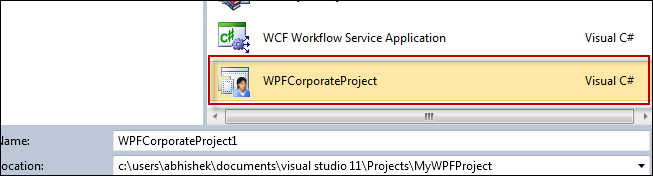
When we select the project type, it will automatically replace the namespace name, filenames, and so on, and customize itself for the new project.
In the same way, you can export Item Template in the solution. The main difference between the Project Template and the Item Template is that the Project Template is meant to define the whole project, while the Item template is meant to define one single project item.
Visual Studio defines a set of rules that need to be applied to the content of a ZIP file, when we create a new instance of it. During the export of a template, Visual Studio analyzes all the files that need to be exported with the project such that it can recreate the file again. It zips the whole content to a compressed zipped archive and exports the same to the specified folder.
Let's look at the content of the zipped archive.
The main file that holds reference to all the information about the template is inside the .vstemplate file. It is an XML file with the name of the project, the description, the project type, the default location, icon, and the references to the project items are listed in the file. You can look into the file for details:
<VSTemplate Version="3.0.0" xmlns="http://schemas.microsoft.com/developer/vstemplate/2005" Type="Project">
  <TemplateData>
    <Name>WPFCorporateProject</Name>
    <Description>This project template will be used for corporate people</Description>
    <ProjectType>Windows</ProjectType>
    <ProjectSubType>CSharp</ProjectSubType>
    <SortOrder>5</SortOrder>
    <CreateNewFolder>true</CreateNewFolder>
    <DefaultName>WPFCorporateProject</DefaultName>
    <ProvideDefaultName>true</ProvideDefaultName>
    <LocationField>Enabled</LocationField>
    <EnableLocationBrowseButton>true</EnableLocationBrowseButton>
    <Icon>__TemplateIcon.ico</Icon>
  </TemplateData>
  <TemplateContent>
    <Project TargetFileName="MyWPFProject.csproj" File="MyWPFProject.csproj" ReplaceParameters="true">
      <ProjectItem ReplaceParameters="true"
TargetFileName="App.config">App.config</ProjectItem>
       …
 <Folder Name="Properties" TargetFolderName="Properties">
  <ProjectItem ReplaceParametters="true" TargetFileName="AssemblyInfo.cs">AssemblyInfo.cs</ProjectItem>
        …
   </Folder>
    </Project>
<References>
   <Reference>
    <Assembly>System, Version=4.0.0.0,
      Culture=neutral, PublicKeyToken=b77a5c561934e089
    </Assembly>
  </Reference>
  <Reference>
  <Assembly>
     System.Data, Version=2.0.0.0,
 Culture=neutral, PublicKeyToken=b77a5c561934e089
  </Assembly>
  </Reference>
 </References>

</TemplateContent>
</VSTemplate>
In this sample XML document you can see there are few things to address:
The Name and Description indicate what needs to be shown on the New Project and New Item dialog boxes to the user. The Type and description appear on the description pane of the dialog box.
ProjectTypeandSubTypeindicates the grouping information of the Project Type in the New Project dialog box.SortOrderdefines where the item will be placed by default.LocationFieldindicates whether the location of the project could be chosen or not. By location we mean the unc path of the hard disk location.TemplateContentidentifies the whole hierarchy of the structure of the exported Template. These may contain references, project files, folders, and so on.Each project contains a set of
ProjectItem.ReplaceParametersindicates a set of routines that needs to be run on the file to ensure that all the parameters that are assigned to the file are replaced with the actual value. For instance the parameter$safeprojectname$is replaced with the actual project name that we specify while creating the project.A project can also include folders. The
Folderelement can be used to enumerate all the files inside theFolderfor a specific project.You can add some custom references to
.dllsusingReferencethat are available for each project. The references can be multiple.
When we open the Project Template dialog box, it reads the XML file with the .vstemplate extension and lists the template accordingly.
Tip
It is recommended to use reference from GAC rather than actually ship the .dll inside the zipped archive.
The template that has been created using the wizard is pretty simple and straight forward. Generally in real world scenarios, it is not very useful with the basic template that is there in Visual Studio. We need to export the template to include additional components. When Template is created we generally need to replace certain parameters that need to be set with actual values when the template is used up. Let's look into what are the parameters that are already predefined to be replaced by Visual Studio while creating the actual file.
|
Paramter Name |
Description |
|---|---|
|
|
Replaces the current version of CLR. |
|
GUID [1-10] |
You can generate 10 GUIDs for a single project. The parameter will be replaced with the unique GUIDs in the files. |
|
|
Name that the user provides in the Add Item pop-up dialog. |
|
|
Name of the computer. |
|
|
Replaces the project name that the user enters into the Project Popup dialog box. |
|
|
Organization Name to which the computer is registered. It takes the value from the HKLM\Software\Microsoft\Windows NT\CurrentVersion\RegisteredOrganization registry key. |
|
|
Namespace to add project files into. It returns the current root Namespace information. |
|
|
Returns the current File name. |
|
|
Returns the project name chosen by the user in the Project Dialog. |
|
|
Returns time of file creation. |
|
|
User domain name. |
|
|
Fetches current user name. |
|
|
Year of file creation. |
We need to add a $ sign before the start of each of these parameters to use it in the file. Let us have a
look at a sample code with parameters that we need to use while editing the projects.
// Legal Notice goes here
// File Created : $year $time$
// Created By :    $username$ $userdomain$ $clrversion$
// Copyright protected : $registeredorganization$

using System;
using System.Collections;
using System.IO;
using System.Text;
using MyOrganization.$safeprojectname$;

namespace MyOrganization.$safeprojectname$
{
    public class $safeitemname$
    {
        #region Variables
        //Declare Variables
        #endregion

        # region Properties
        // Declare Properties
        #endregion

        # region Events
        //Declare Events
        # endregion

        #region Constructors
        //Declare Constructors
        public $safeitemname$()
        {
        }
        #endregion

        #region Methods
        //Declare Methods
        #endregion
     }
}
The parameters in the file will get replaced when the actual file is created. Just add a new item from the list and you can see the parameters are replaced with meaningful names. Try out yourself and see the magic.
After creating a template for your project, let us add some sugar to the plate by introducing some of the additional points that you might need to consider while using this in real-world scenarios.
Sometimes, the parameters that are available to the files do not seem enough to you. Visual Studio templates allow you to put custom parameters, which will also be replaced when the actual replacement occurs. To write your custom parameters, you can use the CustomParameters tag and list a collection of all of those parameters that will be replaced while creating the item. Lets see how it works.
<TemplateContent>
   <CustomParameters>
      <CustomParameter
           Name="$mycustomparameter$"
           Value="Template designed by @abhishek" />
  </CustomParameters>
</TemplateContent>
Inside TemplateContent of the .vstemplate file, we can write our custom parameters like mycustomparameter. which will be replaced by the value.
Instead of using one single project as an item of project, it is sometimes useful to create an entire solution as a template. For example, for every organization the development group generally not only starts a project using one single project at a time, but rather they will create extra projects for data access layers, business logic, and so on inside the solution in addition to the actual project. We can create templates for all of them and list all in the New Project dialog box, or creating a template with the entire solution and giving it to all the developers is an easier way.
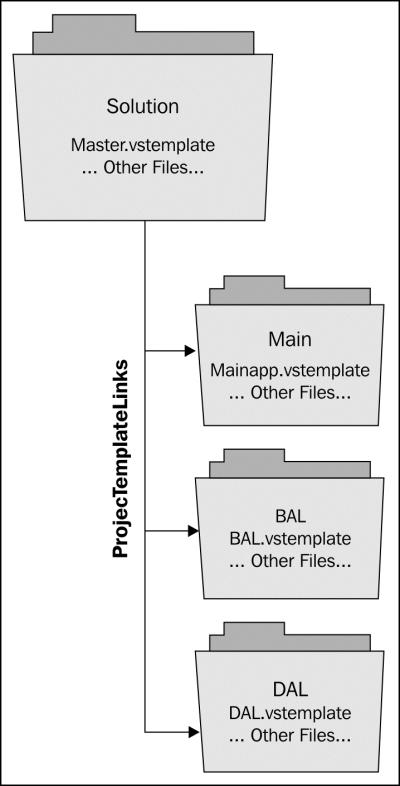
Multiple projects can be created from one ZIP file, but it needs to include one master .vstemplate file which lists the links to all individual projects in the solution. Let us suppose we want to have three projects for the template, one for Data layer, one for Business Logic, and another one is the actual project. To do this, we need to individually create all the .vstemplate files as we have discussed in the steps.
Once you have created all of these templates, we create individual folders for each of the projects. Data Access Layer should reside in DAL, Business Logic will reside in BAL, and the actual project will remain inside the Main folder.
The main content of the SolutionTemplate will look like the following:
<VSTemplate Version="2.0.0"  xmlns=http://schemas.microsoft.com/developer/vstemplate/2005
  Type="ProjectGroup">
    <TemplateData>
        ...
    </TemplateData>
    <TemplateContent>
        <ProjectCollection>
            <ProjectTemplateLink Projectname="DataAccessLayer">
            .\DAL\DAL.vstemplate
            </ProjectTemplateLink>
            <ProjectTemplateLink ProjectName="BusinessLogic">
            .\BAL\BAL.vstemplate
            </ProjectTemplateLink>
            <ProjectTemplateLink ProjectName="MainApplication">
            .\Main\MainApp.vstemplate
            </ProjectTemplateLink>
        </ProjectCollection>
    </TemplateContent>
</VSTemplate>
You can easily notice that the type of the template hence defined is actually a Project Group rather than a Project. Here we have defined the ProjectTemplateLink attributes to different projects templates in the zipped archive. You should create separate folders called BAL, DAL, and Main to store the .vstemplates of each individual project and place the SolutionTemplate.vstemplate file in the parent folder.
Once you are done with it, you can zip the entire folder structure again and put it in the configured location to be loaded on the New Project dialog box.
Code snippets are another important feature of the Visual Studio IDE. Visual Studio IntelliSense menu lists a number of code snippets that could be used very easily when you code for fast development. Code snippets are also available in the right-click menu in the editor as Insert Snippets.
Note
IntelliSense is a feature that enables writing code faster and easier. It is a feature that auto-completes the code while writing it in the IDE. Just start typing, it will automatically get the associated contextual items and list them inside the code window. For writing code faster, IntelliSense comes very handy.
To insert code snippets, perform the following steps:
The
propertyCode snippet will appear on the screen. Thepropfulltab will look as shown in the following screenshot:
A code snippet is composed of a number of placeholders. You can toggle between these placeholders using the Tab key and type the appropriate code.
Snippet is smart enough to automatically change placeholders that has a common meaning. In our case, if you change the data type of the variable, it automatically changes the data type of the property. You can change the name of the variable, and it will change all other occurrences of the variable in the code snippets.
When you are happy with the snippet, you can press Enter to continue.
You can also insert code snippets by right-clicking on the IDE and choosing Insert Code snippets. This option gives you the entire hierarchy of code snippets from which you need to choose appropriate code snippets.
Code snippets are available virtually in every type of code. You can use code snippet for ASP.NET pages, C# code blocks, or even for a JavaScript element.
Note
There is a special type of code snippet available in Visual Studio called Surround with. The Surround with code snippets are items that produce outlining on the code. For instance, you can Surround with a code with an if block which supports writing code inside it, or even you can surround a combination of methods inside a region. You can select a code block and right-click to select the Surround with feature of the IDE.
Visual Studio IDE also comes with an in-built Code Snippets Manager to easily manage code snippets. To open it, navigate to Tools and Choose Code Snippets Manager.
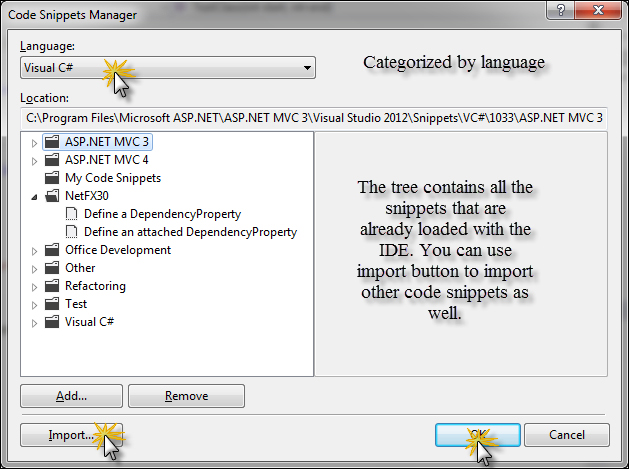
In the previous
screenshot, you can see you can easily manage the property/code snippets within Code Snippets Manager. You can get the location where the actual code snippets are installed. You can even import a new code snippet to your Visual Studio IDE. By default, the custom VS code snippets are loaded from MyDocuments/Visual Studio/Code Snippets. You can create your own code snippet and store it into this folder, so that it will be automatically detected and loaded in the IntelliSense menu.
Code snippets are actually an XML file with specific schema. Generally most of the code snippets that are regularly used are already listed there in the IntelliSense menu.
But while developing an application, it is often required to use INotifyPropertyChanged for properties. Let's see the following code which will automatically
include INotifyPropertyChanged for a property:
<?xml version="1.0" encoding="utf-8" ?>
<CodeSnippets  xmlns="http://schemas.microsoft.com/VisualStudio/2005/CodeSnippet">
  <CodeSnippet Format="1.0.0">
     <Header>
         <Title>propnch</Title>
         <Shortcut>propnch</Shortcut>
         <Description>Code snippet for property and backing field and ensure that it invokes INotifyPropertyChanigng and INotifyPropertyChanged</Description>
         <Author>Abhishek</Author>
         <SnippetTypes>
             <SnippetType>Expansion</SnippetType>
         </SnippetTypes>
     </Header>
     <Snippet>
         <Declarations>
             <Literal>
                 <ID>type</ID>
                 <ToolTip>Property type</ToolTip>
                 <Default>int</Default>
             </Literal>
             <Literal>
                 <ID>property</ID>
                 <ToolTip>Property name</ToolTip>
                 <Default>MyProperty</Default>
             </Literal>
             <Literal>
             <ID>field</ID>
             <ToolTip>The variable backing this property</ToolTip>
                    <Default>myVar</Default>
                </Literal>
            </Declarations>
            <Code Language="csharp"><![CDATA[
    private $type$ $field$;
    public $type$ $property$
    {
        get { return $field$; }
        set
        {
            this.OnPropertyChanging("$property$");
            $field$ = value;
            this.OnPropertyChanged("$property$");
        }
    }   $end$]]>
            </Code>
        </Snippet>
    </CodeSnippet>
</CodeSnippets>
The code here is divided into three sections. The <Header> section includes the <Title>, <Description>, <Shortcut>, <SnippetType>, and so on. These information are read and shown from the IntelliSense menu.
The second
section represents the actual body of the snippets that is divided into the <Declaration> part, and the <Code> block. The <Declaration> part defines the <Literal> attributes that are to be used in the <Code> block which will be replaced actually by the user. The <Literal> attributes are the placeholders of the current block.
The <Code> block includes the actual code. Here we define the <Literal> attributes inside $. Save the file inside the default location, that is, My Documents\Visual Studio 2012\Code Snippets. Once you install the Code snippet, it will be available inside the IntelliSense menu.
There are additional features to the IDE that can also help in the productivity of the code. Options like removing unused using statements and collapse/expand outlines can really help in navigating within the code more efficiently and productively. Let us consider some of the other interesting features within the IDE that can help productivity.
Visual Studio also allows you to organize Usings on your code by removing unnecessary Usings or reordering using statements at the top. It analyzes and parses the code that you wrote on the file upon selecting the option and does these manipulations.
To use this, right-click on your code and select Organize Usings. There are a few options available under this:
Remove Unused Usings: This will check every type that you have used in the code inside appropriate namespaces and remove those which are not used in the code.
Sort Usings: This option will sort the Usings in alphabetical order.
Remove & Sort Usings: It is the combination of both.
Visual Studio is smart in analyzing the code. When your code is loaded into the IDE, it is parsed and loaded with outlines, which allow you to hide/unhide individual blocks in the code. It produces a collapsible region of code which produces a + (plus) sign when collapsed and - (minus) when expanded.
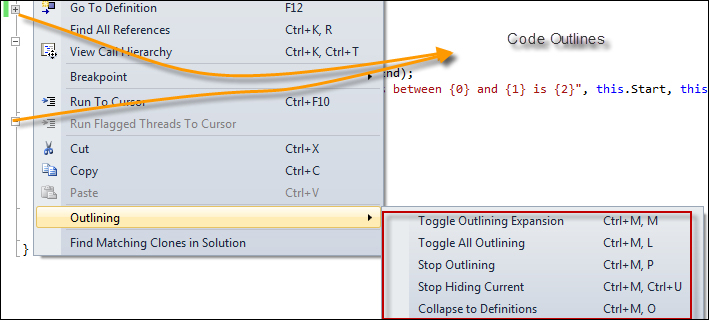
Collapsing the outline shows only the portion of the code that is relevant to identify it. Hence, while you are writing code in a large file, it is nice to have all the blocks collapsed. For a large code, it is a very tedious job to collapse/expand all outlining. The Visual Studio Outlining menu lets you toggle between them easily.
Right-click on the code and use Outlining | Collapse to Definitions. This will collapse all the logical blocks of code recursively into their collapsed state.
You can use Toggle All Outlining to toggle between expanded mode and collapsed mode.
Visual Studio has a Toolbox which can help you in some cases to quickly find code that you require often during development. Generally, the Toolbox is useful to work with the Designers, but sometimes it comes very handy to increase your productivity by remembering the recurring code.
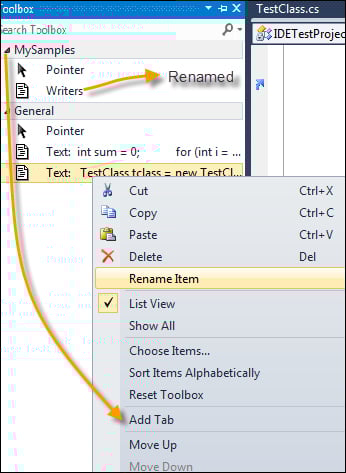
Select a code that you need very often. Drag it from the editor to the toolbar on the left-hand side of the IDE. If it is not open, navigate to View | Toolbox from the menu or press Ctrl +W, T.
The Toolbox will produce an item automatically with Text:…. You can hover over the toolbar item to see what code it has.
To use the code, you can again drag it to the editor.
Visual Studio allows you to use Smart Tags to enhance the productivity of writing code. Visual Studio Smart Tags can produce blank implementation of properties, methods, fields, or can even create a custom type by creating a class file directly in the appropriate project.
In this recipe, we are going to cover how to use the Smart Tags and Refactor option inside Visual Studio 2012.
Start typing the code as shown in the following screenshot. You can see while writing that Visual Studio is smart enough to detect the class name in the IntelliSense menu even though the Type does not exist.

By invoking Ctrl + .(dot) on the screen, it will open a small smart menu which allows you to create a Type just for the statement. Notice that the Type will create a file in the solution and add it to the project as well.
Let's create some members inside the Type. Go on assigning members, press Ctrl + .(dot) to produce properties inside the file as shown in the following screenshot:

The Smart Tags can also be used for various other productivity needs like renaming a Type, renaming a method, implementing an Interface, and so on. Let's have fun with creating few more Types and Methods in the solution. Sometimes this approach is also called as Consume First Deployment.
Tip
Similar to Smart Tags, Refactoring is another important feature of the IDE which helps in refactoring of code blocks easily. Refactoring is actually a technique to change the software system in such a way that the internal structure of the design changes are made more intuitive while the external behavior of the system remains the same. The Refactor Menu adds a special meaning when you are working on large projects. It is taken as a rule of thumb that when writing a code, you should always consider a method to only contain one unit of work and the whole Type or class should contain one independent module of work.
Consider the following code block:
   public void PrintMessage()
   {
       int sum = 0;
       for (int i = this.Start; i <= this.End; i++)
          sum += i;
       string message = string.Format("Sum of all numbers between {0} and {1} is {2}", this.Start, this.End, sum);
       Console.WriteLine(message);
       Console.ReadKey(true);
   }
The above method is doing more than one unit of work in a single method. It computes the sum of all the numbers between start and end, and then finally prints out the message. Let's select the first three lines and choose Extract Method from the Refactor menu. Extract Method is capable of automatically analyzing the code and detects the appropriate parameter sets that needed to be passed from your code and the appropriate return statement.
A new window pops up to allow you to export the selection to a new method. Let's call it
GetSum.Click on OK to finish. The magic of Refactoring automatically changes the portion of code with a method call and the method is placed in the code just below it.
Let us suppose that at a certain point of time, we don't like the name of the member name
GetSum, and we need to rename the member name more appropriately and want this to be done to all overloads and every calls that are made to in the entire project, all at a time. One thing you can do is to use the Find option in Visual Studio. But this will be worse when two types have the same method name. This has been a common problem. The Refactor Rename feature gives you easy means to rename a method by automatically analyzing code based on its type used. Select the member you want to rename and Press F2, or selectRenamefrom the Refactor Menu. Say we want to rename the methodGetSumtoAddBetweenNumbers.Select the New Name in the dialog box that comes up, and select the options that are needed to be considered.

The Preview reference changes will indicate that the tool will show a new dialog box that will be previewed before changes are made. Always select this option to be on the safe side.
Search in comments indicate that the name in comments also need be changed.
Search in strings will search in string literals too.
Rename overloads are useful if we need to change name of all overloads of the current name.
Once we select all the options, we go on to do the actual Rename operation. Now as we have selected Preview reference changes, the Refactor in Visual Studio will go on and select all the method names on each Type associated with it to change names and will be presented in a new dialog box in a tree format.

As you can see in the previous dialog box, it searched one occurrence of
GetSumin the treeTestClass.cs. It also previews the code on what it will look like after conversion is been made in the bottom pane. You can individually choose the checkboxes from the tree and make changes everywhere you need. The Nodes are responsive, I mean you can preview any node from the tree view upon clicking on the type and the actual final code will be shown on the pane below.Finally when everything is OK, select Apply to apply changes to every node that is checked.
Sometimes, it is important to encapsulate a Field into a property. One way is to write the entire property yourself, or you can navigate to Refactor | Extract Field to do the same thing. Extract Field works the same way as Rename. Upon selecting the field of a class, you will be asked for the name of the property and you can use this to create a property from the field.
Extract Interface creates an interface from the existing type taking all the members from the current type and exporting it into a new interface, and finally implementing the class from the interface.
Create a class that has at least one instance specific data member.
Right-click on the class and navigate to Refactor | Extract Interface.
You will be prompted with a dialog box where you can specify the name of the interface, the list of members in the current type and the filename.
Click on OK.
RemoveParameter or ReorderParameter are other options in the Refactor menu to remove extra parameters or to reorder the parameters in a member. Sometimes when the parameter is long, these options come in handy. Select each of these options and try them inside the IDE.
Smart Tags and Refactoring are inbuilt to the Visual Studio editor and act as a productivity feature to the developer that automatically creates objects or refactor them. There are a large number of these available within the IDE that can be used while coding to increase productivity.
Even though Refactoring and Smart Tags are the most important parts of code analysis, Visual Studio IDE also contains some other interesting features that are worth noticing. Let us consider them here.
Visual Studio IDE includes a unique feature to detect clones in code, or in other words you can find duplicate code in your solution. Sometimes developers copy and paste an existing code to other part of the project. Visual Studio Code analyzer finds code that is almost similar in logic. It is capable of detecting variable changes and parameters. To use this feature, select the portion of code that you want to find clones for. Right-click and choose Find matching clones in solution. You can also select Analyze Solution for Code Clones to detect any clones in the solution.
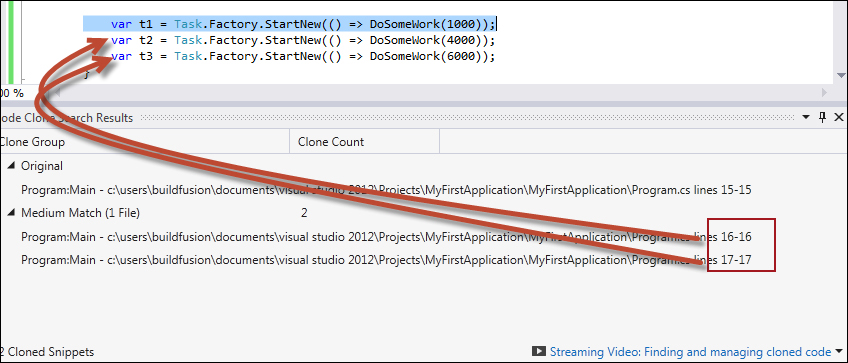
While the IDE detects the clones, it automatically puts in the weight of the clone.
Sometimes it is required to exclude files from the result of Clone search. This is often required when you have generated similar code using tools. In such cases, you can place a .codeclonesettings file inside the main application directory with the list of files that do not include in this search. This file is actually an XML file containing files, namespace, types, and so on which are excluded from the search. For instance:
<CodeCloneSettings>
  <Exclusions>
    <!-- Absolute or relative path names: -->
    <File>TestFile.cs</File>
    <!-- Filepaths may contain wildcards: -->
    <File>GeneratedFiles\*.cs</File>
    <!-- Namespace, Type, and FunctionName must be fully qualified: -->
    <Namespace>MyCompany.MyProject</Namespace>
    <Type>MyCompany.MyProject.MyClass1</Type>
    <FunctionName>MyCompany.MyProject.MyClass2.MyMethod</FunctionName>
    <!-- Names may contain wildcards: -->
    <Namespace>*.AnotherProject</Namespace>
    <Type>*.AnotherClass*</Type>
    <FunctionName>MyProject.*.AnotherMethod</FunctionName>
  </Exclusions>
</CodeCloneSettings>
The wide variety of wild cards makes this very handy to create logic.