When you start Spotfire for the first time, your first task is to load some data. This data can come from a file, a database, or even the clipboard. This chapter will show you how to get started quickly with a Microsoft Excel spreadsheet and move on to work with other data sources.
Data is at the heart of all analysis, and it's important that you know, not only how to load data into Spotfire, but also how data works. If you handle a lot of data in spreadsheet form, you will no doubt understand its content and meaning very well. You might even have developed advanced and insightful representations of your data. However, there is so much more you can do with Spotfire to improve the handling of this subject matter.
Importing data into Spotfire is just the beginning. To progress into its rich analytic world, you will have to become familiar with the relational database model. You will have to learn some formal data concepts. We will therefore spend some time taking a look at some basic database principles to set you on your way to advance quickly beyond the limited world of the spreadsheet.
At the end of the chapter, you will have built a solid foundation to work through the more visually exciting tutorials in this book, and indeed, for your future use of Spotfire as an everyday analysis tool. What's more, you'll be very pleasantly surprised at how easy it is to get started.
Before we begin, please read the preface if you haven't already done so. It contains some important prerequisites for the examples we will cover in this and later chapters. This chapter does not go into any detail about the Spotfire platform, focusing instead on the manipulation and analysis of data. You should find this a more rewarding and productive starting point. We will cover the TIBCO Spotfire platform in detail in Chapter 4, The Big Wide World of Spotfire.
In this chapter, we will cover the following topics:
Adding data to Spotfire from files
Key data concept—basic row/column structure of a data table
Key data concept—date types
Using the inbuilt filters in Spotfire
Key data concept—data relationships
Linking data in Spotfire
Connecting directly to a database
Key data concept—data queries
There are usually several ways to achieve the same result in Spotfire and, as you learn to use the tool, you will develop your own preferences. When you launch Spotfire, you will see all the main options to load data.

From the opening menu, you can use the Open File icon or the Add Data Tables icon. If you look at the main menu bar, you'll notice the File option. If you select this option, you should see the Open and Add Data Tables… options. Similarly, if you look at the icon bar just below the main menu bar, you'll notice symbols to open a file and add data tables. Hover your mouse over the icons and you will get a description of their functions.

Whether you want to use the menu options or the icons is a personal preference. The difference between opening a file and adding a data table is important, however.
Opening a file means opening a datafile or a saved Spotfire analysis file and closing any open Spotfire file in the process. Spotfire will prompt you to save your file before you open the new file.
Adding a data table means adding data content to an open Spotfire analysis file, keeping all its existing content. If you simply launched Spotfire, opening a file and adding a data table amount to the same thing but, if you want to add additional data tables, you must use the add data table option.
Let's open a Microsoft Excel spreadsheet in Spotfire.
The data used is BaseballPlayerData.xls, which you can download from http://www.insidespotfire.com or copy from the TIBCO Spotfire professional client installation directory (~TIBCO\Spotfire\#.#\Example Data\Baseball) on your PC. The TIBCO file is in text form, so you will need to convert it to Microsoft Excel first.
Start by clicking on the folder icon (on the far left in the previous screenshot).
You will be presented with a standard Open file dialog, allowing you to navigate to the spreadsheet file.
Spotfire will open a dialog window asking you to confirm or change key aspects of the Microsoft Excel file.

The first thing to notice is the Worksheet selection dropdown at the very top of the dialog window. Spotfire can only import one worksheet at a time. There is only one sheet in our file, so we can ignore this option.
The next thing to notice is the preview of your data and its structure. Spotfire will automatically detect and assign column headers and data types, but you can change any of these settings. You can also tell Spotfire not to import specific columns or rows.
We want to open the file with all defaults, so we're just going to click on OK, but please do explore the dropdown options for columns and rows and experiment with the settings. The core philosophy of Spotfire is discovery, so start as you mean to continue and explore all the options.
Once you click on OK, Spotfire will import the spreadsheet, create a new page in your analysis, and display the data as a visualization. The type of visualization will depend on the default option you set under Tools|Options|Document.
If the data is not displayed in tabular form, then first close the visualization by clicking on X in the upper right-hand corner and then create a Table visualization by clicking on the New Table icon in the Spotfire toolbar.

After you import the data and set up the Table visualization, you should see the following:

Note
Take a look at the General tab in Data Table Properties, which you will find under the main Edit menu. The default Store data option for the table you loaded is Linked to source. This option means that the data always remains in the source file and is pulled into memory by Spotfire when the analysis file is opened or the data is refreshed (using the Refresh Data button next to the table list). To make the analysis file more portable, you can change the status to Embedded in analysis, which means that the data resides in the analysis independent of the original file. Refresh Data still works and updates the embedded data with any changes made in the source file.
Save your analysis file by clicking on the disk icon or by selecting Save or Save As in the File dropdown list. Name it BaseballPlayerData. We will be returning to this file in future examples.
Ready for another example? This time, we're going to import a text file into Spotfire, which provides some useful options for structuring text files into a more analyzable form.
Follow the exact same procedure as for the Microsoft Excel spreadsheet, except this time we are going to open the data from a text file (
BaseballPlayerData.txt, which you can download from http://www.insidespotfire.com).Once again, you will be presented with an import dialog and data preview, but this time you will be able to customize how the file is delimited, which means how you want to separate the information into columns. You can also change properties related to text encoding.

Spotfire has correctly detected the tab separator in the text. Simply accept the defaults and click on OK to import the text into Spotfire.
The data will display exactly as it did with the Excel import. Compare Spotfire's output with the raw file opened in Notepad.
Spotfire can import data from other structured file types, such as Microsoft Access (.mdb) and SAS (.sas). The basic process to open these files is no different than it is for Microsoft Excel and text, except Spotfire uses the data structure embedded and defined in these files and gives you control over which parts of the data to import.
Below is an example dialog for a SAS file. The three columns we don't want to import are highlighted. The next step is to click on the < Remove button, after which the columns will flip to the left-hand window. When we're happy with the selections, we click on OK, and Spotfire will import a dataset based on the selections.

If you already understand the difference between rows and columns, great! You can skip this section. If you are not sure, then read on because your understanding of this concept is essential for data analysis and report authoring.
The columns in the dataset represent how the information has been categorized. They exist even if there is no data. Most people these days are familiar with Microsoft Excel. When you start a new spreadsheet, one of the first things you probably do is decide what types of information you are going to add; for example, First Name, Last Name, and Department in a simple human resources spreadsheet.
Once you have structured your spreadsheet in this way with column headings, you can begin to add the actual information, row by row. Your columns don't change in number or description, but your rows grow and shrink in number, and changes might be made to the information at any time.
One important distinction between data tables and spreadsheet workbooks is the way in which almost everyone manipulates the visual layout of the rows in a spreadsheet. You might, for instance, not repeat a department value until it changes; you might merge cells to improve the look and feel. You cannot do this with data tables. If the department column value for the first three rows is Marketing, then Marketing must be repeated in each row.

Data content (the values in the cells) can change, but it is always filtered and selected through references to the column names. For example, the request, show me all the records for Marketing, might produce zero rows or several million rows, depending on how many records the query finds with the word Marketing in the Department column.
In a spreadsheet, it is easy to build calculations that reference any cell in the matrix. If you want to make a calculation in a data table, such as sale amount - cost amount, you can only do that across each row. You cannot subtract the cost amount in one row from the sale amount in another. This is a key distinction between data tables and spreadsheets. It might seem like a limitation in a data table, but the discipline of that structural integrity ultimately allows you to create very powerful analyses, and there are ways to change the structure of a data table into new forms to support a particular calculation requirement.
Reports and visualizations are built around column names. For example, you might want to create a simple sales by region visualization. What you are doing is putting the sales column against the region column and asking the visualization engine to populate the chart or graph with whatever row values are present beneath those columns in the given data set.
Another key data concept that is important to mention at this point is that of data type. This concept is equally important in spreadsheets; it's just that spreadsheets don't generally force you to declare the data type, and they allow you to mix and match data types under individual columns. In data tables, each column must have a single data type for all the values in all rows.
So what does data type mean? There are, in essence, three types of data:
Numbers
Dates
Text
They are defined as such because they have distinct properties. Numbers can be used in calculations, and the vast array of mathematical functions and operators can be brought to bear on them. Text can be parsed, concatenated, counted, and arranged into categorical hierarchies. Dates have a special meaning and can be used in time calculations and hierarchies (year>month>day, for example).
However, life is never simple, and there are several subtypes of these data types and a few other special data types that you need to understand.
Spotfire uses 12 data types, and all data columns imported into Spotfire must be put into one of these categories. The following table describes the ones you will use the most. Please consult the TIBCO Spotfire documentation for a more technical description.
|
Data Type |
Definition |
|---|---|
|
Integer |
Numbers with no decimal places |
|
Real |
Numbers with decimal places |
|
Date |
Date with no time element |
|
DateTime |
Date and time combined |
|
String |
Text |
|
Boolean |
Logical True or False |
Spotfire's inbuilt filters offer a very powerful and immediate way to start analyzing your data. Every time you add a data table to an analysis file, Spotfire creates a filter for each column. Just reflect on this for a minute: if we are going to try to filter or screen our data in some way, we have to do so on the basis of the values in one or more of the data table's categories. That is why a filter always corresponds to a table column and its values to whatever data currently populates that column through the rows, or records, in the table.
Let's take a look at the baseball data we loaded earlier in this chapter.
Open the Spotfire analysis file you saved earlier (
BaseballPlayerData.dxp) or reload the data if necessary.Look at the Filters panel on the right-hand side of the analysis. If, for some reason, there is no Filters panel, simply go to the View menu and select Filters. Filters cannot be deleted in Spotfire. They can be hidden from view and configured in custom ways, but the underlying filters always remain.

Each of the filters has a header that describes the associated column. The values under each heading reflect the data found in the table's rows, so the filters can be a useful way to explore the scope of the data. For example, there are only two possible values under League—AL and NL—that's useful to know.
You'll notice that the filters take different forms for the different columns. That's because Spotfire chooses from a set of six filter types to best suit the data that is found under each column. Some columns have a small set of unique values, such as the League column, all the rows for which have either AL or NL; the check-box filter type is ideal for this scenario. In contrast, the Games Played column is numeric, with values ranging from 86 to 162, so a slider filter is more appropriate.
Go to the filter for At Bats and move the left and right sliders until they define a range between 500 and 550. If you double-click on the number, you can type in a value and then simply hit the return or enter key to move the slider precisely.
Go to the filter for Runs and move the left slider up to 80.
What we're looking at now is records for players who were at bat between 500 and 550 times and who scored 80 runs or more. If you use the table's horizontal scrollbar, you can move through the columns until you find the Player column to see the players in question.

Notice how the other filters have adjusted to reflect the values available for the filtered dataset and how the row status at the bottom left of the analysis window has changed to 12 of 278 rows.

Explore the filters yourself to get a feel of how they work and what is possible. To reset all filters back to their default state, simply click on the reset filter icon or select Reset All Filters from the Edit menu.

An important point to stress here is that we haven't removed any data from the underlying table. Our visualization—in this case, a basic table listing—has changed and lost some rows, but as you saw, when you reset the filtering, the visualization adjusted dynamically and displayed the refreshed results. We will cover additional aspects of filtering as the book progresses because it is central to the way Spotfire works.
Let's quickly review what we learned so far:
We covered how data tables are structured
We discussed how data tables differ from spreadsheet workbooks
We know how to load a datafile into Spotfire
Now, we're going to explore one of the most powerful aspects of data tables: linking or relating the information in two or more different tables. Building structural links between data tables is at the heart of the relational database model that underpins well-known databases, such as Oracle and Microsoft SQL Server. Spotfire is not a relational database as such, but it uses relational principles and provides some table relationship functionality.
If you think back to our discussion of rows and columns, you should be able to conclude that the relationships between tables are defined at the column level. In other words, if we have a table with a Department column, we might want to relate it to another table that also has a Department column. In plain English, we're going to say something like "relate these two tables based on the row values found under their respective Department columns; if you select Marketing records from one table, the relationship will be associated with any Marketing records in the other table."

An instructive corollary of this relationship—and this is a very important concept for you to grasp—is that the row values must match perfectly but the column names can be completely different. You can define a relationship between a "Department" column in one table and a "Dept" column in another. There is a limit, however, to how much you can tell the relationship engine how to interpret the values. For example, will Marketing, marketing, and MARKETING match? You have to explicitly define such match rules.
Let's see how table relations work in practice. First, we have to add some new data.
The data used here is BaseballPlayerData.xls and BaseballTeamData.xls, which you can download from http://www.insidespotfire.com.
Open the baseball analysis file you've been working with.
We're now going to add a second data table to the analysis, so select Add Data Tables… from the File menu.

BaseballTeamData.xlsis a Microsoft Excel spreadsheet derived from the baseball player dataset and contains team-level information only. We'll import it just like we did in the earlier examples, accepting the column definition defaults as before. The only difference is that, this time, you will add the table to an existing analysis. This datafile has one row for each team and provides aggregated values (mainly averages) for all the individual statistics provided by the player data table.After you add the data table, Spotfire automatically adds a new page with a default visualization.
A core feature of Spotfire is the seamless way in which you can interact with multiple visualizations based on multiple data tables. Be patient, we will move on to the visualization part soon, in Chapter 2, Visualize This!. First, you must learn the key technique to link or relate different tables.
We are going to relate the player data table, where each row in the data represents an individual baseball player, with the team data table, where each row represents a baseball team. The obvious link is the team name, so that is how we will relate the two tables. Once related, the single row for, say, team Detroit in table 2 will be linked to the nine rows for team Detroit in table 1.
Note
Data granularity is an important concept. One table here has a finer granularity (player) than the other (team). Such tables can be related through the lowest level of granularity that they share—team, in this case.
Table relations are defined in the analysis file's Data Table Properties.
From the Edit menu, select Data Table Properties. The dialog that opens shows you all the tables currently loaded into your analysis file.

Navigate to the Relations tab and click on the Manage Relations button and then the New button to get to the table relations dialog.

Select one table as the left data table and the other as the right table; it doesn't matter which is which. Now you need to decide how these tables are related by selecting the columns through which to connect them. Use the dropdown lists in each case to select Team because that is the common link between these two data tables.
If you want to define a more flexible matching rule, use the Left Method and Right method dropdown. For example, you could select Upper in both cases. This setting will ensure that the match is case insensitive. The data will not change, and one table might still have Detroit and DETROIT in any given row, but they will match the relationship because they will be converted to all uppercase for matching purposes.
Finally, click on OK in the New Relation dialog, click on OK in the Manage Relations dialog, and click on OK in the Data Table Properties dialog, noting as you do that both tables have been assigned the same color index, indicating a defined relation.
You can edit a relation at any time by going back to the Manage Relations dialog, selecting the relation of interest, and clicking on Edit.
If you need to relate two tables on the basis of more than one column, simply add each relation pair one by one.
Another way to relate data in Spotfire is column matching, which is used to determine how multiple tables should be treated when used alongside each other in the same visualization. Spotfire will automatically match columns with the same name, regardless of whether you defined any relationship between the two tables.
You can override Spotfire or add new column matches by performing the following steps.
Navigate to the Column Matches tab.
You will notice the three columns already matched by Spotfire.

You can select and delete any of these columns using the Delete button.
You can edit any of the matches or you can add a new match. Spotfire will allow you to match any pair as long as they have the same data type. In the screenshot, Team and Position have been selected as a potential match, which doesn't actually make any sense. It does illustrate how important it is to understand all aspects of your data, not just its structure but also the values.
Working with text files and spreadsheets can be very convenient but, sooner or later you are going to want to work with databases, which offer many advantages such as scale and centralization. If you want to build scalable, enterprise analytical solutions, you will have to maintain your source data in a database or even distributed across multiple databases. Spotfire provides many ways to connect to databases, and you can retrieve data simultaneously from multiple databases and files.
Up to Version 3 of Spotfire, we had the option to connect to databases such as Oracle, Microsoft SQL Server, and Microsoft Access using standard data connectors such as ODBC, OleDB, Oracle client, and SqlClient. Explaining how these types of connectors work is beyond the scope of this book. You will find detailed explanations on the Internet.
They all require database-specific drivers, which you can think of as like an operating system plugin. Many of these drivers come bundled with operating systems; some you will have to download and install. Again, you will find lots of help on the Internet. The best place to look is on the websites of the various database vendors.
They all require some form of connection string, which is just a way to tell the driver the address of your database and the credentials you are using to connect. Most databases will require authentication before you can connect and access their data. The website http://www.connectionstrings.com is a good starting place. Sometimes the entire connection string is pasted as a literal string into a single configuration box; sometimes the individual elements of the connection string are entered into fields in configuration form; it just depends on the connector.
Open Database Connectivity (ODBC) is one of the easiest drivers to use. It might not be perfect for all applications, but it's usually a reliable way to get started. As you gain experience, you will use other options. It might also depend on the database(s) you wish to connect to.
There are three important prerequisites before you start:
The relevant ODBC driver must be installed on your machine.
You must have local administrator rights to set up the ODBC connection.
You must have connection details for the target database, including a username and password to authenticate.
Open Control Panel and then Administrative Tools. If your control panel is organized by theme, you'll have to go into System and Security and then into Administrative Tools.
In Administrative Tools, open Data Sources (ODBC) and click on the System DSN tab.

Click on the Add button to configure the connector, scrolling down the list of drivers until you find the one you need. For this example, we're interested in the Oracle driver.

Click on Finish to get to the business end of the configuration.

Data Source Name is entirely arbitrary; it is the reference you will use in Spotfire. The Server configuration includes a hostname, which is simply the name of the server hosting the database; a port, usually 1521; and a DB service name, which you can get from the database administrator. Click on OK to finish and return to the System DSN tab, where you will see your entry. Make sure you click on OK to exit the ODBC administration tool.
Now you are ready to use this ODBC connection to retrieve data into Spotfire.
Use the File menu or the Add Data Table icon to navigate to the add data table dialog just as you did to add data from a file, except this time you are going to select Database rather than File.

Click on Database to get the Open Database dialog. We're interested in Odbc Data Provider, so select it and click on the Configure button.

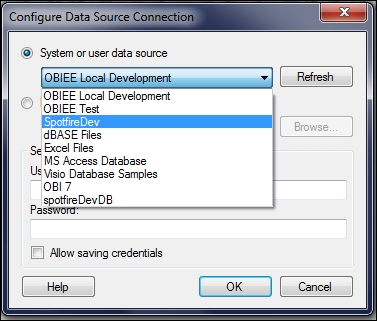
Select the connection name you configured in the ODBC administrator. You'll notice that a number of connectors are defined in the next screenshot, including one called SpotfireDev. You will need to create one of your own for a database to which you have access.
Click on OK to get back to the Open Database window; notice that Spotfire has created a connection string. Click on OK to open the database. The database will eventually open; it may take a little time if your network connection is slow or the database is complex. You will see a hierarchical organization of high-level containers, in each of which you should see data tables and their constituent columns. It's not unlike navigating a folder system on your computer.

You will need to have some knowledge of the database and some idea of the data you are looking for, but Spotfire will allow you to navigate the database objects and select whole or partial tables to import. Spotfire will also generate the SQL automatically, but you can customize and fine-tune the SQL, adding a where clause, for example.
If you click on + next to one of the main objects, such as SPOTFIRE in the example, the entry will expand to list all the tables in that schema. You can then scroll down to a table of interest and expand further to view the individual columns in the table.

When you are happy with the selections, give the import a name. This will be the name of the table in Spotfire. The data will load just as the files did, except the structure of the data (column headers and data types) will be determined by the source database.
Tip
Downloading the example code
You can download the example code files for all Packt books you have purchased from your account at http://www.packtpub.com. If you purchased this book elsewhere, you can visit http://www.packtpub.com/support and register to have the files e-mailed directly to you. You can also download code from http://www.insidespotfire.com.
Our final data concept in this chapter is the idea of a data query, which is usually achieved using some flavor of SQL, a standard language to interact with databases. Although SQL varies a little from database to database, the basic syntax is fairly consistent. If you don't already have experience using SQL and you want to develop your data analysis skills, you will have to learn more about this key analytics tool.
When you work with text files and spreadsheets, the only practical way you can manipulate large amounts of data is at the column level, removing entire columns that you don't want. What if you want to manipulate the rows in a large dataset? In a spreadsheet, you could of course, use filters to remove rows.
Overall, however, manipulating data in this way is more tedious and potentially more error prone than using a single SQL statement. What if you want to involve more than one table in your "filter"? You can also take advantage of the enormous power of databases to handle large amounts of data and process complex queries.
A basic SQL statement has just three elements, highlighted in the following code in all caps:
SELECT column_name_1, column_name_2, …, column_name_n
FROM schema_name.data_table_name
WHERE condition
You need to provide a schema_name. Remember when we connected to a database, we saw a set of logical containers into which the tables were organized. These are examples of schemas. The terminology schema may mean slightly different things in different databases, but most organize the tables into a set of logical containers, and you need to prefix table names in your query with the container name using a dot to separate the two elements.
Often, a database administrator will create what is known as a view. These are pre-written, often quite complex, queries spanning multiple tables that define a particular dataset. As an end user, you can use them just like tables.
Tip
If you have a complex data requirement that you feel is beyond your SQL skills, talk to a database administrator or developer and get them to create a view for you. You can then select from the view as though it were a single table.
The SELECT and FROM clauses are mandatory, but the WHERE condition is optional and is just a logical expression to limit the data that is returned. For example:
WHERE column_name_1 = 'some text' AND column_name_2 > 4
If you want to include more than one table in your query, you will have to use what is known as a join.
SELECT a.column_name_1, b.column_name_2, …, etc
FROM schema_name.data_table_name_1 a
JOIN schema_name.data_table_name_2 b on a.column_name_x = b.column_name_y
WHERE condition
Note how the aliases a and b have been used for the two tables. Aliases can be anything you like, but are usually short and make the statement easier to write and read.
The JOIN statement ensures that you only return rows where the join condition is true, as well as any other condition you defined. There are other types of joins. The following link of the w3schools website provides a helpful tutorial: http://www.w3schools.com/sql/sql_join.asp
You have a come a long way in this chapter, and you should be pleased with the progress you have made. By now you should know how to add data to Spotfire from text, spreadsheet, and data files; link data in Spotfire; and connect Spotfire to a database.
We also covered Spotfire concepts like the inbuilt filters, data table properties, and table relations and column matches in Spotfire
Finally, you picked up a lot of essential data concepts like the basic row/column structure of a data table, different date types, data relationships, how to use ODBC, and data queries using SQL.
I hope this chapter has not been too dull. It is very important that you understand data sources, how to import data into Spotfire, and how to manipulate data. Even the most ingenious visualization or collection of visualizations is only as good as the underlying data. If you get the data part wrong or you can't get the data you want, you are wasting your time, at best, and grossly misleading your analytics consumers, at worst.
This chapter is just a basic foundation in data analysis, but it is sufficient and will serve you well to explore the more visually compelling aspects of Spotfire. Let's go straight to Chapter 2, Visualize This! and start visualizing!