


Welcome to Oracle Hyperion Interactive Reporting! Interactive Reporting is an extremely robust and powerful business intelligence tool providing ad-hoc querying, data analysis, dashboards, and other reporting capabilities. Business analysts access the software through the EPM Workspace, a central location for viewing and managing content across all of the Hyperion products. The product is extremely flexible and provides analysts with the ability to quickly analyze data and produce deliverables. The software provides a consistent platform for managing content, where documents can be customized, saved, and shared across an organization. The focus of this chapter is to provide an overview of the Interactive Reporting Web Client and EPM Workspace, providing the business analyst with the skills necessary to work with the tool on a daily basis.
The content in this chapter covers:
Navigating the EPM Workspace
Installing the Web Client
An Overview of the Web Client interface
Methods for opening and saving documents
Methods for importing and provisioning files
Steps to edit file properties
When working with Interactive Reporting, it is hard to escape the term BQY. BQY or BrioQuery, is the extension given to all Interactive Reporting document files. Developers create BQY files using the Workspace, Interactive Reporting Web Client, or Interactive Reporting Studio—a developer tool used to create and manage BQY documents outside of the EPM Workspace.
The EPM Workspace is similar to a portal, where all Oracle Hyperion applications, reports, and other files can be accessed and integrated using a shared security model. The Workspace is accessible through the web browser and contains a filesystem and other gadgets including personal pages and content subscription. Interactive Reporting is one of the many products that integrate with the Workspace, providing users a central location to save, share, and publish content.
To navigate the Workspace, a user account must be created and provisioned with the necessary privileges to the Workspace and the Interactive Reporting components. After the user account is created, users can access the Workspace using a web browser.
Note
Each environment may be configured differently and have different login methods and start pages configured. However, this book provides examples based on the default product configuration.
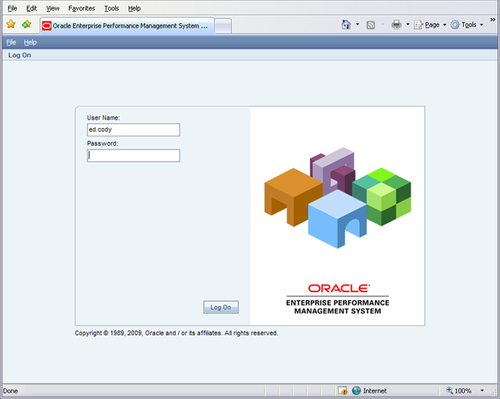
The following screenshot shows the default login page for the EPM Workspace in version 11. Once the user enters the assigned username and password, the default home page appears. Other configurations may be configured to use external authentication methods, where the user will bypass the initial login screen and start at the default start page for their configuration.
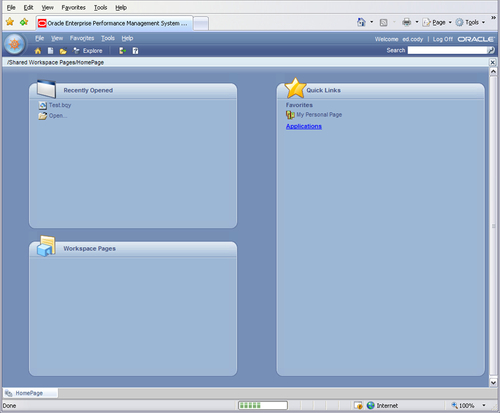
The default home page shown in the following screenshot is new to the Workspace in version 11. The new home page feature allows users to add Quick Links, browse recently opened documents, and view custom created Workspace pages.
If the desired content is not listed on the main home page, the Explorer can be accessed by clicking on the Explore image on the toolbar at the top of the page, allowing users to browse for content in the Workspace filesystem similar to Windows Explorer. The Explore window, shown in the following screenshot, opens to a page with two frames showing a folder structure on the left for navigating the file structure and the contents of the current folder on the right for managing and executing items. The main parent folder in the file system is called the Root folder and other files and folders can be added under the Root folder as desired. If there is a need to return to the previous page, the user can click on the HomePage tab at the bottom-left of the page. As additional items are opened in the Workspace, additional tabs are created at the bottom of the screen. The user can navigate through the different items opened by using the tabs across the bottom of the Workspace window. If desired, these tabs can be closed by right-clicking on the tab and selecting Close.
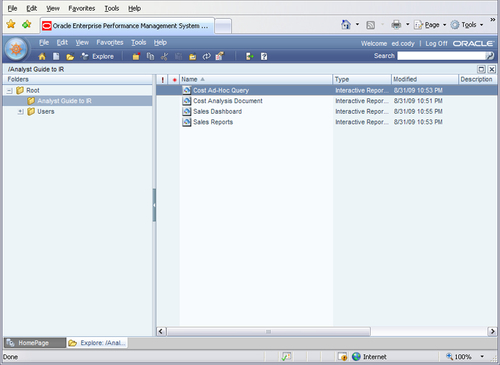
After navigating to the desired folder, the user can open the documents of interest. Files from different applications are designated with two unique identifiers in the Explore window. The first identifier is the image that is shown to the left of the name, and the second identifier is the object Type. The documents shown in the previous screenshot are Interactive Reporting documents and can be opened using the HTML viewer or the Interactive Reporting Web Client. Selecting the HTML option will render the document in a new tab, while opening the document in the Interactive Reporting Web Client will open the document in a new browser window.
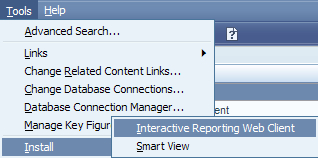
The Interactive Reporting Web Client software must be installed to open documents in the Web Client. This installation is a plug-in to the browser, where the browser will activate the Web Client software when an Interactive Reporting file is initiated. The installation will automatically execute upon opening the Interactive Reporting document in a browser without the Web Client installed, or the installation can be manually executed by accessing the Tools | Install | Interactive Reporting Web Client item as shown in the following screenshot:
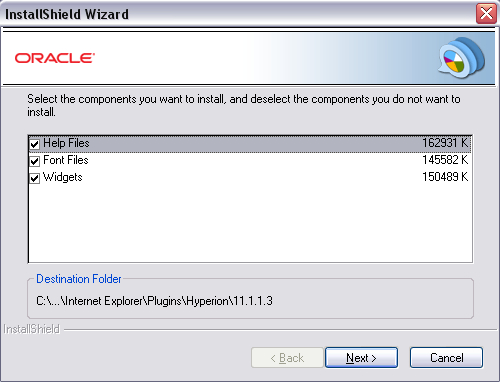
Once the installation is initiated, a window appears with the ability to customize the installation by checking/unchecking options. The default installation will install all of the components of the tool and is recommended:
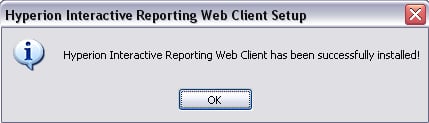
The installation will commence after clicking on the Next button on the configuration menu and will continue through the completion of the installation, signified by the following window:
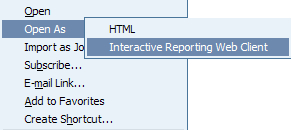
Interactive Reporting documents are opened by double-clicking on the document in the Workspace or by highlighting and right-clicking the document, highlighting Open As, and selecting either HTML or Interactive Reporting Web Client from the menu as shown in the following screenshot.
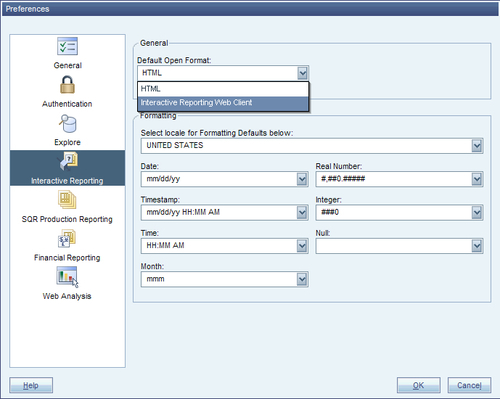
When the document is double-clicked, the default configuration method for opening the document is invoked by Interactive Reporting. Initially the software is configured to use the HTML viewer as the default, but the default preference can easily be changed by modifying the Default Open Format of the document in the Interactive Reporting preferences of the Workspace. The main Preferences window is opened by accessing the File menu and selecting the Preferences menu item, as shown in the following screenshot. Once the Preferences window is open, the Default Open Format is found under the Interactive Reporting tab on the left menu of the window. To change the default format from HTML to the Interactive Reporting Web Client, click on the drop-down arrow, select the Interactive Reporting Web Client item, and then click on the OK button on the Preferences window. In addition to the file open format, other preferences can be modified in this window to address changing formats for date, time, and currency.
Interactive Reporting documents can be saved and opened from the local machine by opening the document using the web browser with Web Client installed. To open the document from the local machine, highlight and right-click on the Interactive Reporting file and select Open With from the menu that appears. If the web browser of choice is not listed, select Choose Program from the list. Browse the window, select the web browser with the plug-in installed, and check the checkbox at the bottom to Always use the selected program to open this kind of file in order to always open the Interactive Reporting document in the selected web browser. Then select OK in the window to open the Interactive Reporting document with the web browser.
The web browser will open and the Web Client will load the document into the viewing window. If offline mode is not turned on, the document will open a window to authenticate with the Workspace. If no connection can be established with the Workspace, only the data sections will be visible when the document is opened. If the connection can be established and the file saved to the desktop still exists in the Workspace, then the document will load with proper permissions to the file and the document can be processed as if it was opened from the Workspace. If the file is not located in the Workspace, then the file can be imported by the user if the user has import permissions. Instructions for importing are found in the importing section of this chapter.
Understanding the Web Client interface is crucial to being proficient in the product. The different sections of the software contain a variety of different options, but the location of where to find and utilize these options is the same across the tool. Knowledge of the interface and how to leverage the features of each section is key to unlock the full potential of the product.
The sections of an Interactive Reporting document are the different objects in the software used to aid in querying, analyzing, or displaying information. There are seven types of unique sections. The specifics of each section will be addressed in the following chapters:
The Query section is the main section used to setup and execute a query from a relational or multi-dimensional database.
Each Query section is accompanied by a Results section where the data returned from the Query is displayed and can be manipulated.
The Table section is similar to the Results section and is used to manipulate and split a dataset into different subsets for analysis.
The Pivot section is specific to a Results or Table section, and is used to graphically display data in pivot table format—similar to Microsoft Excel Pivots.
The Chart section is also specific to a Results or Table section and is used to display data in a chart.
The Report section provides the ability to present pivots, charts, and tables of data in a well formatted document.
Dashboards are used to create custom interfaces or interactive displays of key metrics.
The following screenshot displays the Interactive Reporting Web Client window open to the Query section. The arrows shown in the screenshot highlight each of the different features and toolbars of the product. These different features and toolbars can be toggled on and off using the View menu:
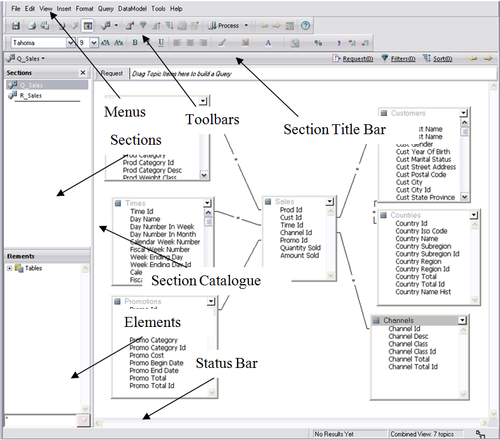
The Section Catalogue, displayed on the left of the previous screenshot, contains two windows for navigating and editing sections. The Sections window displays the different sections in the document, and the Elements window is used to add content to a section. Both windows are used commonly when building documents and performing analysis.
The Interactive Reporting Web Client Menus are similar to a typical menu structure seen in most Windows-based applications. Interactive Reporting contains a standard set of menus and each section also contains menus specific to a section. The details of the section-specific menu items will be discussed in each respective chapter. The following menu items are consistent between all product sections:
The File menu provides the features for managing the document, including the ability to save documents both to the local drive and to the Workspace, the ability to import external data, and the ability to export and print content.
The Edit menu contains the general options for managing sections. These features include the standard copy and paste options, but also include the ability to delete, rename, and duplicate sections.
The View menu contains the features for managing the different windows and views of the document, including showing/hiding windows and displaying query-specific information.
The Insert menu is used to add a new section into the document.
The Format menu is used to format the display of sections, including font, color, size, type, and other common formatting options.
The Tools menu provides the ability to execute queries and manage default and program options.
The Help menu contains the help contents, links, and information about the product version.
These menu items are shown in the following screenshot:

The Interactive Reporting Web Client contains three standard toolbars used to manage views, content, and formatting. The toolbars are turned on and off through the View menu. To show or hide a toolbar from the viewing area, go to View Menu | Toolbars, and then click on the toolbar name to show or hide it. A checkbox next to the toolbar signifies the toolbar is shown in the viewing area. The following is a description of each of the three toolbars:


The Section Title Bar has two different purposes. The bar contains a navigation drop-down on the left of the bar, and it contains section-specific controls on the right-side of the bar which is used to toggle options on and off. These options are specific to each section and are used to build queries, add content to a section, or to sort content. When these options are toggled on, the options will be displayed at the top or bottom of the main content window. The individual chapters for each section provide a breakdown of the different options included in the Section Title Bar.
The Status Bar is shown at the bottom of the Web Client interface and contains information on a specific section. The information provided in the Status Bar includes the number of rows returned from a query, the number of rows shown in a results set, the number of rows and columns in a pivot table, the number of report pages, and the zoom settings on the dashboard.
Documents can be saved to both the Workspace and to the local machine with data and formatted Dashboards, Pivots, Charts, and Reports, allowing for a snapshot of data and section templates to be saved and reused as desired. A variety of save options exist including settings to reduce file size, settings for password protection, and settings to toggle the offline mode of the document.
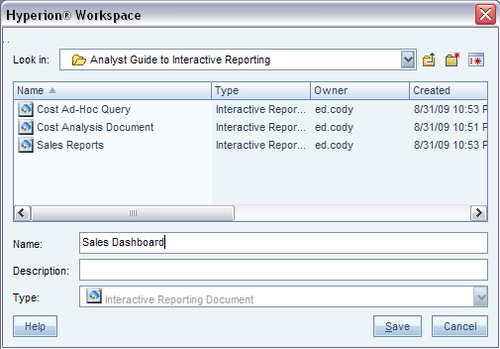
Documents are easily saved to the Workspace from the Interactive Reporting Web Client. There are two options for saving to the Workspace and both options are located in the File menu. Selecting the first option, Save to Repository, saves the changes in the open document over the document in the Workspace. Selecting the second option, Save to Repository As, prompts a Workspace Explore window, as shown in the following screenshot, allowing navigation to the preferred save location. Clicking on Save in the window will save the document to the location or will prompt an alert box for verification to overwrite an existing file. If the recently saved document does not appear when returning to the main Explore window, refresh the list of available documents by right-clicking on the main window and selecting the Refresh menu option.
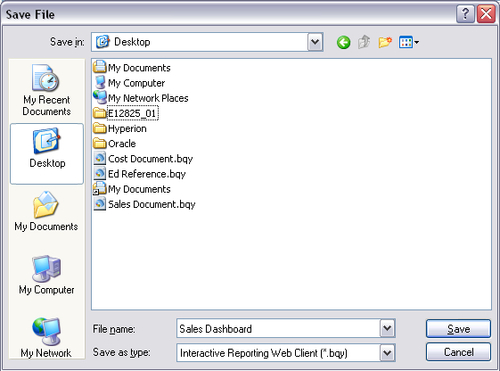
Interactive Reporting Web Client documents can be saved to the local machine, similar to saving documents to the Workspace. To save a document to the local machine, click on the Save button on the standard toolbar or access the File menu and select Save As. The following screenshot shows the standard save window that appears when saving a document to the local machine. Notice that the file type is specified as Interactive Reporting Web Client ( *.bqy), and the document when saved to the local machines will contain the BQY extension:
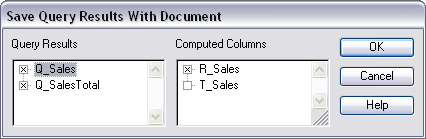
The File menu contains a list of save options for managing file size and access. The first option in the Save Options menu is named Save Query Results With Document, which is used to reduce the file size by excluding the data results or the computed items in the Results or Table section of the document. Saving large results may take up significant disk space, so excluding the results of a Query may be desired to reduce the file size. The following screenshot shows the window that appears after selecting the Save Query Results With Document menu selection. As shown in the screenshot, the Query Results and Computed Columns can be deselected. In the example, the T_Sales computed item has been unchecked, removing the storage of the computed items in the Table section named T_Sales. By unchecking the X next to a section in the Query Results window, the data stored in the Results section of the named Query will not be stored when the document is saved.
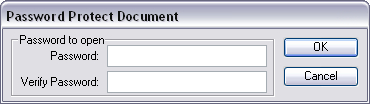
Documents can be password protected from unauthorized access. Since documents can be saved locally, adding a password to the document will provide security to the data contained in the file. The Password Protect Document method is accessed by clicking on the File menu, highlighting Save Options, and selecting the Password Protect Document menu option. The following screenshot shows the password protection window, where both a password and verification of password must be entered to create a password on the document. Upon opening the document, a similar window will appear prompting for the password to the document.
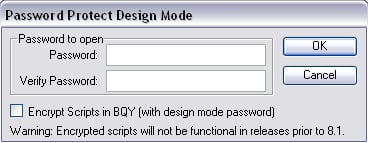
Custom code and dashboard objects may also be password protected, and the custom code of the document may be encrypted to prevent access to the programming contained in the document. Users writing custom code may be interested in this feature to protect certain code statements from being accessible to the general user community. Access the design mode password protection window by clicking the File menu, highlighting Save Options, and selecting the Password Protect Design Mode menu item. The following screenshot shows the design mode password protection window, where a password is configured and a checkbox is set allowing for the encryption of the code in the document.
Note
Code encrypted in documents will not function in releases of Interactive Reporting prior to 8.1, as stated in the following screenshot.
Once password protection for the design mode is configured and a user attempts to open the design mode of the document, a window will appear prompting for the password to unlock the design mode of the document similar to accessing a password-protected document.
Locally saved BQY documents can also be configured to run in offline mode where the document does not attempt to authenticate with the Workspace when opened. The offline mode setting can be accessed by clicking on the File menu, highlighting Save Options, and then selecting the Work Offline in Web Client menu item.
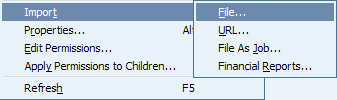
Locally saved files can be imported into the Workspace for use by the user or other individuals. The first step in importing a document into the Workspace is to logon to the Workspace and browse the Explore window to the area of interest. Once a folder has been selected, the Import can be initiated by selecting the File menu, highlighting Import, and selecting the File menu option. The import is also commonly initiated by right-clicking inside the folder of the Workspace, highlighting Import, and selecting the File option as shown in the following screenshot:
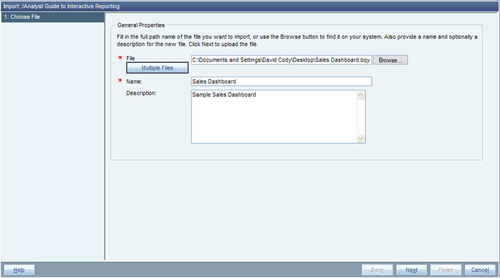
Once the file import option has been selected, the Import window appears inside the Workspace, as shown in the following screenshot. The first step in importing a document into the Workspace is to select the file to import.
Note
The Multiple Files button cannot be used for Interactive Reporting documents. Interactive Reporting documents must be imported one file at a time.
Use the Browse button to select the Interactive Reporting (BQY) file of interest. Once the file has been selected, the path to the document will be shown in the File box and the Name field will be populated with the filename. The filename may be edited at this time or can be changed at any time by editing the file properties:
Once the file has been selected and the name has been set, click on the Next button at the bottom of the screen to continue. The next screenshot shows the next step in the file import process.
Note
Notice the left menu of the Import window. The Import module has identified the file type as an Interactive Reporting document and shows the four steps necessary to complete the import of this file type.
The second step in the import process is to set the connection file for the data model. The connection files are called OCE files, or Interactive Reporting Database Connection files (previously called Open Catalogue Extension files). These OCE files contain the information needed for the document to make a connection to the database to run a query. Each Query/DataModel in the document is displayed to allow for the selection of a connection file in the import.
Note
A connection file does not need to be set to any of the Query sections to import a file to the Workspace. The connection files are only needed to allow the document to process and refresh data from a data source. It is acceptable to leave the connections blank if the desired intent is not to process the document.
The first step in setting the connection file is to select the connection file of interest from the Connection drop-down box.
Note
The connection files shown in the Connection drop-down box are configured by system administrators and permissions are set to users/groups. Environments may be setup to not show any connection files in this drop-down box, thus preventing the user from setting a connection to the document.
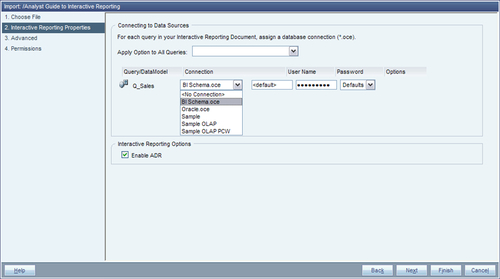
Typically, connection files are well organized and set with well defined names to provide the user with adequate information to make a selection. Once the preferred connection files are set to the document, a few different options can be set to configure the username and password for the document. Each authentication method can be set individually for each query or the same option can be applied for all queries using the Apply Option to All Queries drop-down box at the top of the screen.
Three options exist for entering the password for the connection file. In most cases, the Use Default User Name & Password option from the Apply Option to All Queries drop-down is used to set the username and password. This option uses the username and password stored in the connection file when it was imported into the Workspace (if configured). The other options require the user to know the database username and password. The Prompt option prompts the user for the username and password when the document attempts to connect or reconnect to a database during use. The final option is the blank option in the Options drop-down menu or is named Specify Now in the Apply Option to All Queries menu. This option requires the user to input the username and password into the User Name and Password boxes on the screen.
Once the connection files have been configured, click on the Next button at the bottom of the screen to proceed to the Advanced options configuration:
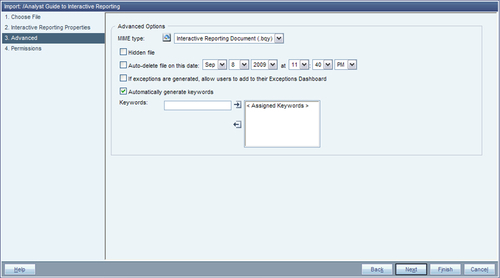
The Advanced page shown in the previous screenshot contains the ability to change the file type, make the file hidden, set an auto delete date, leverage exceptions, and manually or automatically generate keywords. Most users skip the advanced settings, but users may be interested in setting an auto-delete date or hiding the file. Users can view hidden files by selecting the Show Hidden item from the View menu in the Explore window. After configuring or electing not to configure any of the advanced settings, click on the Next button at the bottom of the screen to move to the final step.
The following screenshot shows the Permissions configuration, the final step in importing an Interactive Reporting document:
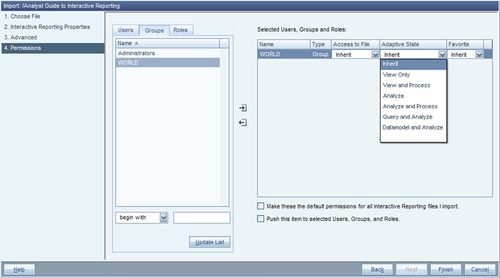
Understanding the Permissions interface and settings is the key to correctly configuring the permissions for the document. The window on the left is used to search for users, groups, or roles to be set to the document. The window on the right shows the users, groups, and roles that have been selected, and the buttons in the middle are used to add or remove users, groups, and roles from the assignment window. Once items have been added to the assignment window, the user, group, or role is given access to the file and an adaptive state. Access to File controls the ability the user/group/role has to edit the document and includes the following properties:
The Inherit selection is used to not specify access for that particular user / group / role. This selection should be used when the user/group/role is contained in another user or group that is also selected to the document.
Selecting No Access prevents the selected user/group/role from accessing the document.
The View selection provides the user/group/role with the ability to view the document but not modify or save changes.
The Modify selection provides the user/group/role with the ability to modify the file and document properties, but not to configure permissions or delete the file.
The Full Control selection provides full access to the document properties including the ability to provision the document to other users.
The Adaptive State controls the level of access within the Interactive Reporting document and includes the following settings:
The Inherit property behaves similarly to the file access Inherit property, where the selection is used to not provide a specific type of restriction to the document. This selection should be used when the user/group/role is contained in another user or group that is also selected to the document.
The View Only property provides the user/group/role with the ability to view but not modify, process, or conduct analysis in the document.
The View and Process property is similar to the View Only property, but the query sections in the document can be processed to refresh the document data.
The Analyze property allows for the modification of the reporting sections in the document but does not contain the ability to process the document.
The Analyze and Process property is similar to the Analyze property but allows the document to be processed and refreshed with data.
The Query and Analyze property allows the user to have full access to the document sections including the ability to modify and process queries. This property does not allow the ability to edit any DataModel sections.
The DataModel and Analyze selection provides full access to every section of the document.
To perform a simple permission configuration, select the User or Group tab from the Permissions interface. Search for the item of interest by using the textbox and Update List button. Once the desired item is shown in the window, highlight the item and click the button in the middle with the arrow to the right in order to move the item into the assignment window. Finally, use the drop-down menus to set the Access to the File and the Adaptive State of the document.
Note
Configuring permissions can become complex based on multiple users, groups, and role assignments coupled with the ability to set independent file access and adaptive state for each item.
The last step in the import process is to click on the Finish button at the bottom of the screen. Once completed, the Import window will disappear and the Explore window will become active showing the newly imported document.
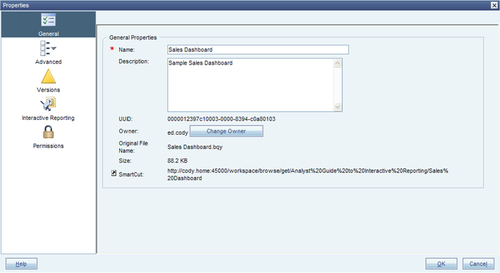
After files are posted to the Workspace, files can be edited to change file permissions, to change database connection files, to change file attributes, and to post new versions of the document. To change the file properties in the Workspace, right-click on the file and select Properties. The Properties window appears and displays the General Properties as shown in the following screenshot:
The navigation to other options is displayed on the left side of the window, where the different buttons can be clicked to bring up the different file properties. The Permissions, Advanced, and Interactive Reporting properties (database connection) screens mimic the screens shown during the importing of a file, and the settings saved from the most recent edit of the file properties will be populated in each section.
The General Properties window is used to change the Name, Description, and Owner of the file. Also included in this section is the SmartCut, the URL to the document that can be pasted into a web browser or sent in an e-mail. The SmartCut changes with modifications to the file path or the filename, and the default URL opens the file in the HTML view of the document.
Note
To open a SmartCut in the Interactive Reporting Web Client, add a ?bqtype=plugin to the end of the URL.
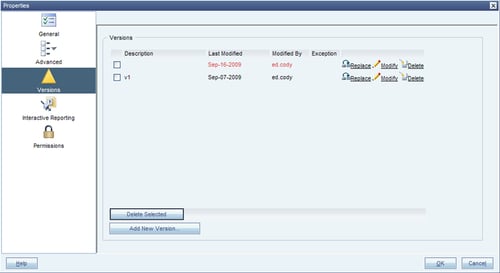
The Versions tab can also be used to manage file versions. As versions are added, additional rows are added to the Versions window as shown in the following screenshot. To post an updated file to one of the versions, click on the Replace button next to the version of interest. To add a new version to the file, click on the Add New Version button at the bottom-left of the window. Click on the Modify link to update the connection or general version properties, and click on the Delete button to remove a version:
The focus of this chapter was to provide the business analyst with an overview of Interactive Reporting and the EPM Workspace. This chapter began with an introduction to the EPM Workspace providing login, navigation, and details for accessing documents. The chapter continued with an in-depth explanation of the different features of Interactive Reporting Web Client, including the layout, sections, menus, toolbars, and other key tool attributes necessary to understanding and successfully leveraging the full capabilities of the software. The chapter continued with an overview of saving documents, save options, and opening documents from both the Workspace and the local machine. The chapter concluded with importing and editing documents in the Workspace, including configuring database connections as well as provisioning users and groups to the document.
