Download code from GitHub
An Introduction to Streamlit
Streamlit is the fastest way to make data apps. It is an open-source Python library that helps you build web applications to be used for sharing analytical results, building complex interactive experiences, and iterating on top of new machine learning models. On top of that, developing and deploying Streamlit apps is incredibly fast and flexible, often reducing the application development time from days to hours.
In this chapter, we will start out with the Streamlit basics. We will learn how to download and run demo Streamlit apps, how to edit demo apps using our own text editor, how to organize our Streamlit apps, and finally, how to make our very own apps. Then, we will explore the basics of data visualization in Streamlit. We will learn how to accept some initial user input, and then add some finishing touches to our own apps with text. By the end of this chapter, you should be comfortable with starting to make your own Streamlit apps!
In particular, we will cover the following topics:
- Why Streamlit?
- Installing Streamlit
- Organizing Streamlit apps
- Streamlit plotting demo
- Making an app from scratch
Before we begin, we will start with the technical requirements to make sure we have everything we need to get started.
Technical requirements
Here are the installations and setup required for this chapter:
- The requirements for this book are to have Python 3.9 (or later) downloaded (https://www.python.org/downloads/) and have a text editor to edit Python files in. Any text editor will do. I use VS Code (https://code.visualstudio.com/download).
- Some sections of this book use GitHub, and a GitHub account is recommended (https://github.com/join). Understanding how to use Git is not necessary for this book but is always useful. If you want to get started, this link has a useful tutorial: https://guides.github.com/activities/hello-world/.
- A basic understanding of Python is also very useful for this book. If you are not there yet, feel free to spend some time getting to know Python better using this tutorial (https://docs.python.org/3/tutorial/) or any other of the freely and readily available tutorials out there, and come back here when you are ready. We also need to have the Streamlit library installed, which we will do in a later section called Installing Streamlit.
Why Streamlit?
Data scientists have become an increasingly valuable resource for companies and nonprofits over the course of the past decade. They help make data-driven decisions, make processes more efficient, and implement machine learning models to improve these decisions at scale. One pain point for data scientists is the process just after they have found a new insight or made a new model. What is the best way to show a dynamic result, a new model, or a complicated piece of analytics to a data scientist’s colleagues? They can send a static visualization, which works in some cases but fails for complicated analyses that build on each other or on anything that requires user input. They can create a Word document (or export their Jupyter notebook as a document) that combines text and visualizations, which also doesn’t incorporate user input and makes reproducible results much harder. Another option still is to build out an entire web application from scratch using a framework such as Flask or Django, and then figure out how to deploy the entire app in AWS or another cloud provider.
None of these options really work that well. Many are slow, don’t take user input, or are suboptimal for informing the decision-making process so fundamental to data science.
Enter Streamlit. Streamlit is all about speed and interaction. It is a web application framework that helps you build and develop Python web applications. It has built-in and convenient methods for everything from taking in user inputs like text and dates to showing interactive graphs using the most popular and powerful Python graphing libraries.
I have spent the past two years building Streamlit apps of all different flavors, from data projects for my personal portfolio to building quick applications for data science take-home problems to even building mini-apps for repeatable analysis at work. When I started this journey, I worked at Meta (then Facebook), but after the first edition of this book was published, I loved working on Streamlit apps so much that I went to work for the Streamlit team. Soon after I moved over, the Data Cloud company Snowflake purchased Streamlit. None of this is book is sponsored by Snowflake, and I certainly do not speak for Snowflake, but I truly believe that Streamlit could be as valuable to you and your work as it has been to mine.
I wrote this book to bring you quickly up to speed so you can accelerate your learning curve and get to building web applications in minutes and hours instead of days. If this is for you, read on!
We will work in three sections, starting with an introduction to Streamlit, and ramping you up to building your own basic Streamlit applications. In Part 2, we’ll extend this knowledge to more advanced topics such as production deployment methods and using Components created by the Streamlit community for increasingly beautiful and usable Streamlit apps. And in the last part, we’ll focus heavily on interviews with power users who use Streamlit at work, in academia, and for learning data science techniques. Before we begin, we need to get Streamlit set up and discuss how this book’s examples will be structured.
Installing Streamlit
In order to run any Streamlit apps, you must first install Streamlit. I’ve used a package manager called pip to do this, but you can install it using any package manager you choose (for example, brew). This book uses Streamlit version 1.13.0 and Python 3.9, but it should work on newer versions as well.
Throughout this book, we’ll be using a mix of both terminal commands and code written in Python scripts. We will signpost in which location to run the code to make this as clear as possible. To install Streamlit, run the following code in a terminal:
pip install streamlit
Now that we have Streamlit downloaded, we can call it directly from our command line using the preceding code to kick off Streamlit’s demo using the following:
streamlit hello
Take some time to explore Streamlit’s demo and take a glance at any code that you find interesting! We’re going to borrow and edit the code behind the plotting demo, which illustrates a combination of plotting and animation with Streamlit. Before we dive in, let’s take a second and talk about how to organize Streamlit apps.
Organizing Streamlit apps
Each Streamlit app we create in this book should be contained in its own folder. It is tempting to create new files for each Streamlit app, but this promotes a bad habit that will bite us later when we talk about deploying Streamlit apps and deal with permissions and data for Streamlit.
I would recommend that you have a dedicated individual folder that will house all the apps you’ll create throughout this book. I have named mine streamlit_apps. The following command will make a new folder called streamlit_apps and make it our current working directory:
mkdir streamlit_apps
cd streamlit_apps
All the code for this book is housed at https://github.com/tylerjrichards/Getting-Started-with-Streamlit-for-Data-Science, but I would highly recommend coding by hand for practice. Later in this book, we’ll talk about how to create multi-page apps, which essentially allow us to have many mini-data apps within our central monoapp. Ensuring that our Streamlit apps are well organized will help us with that!
Streamlit plotting demo
First, we’re going to start to learn how to make Streamlit apps by reproducing the plotting demo we saw before in the Streamlit demo with a Python file that we’ve made ourselves. In order to do that, we will do the following:
- Make a Python file where we will house all our Streamlit code.
- Use the plotting code given in the demo.
- Make small edits for practice.
- Run our file locally.
Our first step is to create a folder called plotting_app, which will house our first example. The following code makes this folder when run in the terminal, changes our working directory to plotting_app, and creates an empty Python file we’ll call plot_demo.py:
mkdir plotting_app
cd plotting_app
touch plot_demo.py
Now that we’ve made a file called plot_demo.py, open it with any text editor (if you don’t have one already, I’m partial to VS Code (https://code.visualstudio.com/download)). When you open it up, copy and paste the following code in to your plot_demo.py file:
import streamlit as st
import time
import numpy as np
progress_bar = st.sidebar.progress(0)
status_text = st.sidebar.empty()
last_rows = np.random.randn(1, 1)
chart = st.line_chart(last_rows)
for i in range(1, 101):
    new_rows = last_rows[-1, :] + np.random.randn(5, 1).cumsum(axis=0)
    status_text.text("%i%% Complete" % i)
    chart.add_rows(new_rows)
    progress_bar.progress(i)
    last_rows = new_rows
    time.sleep(0.05)
progress_bar.empty()
# Streamlit widgets automatically run the script from top to bottom. Since
# this button is not connected to any other logic, it just causes a plain
# rerun.
st.button("Re-run")
This code does a few things. First, it imports all the libraries needed and creates a line chart in Streamlit’s native graphing framework that starts at a random number sampled from a normal distribution with mean 0 and variance 1. And then it runs a for loop that keeps sampling new random numbers in bunches of 5 and adding that to the sum we had before while waiting for a twentieth of a second so we can see the graph change, simulating an animation.
By the end of this book, you will be able to make apps like this extremely quickly. But for now, let’s run this locally by typing the following code in our terminal:
streamlit run plot_demo.py
This should open a new tab with your app in your default web browser. We should see our app run as shown in the following figure. Your app will not show this exact line, as random numbers are being generated during each run, but other than that, the app should look the same!
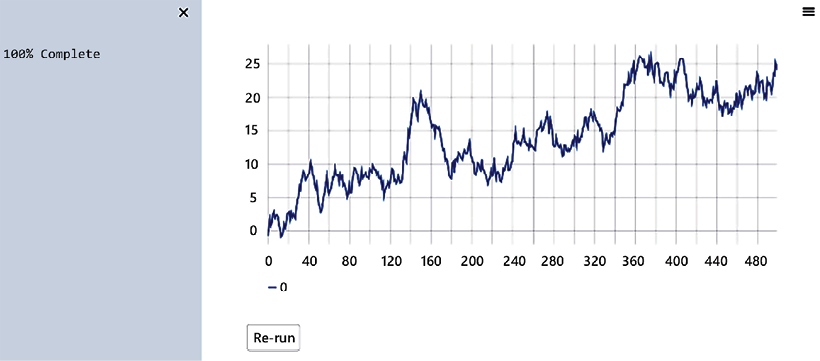
Figure 1.1: Plotting demo output
This is how we will run every Streamlit app, by first calling streamlit run and then pointing Streamlit toward the Python script that houses our app’s code. Now let’s change something small within the app so we better understand how Streamlit works. The following code changes how many random numbers we plot on our graph, but feel free to make any changes you’d like. Make your changes using the following code, save your changes in your text editor of choice, and run the file again:
import streamlit as st
import time
import numpy as np
progress_bar = st.sidebar.progress(0)
status_text = st.sidebar.empty()
last_rows = np.random.randn(1, 1)
chart = st.line_chart(last_rows)
for i in range(1, 101):
    new_rows = last_rows[-1, :] + np.random.randn(50, 1).cumsum(axis=0)
    status_text.text("%i%% Complete" % i)
    chart.add_rows(new_rows)
    progress_bar.progress(i)
    last_rows = new_rows
    time.sleep(0.05)
progress_bar.empty()
# Streamlit widgets automatically run the script from top to bottom. Since
# this button is not connected to any other logic, it just causes a plain
# rerun.
st.button("Re-run")
You should notice that Streamlit detected a change to the source file and is prompting you to rerun the file if you’d like. Click Rerun (or Always rerun if you want this behavior to be the default, which I almost always do), and watch your app change.
Feel free to try making some other changes to the plotting app to get the hang of it! Once you are ready, let’s move on to making our own apps.
Making an app from scratch
Now that we’ve tried out the apps others have made, let’s make our own! This app is going to focus on using the central limit theorem, which is a fundamental theorem of statistics that says that if we randomly sample with replacement enough from any distribution, then the distribution of the mean of our samples will approximate the normal distribution.
We are not going to prove this with our app, but instead, let’s try to generate a few graphs that help explain the power of the central limit theorem. First, let’s make sure that we’re in the correct directory (in this case, the streamlit_apps folder that we created earlier), make a new folder called clt_app, and toss in a new file.
The following code makes a new folder called clt_app, and again creates an empty Python file, this time called clt_demo.py:
mkdir clt_app
cd clt_app
touch clt_demo.py
Whenever we start a new Streamlit app, we want to make sure to import Streamlit (often aliased in this book and elsewhere as st). Streamlit has unique functions for each type of content (text, graphs, pictures, and other media) that we can use as building blocks for all of our apps. The first one we’ll use is st.write(), which is a function that takes a string (and as we’ll see later, almost any Pythonic object, such as a dictionary) and writes it directly into our web app in the order that it is called. As we are calling a Python script, Streamlit sequentially looks through the file and, every time it sees one of the functions, designates a sequential slot for that piece of content. This makes it very easy to use, as you can write all the Python you’d like, and when you want something to appear on the app you’ve made, you can simply use st.write() and you’re all set.
In our clt_demo.py file, we can start with the basic 'Hello World' output using st.write(), using the following code:
import streamlit as st
st.write('Hello World')
Now we can test this by running the following code in the terminal:
streamlit run clt_demo.py
We should see the string 'Hello World' printed on our app, so all is good so far. The following figure is a screenshot of our app in Safari:
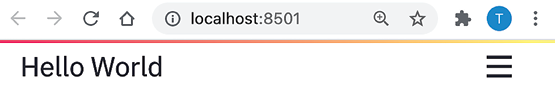
Figure 1.2: Hello World app
There are three items to note in this screenshot. First, we see the string as we wrote it, which is great. Next, we see that the URL points to localhost:8501, which is just telling us that we’re hosting this locally (that is, it’s not on the internet anywhere) through port 8501. We don’t need to understand almost anything about the port system on computers, or the Transmission Control Protocol (TCP). The important thing here is that this app is local to your computer. Later in this book, we’ll learn how to take the local apps we create and share them with anyone via a link! The third important item to note is the hamburger icon at the top right. The following screenshot shows us what happens when we click the icon:
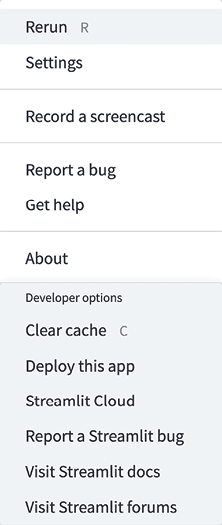
Figure 1.3: Icon options
This is the default options panel for Streamlit apps. Throughout this book, we’ll discuss each of these options in depth, especially the non-self-explanatory ones such as Clear cache. All we have to know for now is that if we want to rerun the app or find settings or the documentation, we can use this icon to find almost whatever we need.
When we host applications so that others can use them, they’ll see this same icon but have some different options (for example, users will not be able to clear the cache). We’ll discuss this in greater detail later as well. Now back to our central limit theorem app!
The next step is going to be generating a distribution that we want to sample from with replacement. I’m choosing the binomial here. We can read the following code as simulating 1,000 coin flips using the Python package NumPy, and printing out the mean number of heads from those 1,000 coin flips:
import streamlit as st
import numpy as np
binom_dist = np.random.binomial(1, .5, 100)
st.write(np.mean(binom_dist))
Now, given what we know about the central limit theorem, we would expect that if we sampled from binom_dist enough times, the mean of those samples would approximate the normal distribution.
We’ve already discussed the st.write() function. Our next foray into writing content to the Streamlit app is through graphs. st.pyplot() is a function that lets us use all the power of the popular matplotlib library and push our matplotlib graph to Streamlit. Once we create a figure in matplotlib, we can explicitly tell Streamlit to write that to our app with the st.pyplot() function. So, all together now! This app simulates 1,000 coin flips and stores those values in a list we call binom_dist. We then sample (with replacement) 100 from that list, take the mean, and store that mean in the cleverly named variable list_of_means. We do that 1,000 times (which is overkill – we could do this even with dozens of samples), and then plot the histogram. After we do this, the result of the following code should show a bell-shaped distribution:
import streamlit as st
import numpy as np
import matplotlib.pyplot as plt
binom_dist = np.random.binomial(1, .5, 1000)
list_of_means = []
for i in range(0, 1000):
     list_of_means.append(np.random.choice(binom_dist, 100, replace=True).mean())
fig, ax = plt.subplots()
ax = plt.hist(list_of_means)
st.pyplot(fig)
Each run of this app will create a new bell curve. When I ran it, my bell curve looked like the following figure. If your graph isn’t exactly what you see in the next figure (but is still a bell!), that’s totally fine because of the random sampling used in our code:
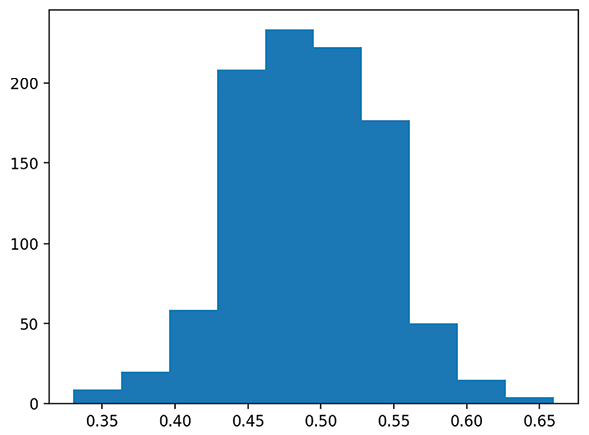
Figure 1.4: Bell curve
As you probably noticed, we first created an empty figure and empty axes for that figure by calling plt.subplots(), and then assigned the histogram we created to the ax variable. Because of this, we were able to explicitly tell Streamlit to show the figure in our Streamlit app.
This is an important step, as in Streamlit versions, we can also skip this step, not assign our histogram to any variable, and then call st.pyplot() directly afterward. The following code takes this approach:
import streamlit as st
import numpy as np
import matplotlib.pyplot as plt
binom_dist = np.random.binomial(1, .5, 1000)
list_of_means = []
for i in range(0, 1000):
     list_of_means.append(np.random.choice(binom_dist, 100, replace=True).mean())
plt.hist(list_of_means)
st.pyplot()
I don’t recommend this method, as it can give you some unexpected results. Take this example, where we want to first make our histogram of means, and then make another histogram of a new list filled only with the number 1.
Take a second and guess what the following code would do. How many graphs would we get? What would the output be?
import streamlit as st
import numpy as np
import matplotlib.pyplot as plt
binom_dist = np.random.binomial(1, .5, 1000)
list_of_means = []
for i in range(0, 1000):
     list_of_means.append(np.random.choice(binom_dist, 100, replace=True).mean())
plt.hist(list_of_means)
st.pyplot()
plt.hist([1,1,1,1])
st.pyplot()
I would expect this to show two histograms, the first one of list_of_means, and the second one of the lists of 1s:
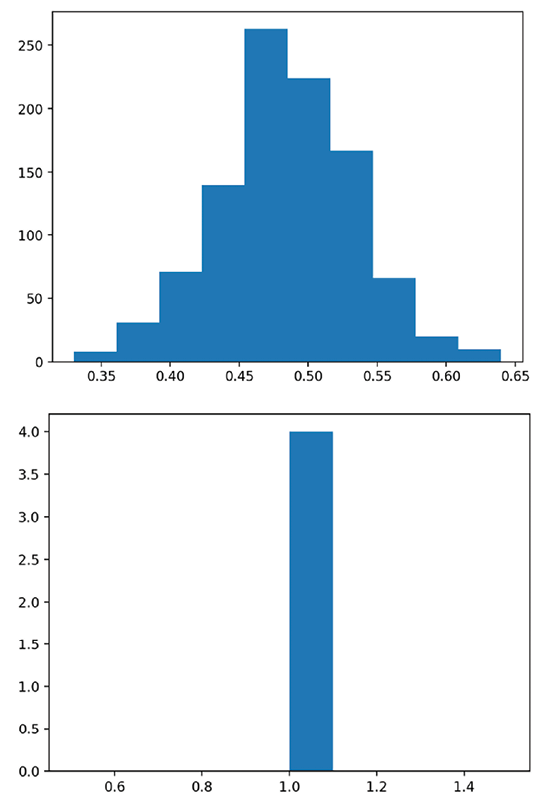
Figure 1.5: A tale of two histograms
What we actually get is different! The second histogram has data from the first and the second list! When we call plt.hist() without assigning the output to anything, matplotlib tacks the new histogram onto the old graph, which is stored globally, and Streamlit pushes that new one to our app. You may also get a PyplotGlobalUseWarning when you run the preceding code, depending on your matplotlib version. Don’t worry, we will fix this in the next section!
Here’s a solution to this issue. If we instead explicitly created two graphs, we could call the st.pyplot() function wherever we liked after the graph was generated, and have greater control over where exactly our graphs were placed. The following code separates the two graphs explicitly:
import streamlit as st
import numpy as np
import matplotlib.pyplot as plt
binom_dist = np.random.binomial(1, .5, 1000)
list_of_means = []
for i in range(0, 1000):
     list_of_means.append(np.random.choice(binom_dist, 100, replace=True).mean())
fig1, ax1 = plt.subplots()
ax1 = plt.hist(list_of_means)
st.pyplot(fig1)
fig2, ax2 = plt.subplots()
ax2 = plt.hist([1,1,1,1])
st.pyplot(fig2)
The preceding code plots both histograms separately by first defining separate variables for each figure and axis using plt.subplots() and then assigning the histogram to the appropriate axis. After this, we can call st.pyplot() using the created figure, which produces the following app:
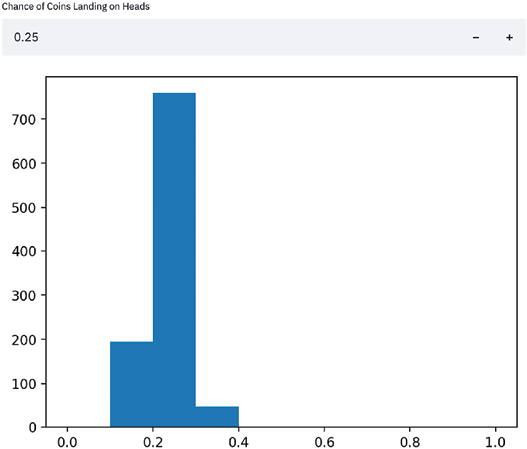
Figure 1.6: Fixed histograms
We can clearly see in the preceding figure that the two histograms are now separated, which is the desired behavior. We will very often plot multiple visualizations in Streamlit and will use this method for the rest of the book.
Matplotlib is an extremely popular library for data visualization but has some serious flaws when used within data apps. It is not interactive by default, it is not particularly pretty, and it also can slow down very large apps. Later in this book, we’ll switch over to more performant and interactive libraries.
Now, on to accepting user input!
Using user input in Streamlit apps
As of now, our app is just a fancy way to show our visualizations. But most web apps take some user input or are dynamic, not static visualizations. Luckily for us, Streamlit has many functions for accepting inputs from users, all differentiated by the object that we want to input. There are freeform text inputs with st.text_input(); radio buttons, st.radio(); numeric inputs with st.number_input(); and a dozen more that are extremely helpful for making Streamlit apps. We will explore most of them in detail throughout this book, but we’ll start with numeric input.
From the previous example, we assumed that the coins we were flipping were fair coins and had a 50/50 chance of being heads or tails. Let’s let the user decide what the percentage chance of heads is, assign that to a variable, and use that as an input in our binomial distribution. The number input function takes a label, a minimum and maximum value, and a default value, which I have filled in the following code:
import streamlit as st
import numpy as np
import matplotlib.pyplot as plt
perc_heads = st.number_input(label = 'Chance of Coins Landing on Heads', min_value = 0.0, max_value = 1.0, value = .5)
binom_dist = np.random.binomial(1, perc_heads, 1000)
list_of_means = []
for i in range(0, 1000):
     list_of_means.append(np.random.choice(binom_dist, 100, replace=True).mean())
fig, ax = plt.subplots()
ax = plt.hist(list_of_means, range=[0,1])
st.pyplot(fig)
The preceding code uses the st.number_input() function to collect our percentage, assigns the user input to a variable (perc_heads), then uses that variable to change the inputs to the binomial distribution function that we used before. It also sets our histogram’s x axis to always be between 0 and 1, so we can better notice changes as our input changes. Try and play around with this app for a bit; change the number input and notice how the app responds whenever a user input is changed. For example, here is a result from when we set the numeric input to .25:
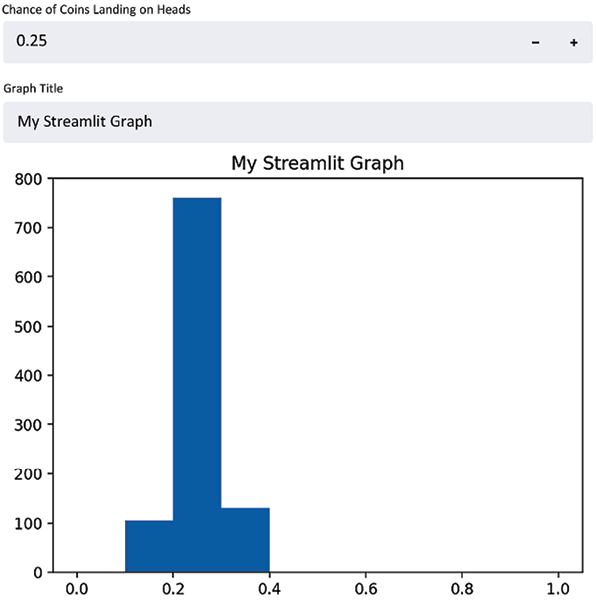
Figure 1.7: An example of a result from when we set the numeric input to .25
As you probably noticed, every time that we changed the input of our script, Streamlit re-ran the entire application. This is the default behavior and is very important to understanding Streamlit performance; we will explore a few ways that allow us to change this default later in the book, such as adding caching or forms! We can also accept text input in Streamlit using the st.text_input() function, just as we did with the numeric input. The next bit of code takes a text input and assigns it to the title of our graph:
import streamlit as st
import numpy as np
import matplotlib.pyplot as plt
perc_heads = st.number_input(label='Chance of Coins Landing on Heads', min_value=0.0,  max_value=1.0, value=.5)
graph_title = st.text_input(label='Graph Title')
binom_dist = np.random.binomial(1, perc_heads, 1000)
list_of_means = []
for i in range(0, 1000):
list_of_means.append(np.random.choice(binom_dist, 100, replace=True).mean())
fig, ax = plt.subplots()
plt.hist(list_of_means, range=[0,1])
plt.title(graph_title)
st.pyplot(fig)
This creates a Streamlit app with two inputs, both a numeric input and a text input, and uses them both to change our Streamlit app. Finally, this results in a Streamlit app that looks like the next figure, with dynamic titles and probabilities:
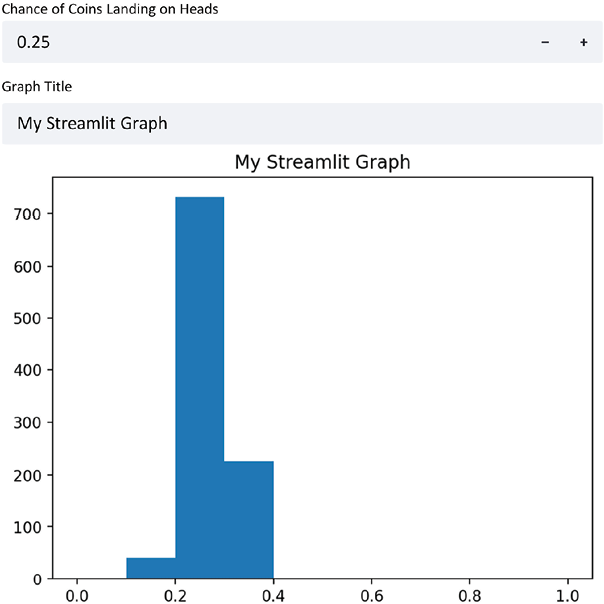
Figure 1.8: A Streamlit app with dynamic titles and probabilities
Now that we have worked a bit with user input, let’s talk about text and Streamlit apps more deeply.
Finishing touches – adding text to Streamlit
Our app is functional, but it is missing a lot of nice touches. We talked earlier about the st.write() function, which the Streamlit docs call the Swiss Army knife of Streamlit commands. Almost whatever we wrap st.write() around will work by default and it should be our go-to function if we’re not sure of the best path forward.
Other than st.write(), we also can utilize other built-in functions that format our text for us, such as st.title(), st.header(), st.markdown(), and st.subheader(). Using these five functions helps to format text in our Streamlit apps easily and keeps sizing consistent for bigger apps.
More specifically, st.title() will place a large block of text in our app, st.header() uses a slightly smaller font than st.title(), and st.subheader() uses an even smaller one. Other than those three, st.markdown() will allow anyone already familiar with Markdown to use the popular markup language in our Streamlit apps. Let’s try a couple of them in the following code:
import streamlit as st
import numpy as np
import matplotlib.pyplot as plt
st.title('Illustrating the Central Limit Theorem with Streamlit')
st.subheader('An App by Tyler Richards')
st.write(('This app simulates a thousand coin flips using the chance of heads input below,'
     'and then samples with replacement from that population and plots the histogram of the'
     ' means of the samples in order to illustrate the central limit theorem!'))
perc_heads = st.number_input(
    label='Chance of Coins Landing on Heads', min_value=0.0, max_value=1.0, value=.5)
binom_dist = np.random.binomial(1, perc_heads, 1000)
list_of_means = []
for i in range(0, 1000):
    list_of_means.append(np.random.choice(
        binom_dist, 100, replace=True).mean())
fig, ax = plt.subplots()
ax = plt.hist(list_of_means)
st.pyplot(fig)
The preceding code adds a large title (st.title()), adds a smaller subheader below (st.subheader()), and then adds some even smaller text below the subheader (st.write()). We also separated the long string of text in the preceding code block into three smaller strings for readability and to make it easier to edit in our text editor. It should look like the following screenshot. Note that because we are using randomly generated data for this histogram, it is OK (and expected!) if your histogram looks slightly different:

Figure 1.9: The central limit theorem application
And that concludes our illustration of the central limit theorem. Go ahead and try out the other options that Streamlit has for writing text (like st.markdown(), which interprets and writes Markdown-style text in your Streamlit app) to further explore app creation.
Summary
In this chapter, we started by learning how to organize our files and folders for the remainder of this book and quickly moved on to instructions for downloading Streamlit. We then built our first Streamlit application, Hello World, and learned how to run our Streamlit applications locally. Then, we started building out a more complicated application to show the implications of the central limit theorem from the ground up, going from a simple histogram to accepting user input and formatting different types of text within our app for clarity and beautification.
By now, you should be comfortable with subjects such as basic data visualization, editing Streamlit apps in a text editor, and locally running Streamlit apps. We’re going to dive more deeply into data manipulation in our next chapter.
Learn more on Discord
To join the Discord community for this book – where you can share feedback, ask questions to the author, and learn about new releases – follow the QR code below: