


 Download code from GitHub
In the previous century, the Vienna University of Technology in Vienna enrolled a bachelor study called data engineering and statistics. Basically the content was perfectly related to the nowadays commonly-used term data science. Data-oriented lectures in the area of computer science, such as storing and retrieving data, programming, and data security, were in the curriculum, together with applied lectures on statistics, such as multivariate statistics, biostatistics, financial statistics, statistical learning, and official statistics. We had too few students and after a few years the course was canceled. 16 years later, the picture completely changed. New bachelors and masters courses on data science have been developed everywhere in the world over the last few years. Universities have found that they must offer studies on data science, because the industry needs experts on it, but also developments in statistics in recent years have almost exclusively come from an area called computational statistics. Statistics is the original form of computing data, and computational statistics takes this to an extreme where methods and tools are developed in a highly data-dependent manner, using and developing modern computational tools. Computational statistics and data science are closely related. Computational statistics covers a broad swathe of data science, exclusive data management, and data security issues. Computational statistics (and therefore also data science) has become very popular since the eighties, and it is very likely the most influential area of statistics nowadays. In the field of computational statistics, not only is new methodology developed, but it is also implemented in software – nowadays almost exclusively in the old but modern software environment R.
Data science seems like a good term when your work is driven by data with a less strong component on method and algorithm development than computational statistics, but with a lot of pure computer science topics related to storing, retrieving, and handling data sets. It also differs from computational statistics in various aspects. For example, in the area of data visualization also pure process-related visualizations (airflows in an engine, for example) are a topic in data science but not in computational statistics.
Wikipedia defines data science as a field that:
"incorporates varying elements and builds on techniques and theories from many fields, including math, statistics, data engineering, pattern recognition and learning, advanced computing, visualization, uncertainty modeling, data warehousing, and high performance computing with the goal of extracting meaning from data and creating data products."
Data science is the management of the entire modeling process, from data collection, storage and managing data, data pre-processing (editing, imputation), data analysis, and modeling, to automatized reporting and presenting the results, all in a reproducible manner. It is thus also an interdisciplinary study to extract meaning from data with statistics, by using a lot of elements in computer science, as well as general subject-matter skills. In that sense, data science is an extension and continuation of statistics. Data scientists use statistics and data-oriented computer science tools to solve the problems they face.
Statistical simulation is an essential area in data science. The core issues of this book are simulating distributions and data sets, Monte Carlo methods for inference statistics, and presenting solutions on computer-intense approaches. This book discusses various areas in statistical simulation, random number simulation, resampling, Monte Carlo methods, statistical theory explained by simulation experiments, agent-based microsimulation, and system dynamics. The aim is to put a book into the hands of readers that explains methods, gives advice on the use of those methods, and provides computational tools to solve common problems in statistical simulation and computer-intense methods.
In this book, the theory is not just explained. The theory is also made understandable with illustrative examples using the R software environment. The reader will get to grips with the R software environment. After getting the background on popular methods in the field, readers will see applications in R to better understand the methods, as well as to gain experience when working on real-world data and real-world problems.
R itself is perfectly suited to carry out simulations. It should be mentioned that the basics of R are not the topic of the book, but advanced data manipulation and advanced visualization tools are shown in R. The reader should therefore not be a complete newbie in R, and if so, should first read a very basic introduction to R.
Readers will get a brief overview of the problems and possibilities of data-driven simulation and resampling methods.
Statistical simulation is a numerical method for conducting experiments on a computer in order to solve mathematical problems in a data-driven manner.
Each experiment is carried out in two steps:
Drawing a random outcome.
The subsequent application of an estimation function to the drawn data.
Random draws are made by means of simulating random numbers, such as the numbers produced by a chosen random number generator.
Simulation is applied in different ways. It is applied in sampling to gather information about a random object by observing many realizations of it (Kroese et al., 2014).
As computational power keeps increasing, and new methods and algorithms are being developed, opportunities present themselves to not only conduct innovative research, but also to design better social and economic policies and programs through micro-simulation and agent-based modeling, where states change over time according to defined transition probabilities. Another example is the area of system dynamics, which describes the interaction of populations or individuals. Both topics are part of Chapter 11, System Dynamics and Agent-Based Models.
With simulation experiments, one can even show the concepts of probability theory and the basic theorems of statistics. The (weak and strong) law of large numbers can be explained. We may repeatedly do some experiments with related probability mechanisms. The outcomes of these experiments are random – random events have outcomes that are not known with certainty, but in the long run we know the properties. To toss coins is the simplest example. The most fundamental theorem in mathematical statistics, the central limit theorem, can also be shown by simulation. Using simulation experiments, readers will be able to fully understand this important theorem, while the proof with mathematics needs very detailed knowledge of mass and probability theory. More information on simulation to show the basics in statistics is provided in Chapter 6, Probability Theory Shown by Simulation.
Statistical simulation is also used to show the properties of an estimation method regarding different conditions. One example is the question of how an estimator behaves under different kinds of missing values pattern, or how outliers may corrupt the estimator. When samples have been drawn with complex sampling designs from finite populations, the influence of the sampling design on the estimator of interest can be shown with design-based simulations. Both model-based simulation and design-based simulation are shown in Chapter 10, Simulation with Complex Data. How data might be simulated for different kind of problems is also discussed. This covers the high-dimensional data and complex synthetic populations needed for design-based simulations.
Usually, when statisticians talk about simulations, they mean Monte Carlo simulations. The Monte Carlo simulation method uses repeated random sampling to mimic the null hypothesis or simulate data from a model where an estimation function is applied to the simulated data.
The Monte Carlo simulation approach is also essential in Bayesian statistics, where Markov chain Monte Carlo (MCMC) methods are used to sample parameter values from a posterior distribution (see also Kroese et al., 2014). This will be intensively discussed in Chapter 4, Simulation of Random Numbers. Generally, it is crucial to have an excellent random number generator at hand that allows you to simulate uniformly distributed values. Additionally, it is crucial to transform a uniform distribution into a distribution of interest. We can do this with inversion, rejection sampling, or MCMC methods; see also Chapter 4, Simulation of Random Numbers.
The Monte Carlo simulation approach is also central to estimating certain numerical quantities in general, but especially to estimate statistical uncertainty. It turns out (Chapter 6, Probability Theory Shown by Simulation) that almost no mathematics is used to express the statistical uncertainty for any complex estimator. The Monte Carlo simulation method is a data-driven and computational tool. It is the perfect tool for data scientists to make statistical inferences without getting lost in the world of mathematics.
Another application of Monte Carlo simulation is multi-dimensional integrals, which can be solved via Monte Carlo techniques, typically by drawing random numbers out of an interval at which the integral is defined. Closely related to this is numerical optimization. Here, the Monte Carlo approach can be used to first solve optimization problems with complicated objective functions using a stochastic approach. The aim to introduce randomness is to avoid to converge / trap into a local optima when searching for an optima in non-convex (or non-concave) optimization functions, (more on this in Chapter 5, Monte Carlo Methods for Optimization Problems).
The great thing about Monte Carlo simulation is that the procedure is simple, independent of the complexity of the estimator/estimation of interest. Doing even the most complicated Monte Carlo simulation can be broken down into simple steps:
Identify a mathematical model – the estimation you want to apply.
Define the parameters in your model.
Create random data according to those parameters. Typically, we generate independent data sets under the conditions of interest.
-
Simulate and analyze the output of your estimations. This is typically done by computing the numerical value of the estimator/test statistic. On the original data, this should be T(X). For each simulated data set we get
 , that is, the numerical values of the estimator for each simulated data. If is large enough, the distribution of gives a good approximation of the true sampling distribution of the estimator/test. Moreover, the sample mean of the estimates is an estimate of the true mean. The 0,025 and 0,975 quantiles of this distribution is an estimator of the confidence interval of the point estimate from T(X).
Generally speaking, with Monte Carlo simulation we approximate the sampling distribution of an estimator or test statistic. The particular set of related conditions are usually parameters fitted from the original data and conditions from a null hypothesis. With Monte Carlo simulations, we can successfully express the statistical uncertainty of an estimator or receive the relevant values (for example, the p-value) of a hypothesis test.
Simulation can save huge amounts of time and provides very accurate answers to our questions.
Statistical inference is often handled by asymptotic normal theory, which may provide formulas for the standard errors that allow us to construct confidence intervals around point estimates. For the simple case of the simple estimator of the arithmetic mean, we can immediately choose the formula 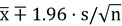 for an observational vector x with n values, the arithmetic
  and s being the standard deviation of x. However, this formula to express the confidence interval for the arithmetic mean is only true for independent identical distributed samples, sampled with simple random sampling from a population. However, in many situations the (asymptotic) distribution of the parameter of interest might not be known, and often we do not have the expertise to derive even an approximation of a formula to express the standard error of an estimator of interest. For example, this might be true for the Huber mean (Huber 1981) from data sampled with a multi-stage cluster sampling design. In other words, if the quantity of interest is a very complex function of the data or if the data is of a very complex nature, we may be able to benefit substantially from the use of a Monte Carlo simulation. Even when a formula may exist in the statistical literature to express the confidence interval, we might not be aware of it.
A very prominent resampling method is the bootstrap, intensively discussed in Chapter 7, Resampling Methods. In this approach, the sampling distribution of the parameter estimate is simulated by repeated sampling with replacement from the current data, and re-computing parameter estimates from each sampled data set. The distribution of these estimations expresses the variability of the estimation, thus this distribution can be used to express confidence intervals.
The approach is very similar for hypothesis tests. The distribution of the test statistics is not always known for a test. With the Monte Carlo approach to testing, data is simulated in a way that it mimics the null hypothesis, and parameters for data generation are used from the empirical data. The test statistic is calculated on the data and compared to the repeatedly simulated data. It's then a straightforward topic in Chapter 8, Applications of Resampling Methods and Monte Carlo Tests, Monte Carlo Tests) to receive a p-value for the test.
Big unstructured data is often analyzed nowadays, or used as auxiliary information. Running simulations on big data is a challenge.
Big data can be too large to fit in the memory of a desktop computer. Whenever this happens, basically three options are available to choose from. The first option is to just use a more powerful server with a larger amount of memory for your computations. Second, the data can also be stored efficiently in a database and we connect to the database for analysis. Typically, only a subset of the data is of interest, so we can just grab the interesting parts of the database, import it to R, do the analysis, and export the results back to the database. Since R has excellent features and APIs for connecting to well-known databases, this is the recommended approach. Third, aggregate and subset your data first. It is likely that you don't need such detailed information for your analysis. To give an example, imagine you want to analyze road traffic data. The measurement units on a highway usually report the speed, the distance to the next car, the lane used, and the kind of vehicle. If this is so, the data will be really huge. However, for an analysis of measurement faults, it is enough to aggregate the data and analyze 1- or 5-minute interval data.
As soon as the data sets become large, resampling methods such as the Bootstrap might cause long computation times. The usual method is to repeatedly sample data, estimate the statistic of interest, and save the results. Whenever simulations can be rerun under different settings, one may change this approach. For a method such as the Bootstrap, an additional vector can be stored for each Bootstrap sample containing information about how often a sample is included in a Bootstrap sample. Thus, instead of storing the Bootstrap sample, we store a vector of 0,1,... that expresses whether a unit is included (and how often) in a Bootstrap sample. With this approach, Bootstrap samples must only be selected ones. This approach is especially useful when the Bootstrap sample selection is of a more complex nature because of special sampling designs, and simulations should be re-run again.
If estimations are done repeatedly, as in the Monte Carlo approach, it is very important to have fast implementations of the estimators in the software available. It is recommended to run everything vectorized, meaning that any function call applied to a vector or any other data structure operates directly on all of its values/elements. It is then crucial that this loop is implemented in a compiled language such as C or C++, as is the case with more elementary functions of base R. R provides a powerful interface to foreign languages. The use of foreign languages is often much more efficient than using non-compiled, interpreted R language directly. Appropriately implemented apply-like functions over vectors, matrices, or data frames can even be very simply parallelized. The trick is then just to use, for example, instead of an lapply, the call mclapply from the R package parallel (R Core Team 2015).
Resampling methods can be easily run on parallel processes. Monte Carlo techniques were originally designed for machines with a single processor. With today's high performance computing possibilities, the calculation can often be done by the use of many processors running in parallel (Kroese et al., 2014). Monte Carlo techniques perform efficiently in the parallel processing framework. In R, for example, only very few modifications are needed to run a Monte Carlo approach in parallel. However, when data sets get large, parallel computing might only be faster than single-core computing in Linux or OS X operating systems, since both support forking, while Microsoft Windows does not support this to the same extent.
A related issue is the use of effective random number generation techniques for parallel computing. It must be ensured that the random numbers used by separate workers are produced independently, otherwise the workers will return the same results. To facilitate reproducible research, it is thus necessary to provide different initializations of random numbers to all workers (see also Schmidberger et al., 2009). For example, the package rlecuyer (Sevcikova and Rossini 2015) supports these issues.
The bad news is that there is no general guidance and no general method for simulation. The choice of the right simulation technique rather depends on the underlying problem, data set, and the aim of the study.
We already mentioned in which areas simulation plays a role. Depending on the area of interest, different techniques are considered. For a Bayesian analysis, the methods differ between general inference statistics using resampling techniques, and when optimization comes into the topic. The methods change completely when interaction of populations or individuals are in focus, or when predictions about the future on an individual level (micro-simulation) are required.
However, some general questions may give a little guidance for choosing the right technique. This is illustrated in Table 1.1. Of course, it is often the case that a clear decision cannot be made. For example, if you work with a sample, optimization techniques might be used for several reasons, but the main aim of optimization is more general. It can be applied to samples or population data. Another example includes, for example, in agent-based microsimulation of course one can compare models, but it's not the main aim. Thus this table should give only a very rough categorization of methods for basic questions. It should be clear that optimization methods, methods for system dynamics, and agent-based micro-simulation techniques may differ to the methods that are developed to express the uncertainty of estimators, such as resampling methods.
The following table describes choosing the right simulation technique, Monte Carlo (MC) techniques, and resampling techniques; Markov chain Monte Carlo (MCMC) methods; MC test Monte Carlo techniques applied to hypothesis testing, optimization (O), system dynamics (SD), agent-based modeling (ABM), design-based simulation (DBS), and model-based simulation (MBS):
|
Question |
Yes |
No |
|---|---|---|
|
Do you work with a sample? |
MC, MC test, MBS, DBS |
ABM, SD |
|
Is variability/randomness important? |
MC, MC test, MBS, DBS |
ABM, SD |
|
Is the number of observations large? |
ABM |
SD, MCMC |
|
Do you apply a hypothesis test? |
MC test |
ABM, DBS, SD, Opt |
|
Is the sample drawn from a finite population? |
DBS |
MBS |
|
Do you work with a population? |
ABM, Opt, SD |
MC, MC test |
|
Do you want to compare models? |
MC |
ABM, SD, Opt |
|
Do you apply Bayesian statistics? |
MCMC |
SD, Opt |
|
Do you need to simulate certain distributions? |
RN, MCMC |
SD, Opt |
|
Is probability theory a main issue? |
ABM, MCMC |
MC, MBS, DBS |
|
Has something to be optimized? |
Opt |
MC, MC test, MBS |
|
Dynamic rules of behavior within individuals. |
SD, ABM |
All others |
|
Do changes to the system happen over time? |
SD |
All others |
|
Can the time-frame of interest be long? |
ABM, SD |
All others |
Please enjoy all the chapters mentioned, simulate a cozy burning fire with R's package animation (Yihui 2013) in Figure 1.1, and start to explore all the different issues in Simulation for Data Science with R:

Figure 1.1: Snapshot of a simulated burning fire for your coziness
To run the burning fire simulation, have a look at the code on this website: http://yihui.name/en/2009/06/simulation-of-burning-fire-in-r/.
Simulation experiments are mostly data-dependent and thus perfectly suited for a data scientist. Different kinds of simulation techniques have been mentioned in this chapter. They are discussed in detail in the next chapters. We mentioned that simulation can be applied almost everywhere to show the properties and performance of methods, to make predictions, and to assess statistical uncertainty. We learned that no general approach exists and that quite different methods exist for different tasks, data sets, and problems. It's up to the data scientist and statistician to choose the right simulation approach.
Whenever computational power is an issue, remember that almost any simulation can be run in a parallel manner, and modern software is ready for this task.
In practice, one should not ask the question "Why did you use simulation?" to somebody who has applied simulation techniques, but rather "Why didn't you use simulation?" to somebody who did not.
Eddelbuettel, D., and R. François. 2011, "Rcpp: Seamless R and C++ Integration." Journal of Statistical Software 40 (8): 1–18.
Huber, P.J. 1981, Robust Statistics, Wiley.
Kroese, D.P., T. Brereton, T. Taimre, and Z.I. Botev. 2014. "Why the Monte Carlo Method is so important today," Wiley Interdisciplinary Reviews: Computational Statistics 6 (6). John Wiley & Sons, Inc.: 386–92.
R Core Team. 2015. R: A Language and Environment for Statistical Computing. Vienna, Austria: R Foundation for Statistical Computing. https://www.R-project.org/.
Schmidberger, S., M. Morgan, D. Eddelbuettel, H. Yu, L. Tierney, and U. Mansmann. 2009, "State of the Art in Parallel Computing with R," Journal of Statistical Software 31 (1).
Sevcikova, H., and T. Rossini. 2015. Rlecuyer: R Interface to RNG with Multiple Streams, https://CRAN.R-project.org/package=rlecuyer.
Yihui, X. 2013. "Animation: An R Package for Creating Animations and Demonstrating Statistical Methods," Journal of Statistical Software 53 (1): 1–27.