Download code from GitHub
Time Series Modeling in the Financial Industry
A space center is monitoring the weather pattern to schedule a departure time for its latest Martian explorer. An economist is readying his gross domestic product (GDP) forecasts to be used by equity traders, who are eager to know if we had a quarter of growth or another economic contraction. In both cases, they are relying on time series data. In the former instance to forecast a weather event, and in the latter to determine which direction GDP forecasts are headed. So, what do we mean by time series?
A series can be defined as a number of events, objects, or people of a similar or related kind coming one after another; if we add the dimension of time, we get a time series. A time series can be defined as a series of data points in time order. For example, the space center will use data from the last few years to predict the weather pattern. The data collection would have started a few years ago and subsequent data points would have given rise to an order in which data was been collected. Another aspect of the data that we usually observe is periodicity. For example, weather data would usually be collected daily, if not hourly. The periodicity of time series data is a slow-moving dimension as it seldom changes. The periodicity of recording observations is broadly driven by three factors, which are relevance, behavior driven, and purpose. In the case of weather patterns, we probably need to know how the weather will change over the course of the day. The point of sales (POS) data from debit card transactions of an individual will be recorded every time there is usage. GDP data, however, is usually aggregated in a time series format every quarter, as these numbers are usually reported on a quarterly basis by central banks or related institutions.
In this chapter, we will explore the following topics:
- Time series illustration
- The importance of time series
- Forecasting across industries
- Characteristics of time series data
- Challenges in data
- Good versus bad forecasts
- The use of time series in the financial industry
Time series illustration
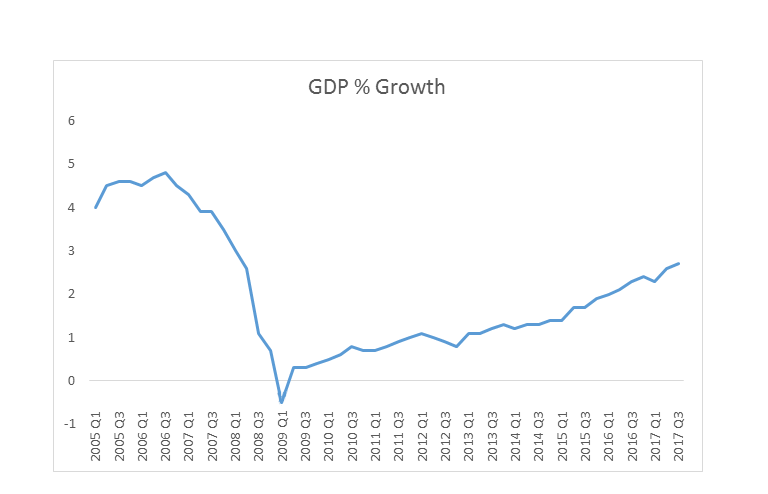
The following graph shows the quarterly GDP growth of one of Europe's leading economies. The series has been compiled at a quarterly level, and all data points from 2005 to Q3 in 2017 have been used to plot the graph. We can see that there was a decline in GDP between Q3 in 2006 and Q1 in 2009, but GDP has primarily seen an upward trajectory since then, as follows:
The importance of time series
What importance, if any, does time series have and how will it be relevant in the future? These are just a couple of fundamental questions that any user should find answers to before delving further into the subject. Let's try to answer this by posing a question. Have you heard the terms big data, artificial intelligence (AI), and machine learning (ML)?
These three terms make learning time series analysis relevant. Big data is primarily about a large amount of data that may be analyzed computationally to reveal patterns, trends, and associations, especially relating to human behavior and interaction. AI is a kind of technology that is being developed by data scientists, computational experts, and others to enable processes to become more intelligent, while ML is an enabler that is helping to implement AI. All three of these terms are interlinked with the data they use, and a lot of this data is time series in its nature. This could be either financial transaction data, the behavior pattern of individuals during various parts of the day, or related to life events that we might experience. An effective mechanism that enables us to capture the data, store it, analyze it, and then build algorithms to predict transactions, behavior (and life events, in this instance) will depend on how big data is utilized and how AI and MI are leveraged.
A common perception in the industry is that time series data is used for forecasting only. In practice, time series data is used for:
- Pattern recognition
- Forecasting
- Benchmarking
- Evaluating the influence of a single factor on the time series
- Quality control
For example, a retailer may identify a pattern in clothing sales every time it gets a celebrity endorsement, or an analyst may decide to use car sales volume data from 2012 to 2017 to set a selling benchmark in units. An analyst might also build a model to quantify the effect of Lehman's crash at the height of the 2008 financial crisis in pushing up the price of gold. Variance in the success of treatments across time periods can also be used to highlight a problem, the tracking of which may enable a hospital to take remedial measures. These are just some of the examples that showcase how time series analysis isn't limited to just forecasting. In this chapter, we will review how the financial industry and others use forecasting, discuss what a good and a bad forecast is, and hope to understand the characteristics of time series data and its associated problems.
Forecasting across industries
Since one of the primary uses of time series data is forecasting, it's wise that we learn about some of its fundamental properties. To understand what the industry means by forecasting and the steps involved, let's visit a common misconception about the financial industry: only lending activities require forecasting. We need forecasting in order to grant personal loans, mortgages, overdrafts, or simply assess someone's eligibility for a credit card, as the industry uses forecasting to assess a borrower's affordability and their willingness to repay the debt. Even deposit products such as savings accounts, fixed-term savings, and bonds are priced based on some forecasts. How we forecast and the rationale for that methodology is different in borrowing or lending cases, however. All of these areas are related to time series, as we inevitably end up using time series data as part of the overall analysis that drives financial decisions. Let's understand the forecasts involved here a bit better. When we are assessing an individual's lending needs and limits, we are forecasting for a single person yet comparing the individual to a pool of good and bad customers who have been offered similar products. We are also assessing the individual's financial circumstances and behavior through industry-available scoring models or by assessing their past behavior, with the financial provider assessing the lending criteria.
In the case of deposit products, as long as the customer is eligible to transact (can open an account and has passed know your customer (KYC), anti-money laundering (AML), and other checks), financial institutions don't perform forecasting at an individual level. However, the behavior of a particular customer is primarily driven by the interest rate offered by the financial institution. The interest rate, in turn, is driven by the forecasts the financial institution has done to assess its overall treasury position. The treasury is the department that manages the central bank's money and has the responsibility of ensuring that all departments are funded, which is generated through lending and attracting deposits at a lower rate than a bank lends. The treasury forecasts its requirements for lending and deposits, while various teams within the treasury adhere to those limits. Therefore, a pricing manager for a deposit product will price the product in such a way that the product will attract enough deposits to meet the forecasted targets shared by the treasury; the pricing manager also has to ensure that those targets aren't overshot by a significant margin, as the treasury only expects to manage a forecasted target.
In both lending and deposit decisions, financial institutions do tend to use forecasting. A lot of these forecasts are interlinked, as we saw in the example of the treasury's expectations and the subsequent pricing decision for a deposit product. To decide on its future lending and borrowing positions, the treasury must have used time series data to determine what the potential business appetite for lending and borrowing in the market is, and would have assessed that with the current cash flow situation within the relevant teams and institutions.
Characteristics of time series data
Any time series analysis has to take into account the following factors:
- Seasonality
- Trend
- Outliers and rare events
- Disruptions and step changes
Seasonality
Seasonality is a phenomenon that occurs each calendar year. The same behavior can be observed each year. A good forecasting model will be able to incorporate the effect of seasonality in its forecasts. Christmas is a great example of seasonality, where retailers have come to expect higher sales over the festive period.
Seasonality can extend into months but is usually only observed over days or weeks. When looking at time series where the periodicity is hours, you may find a seasonality effect for certain hours of the day. Some of the reasons for seasonality include holidays, climate, and changes in social habits. For example, travel companies usually run far fewer services on Christmas Day, citing a lack of demand. During most holidays people love to travel, but this lack of demand on Christmas Day could be attributed to social habits, where people tend to stay at home or have already traveled. Social habit becomes a driving factor in the seasonality of journeys undertaken on Christmas Day therefore.
It's easier for the forecaster when a particular seasonal event occurs on a fixed calendar date each year; the issue comes when some popular holidays depend on lunar movement, such as Easter, Diwali, and Eid. These holidays may occur in different weeks or months over the years, which will shift the seasonality effect. Also, if some holidays fall closer to other holiday periods, it may lead to individuals taking extended holidays and travel sales may increase more than expected in such years. The coffee shop near the office may also experience lower sales for a longer period. Changes in the weather can also impact seasonality; for example, a longer, warmer summer may be welcome in the UK, but this would impact retail sales in the autumn as most shoppers wouldn't need to buy a new wardrobe. In hotter countries, sales of air-conditioners would increase substantially compared to the summer months' usual seasonality. Forecasters could offset this unpredictability in seasonality by building in a weather forecast variable. We will explore similar challenges in the chapters ahead.
Seasonality shouldn't be confused with a cyclic effect. A cyclic effect is observed over a longer period of generally two years or more. The property sector is often associated with having a cyclic effect, where it has long periods of growth or slowdown before the cycle continues.
Trend
A trend is merely a long-term direction of observed behavior that is found by plotting data against a time component. A trend may indicate an increase or decrease in behavior. Trends may not even be linear, but a broad movement can be identified by analyzing plotted data.
Outliers and rare events
Outliers and rare events are terminologies that are often used interchangeably by businesses. These concepts can have a big impact on data, and some sort of outlier treatment is usually applied to data before it is used for modeling. It is almost impossible to predict an outlier or rare event but they do affect a trend. An example of an outlier could be a customer walking into a branch to deposit an amount that is 100 times the daily average of that branch. In this case, the forecaster wouldn't expect that trend to continue.
Disruptions
Disruptions and step changes are becoming more common in time series data. One reason for this is the abundance of available data and the growing ability to store and analyze it. Disruptions could include instances when a business hasn't been able to trade as normal. Flooding at the local pub may lead to reduced sales for a few days, for example. While analyzing daily sales across a pub chain, an analyst may have to make note of a disruptive event and its impact on the chain's revenue. Step changes are also more common now due to technological shifts, mergers and acquisitions, and business process re-engineering. When two companies announce a merger, they often try to sync their data. They might have been selling x and y quantities individually, but after the merger will expect to sell x + y + c (where c is the positive or negative effect of the merger). Over time, when someone plots sales data in this case, they will probably spot a step change in sales that happened around the time of the merger, as shown in the following screenshot:
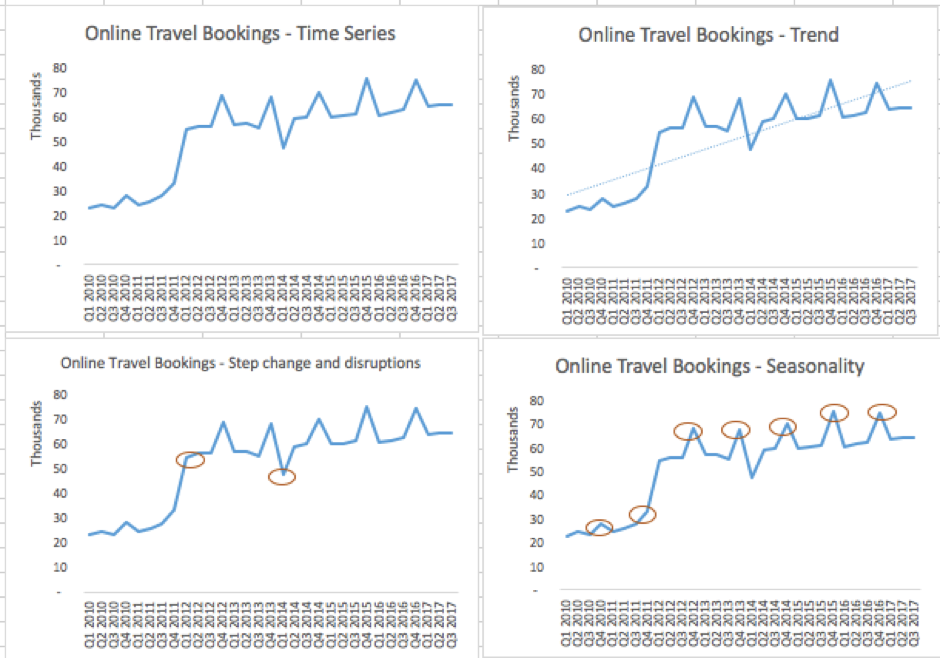
In the trend graph, we can see that online travel bookings are increasing. In the step change and disruptions chart, we can see that Q1 of 2012 saw a substantive increase in bookings, where Q1 of 2014 saw a substantive dip. The increase was due to the merger of two companies that took place in Q1 of 2012. The decrease in Q1 of 2014 was attributed to prolonged snow storms in Europe and the ash cloud disruption from volcanic activity over Iceland. While online bookings kept increasing after the step change, the disruption caused by the snow storm and ash cloud only had an effect on sales in Q1 of 2014. In this case, the modeler will have to treat the merger and the disruption differently while using them in the forecast, as disruption could be disregarded as an outlier and treated accordingly. Also note that the seasonality chart shows that Q4 of each year sees almost a 20% increase in travel bookings, and this pattern continues each calendar year.
Challenges in data
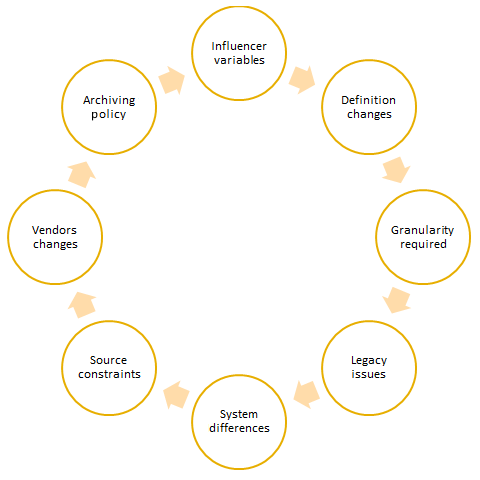
If your client says they have an abundance of good quality data, be sure to take it with a pinch of salt. Data collection and processing are cost – and time-intensive tasks. There is always a chance that some data within the organization may not be of as high a quality as another data set. The problems in time series are often compounded by the time element. Due to challenges in data, organizations need to recalculate metrics and make changes to historical data, source additional data and build a mechanism to store it, as well as reconcile data when there are different definitions of data or a new data source doesn't reconcile with the previous sources. Data processing and collection may not be difficult for an organization if the requirement was for data going forward; historical data recalibration across a large time period, on the other hand, will present some challenges, as shown in the following diagram:
Influencer variables
The relationship between the forecasted and dependent variable and other influencer or independent variables changes over a period of time. For example, most forecasting models weren't able to predict the global economic crash of 2008. Post-crash, modelers in a leading bank tried to rebuild their models with new variables that would be able to predict behavior better. Some of these new influencer variables weren't available in the central database. A vendor was selected to provide history and a continuing data feed to enable the availability of such variables in the future. In this case, since the influencer variables changed, the modeler had to look outside the scope of available variables in the central database and try to find better fitting variables.
Definition changes
A financial institution recently changed its definition of defaulting as it moved from a standard approach to an advanced, internal rating-based approach to potentially reduce its capital requirements and credit risk. The change to the Basel definition means that the institution's entire historical database needed to be modified. In this case, the new default definition in the institution is calculated using at least six other variables that need to be stored and checked for data quality across several years.
Granularity required
After changing influencer variables and running models for a couple of years, a modeler was informed by a data team that the central bank is planning to stop providing granular data for one of the modeling variables and that the metric would still be published but in an aggregated manner. This may impact the usability of such data for modeling purposes. A change in a variable in a regulatory environment has multiple overheads. In this scenario, the modeler would have to engage with the data team to understand which variable can be used as a substitute. The IT team would then have to ensure that variable (if not already available as a regular feed) is made available to the data team and the modeler. The material impact of the change in the variable on the modeling output would also have to be studied and documented. There might be an instance where a modeling governance team has to be notified of changes in the model. In an ideal governance environment, if code changes are to accommodate a new variable, testing would be undertaken before any change is implemented. A simple change in variable granularity can trigger the need for multiple subsequent tasks.
Legacy issues
Legacy issues may mean that some amount of information isn't available in the central database. This could be due to the fact that a system was upgraded recently and didn't have the capability to capture some data.
System differences
System differences arise because of a user's behavior or the way systems process data. Users of a telephone banking customer relationship management (CRM) system, for example, may not be capturing the incoming details of its callers, whereas branch officers using a different CRM frontend will be. The branch data may only be sparsely available (only when the customer divulges income), but has the potential to be more accurate.
Source constraints
Source constraints could arise simply because of the way some systems are designed. A system designed to store data at a customer level will not be able to efficiently store data that has been aggregated at an account level, for example. Vendor changes may impact data quality or the frequency of when data is available. Organizations also have differing archival policies, so if a modeler is looking to use time series data that goes as far back as a decade, some of this data may have already been archived and retrieval may be a time-consuming affair.
Vendor changes
Most organizations end up using a particular vendor for a long period of time. In some instances, it is the bank's transactional data system, in others the CRM tool or data mining software. In all of these cases, there is dependency on a vendor. Most vendors would like to develop a relationship with their client and grow alongside them, where contracts would be re-negotiated but with greater functionality and scalable software provided. There are times, however, when a client and a vendor decide to part ways. Be mindful that this can be a painful exercise and a lot of things can go wrong. Such a transition might lead to temporary or long-term breaks in data; some systems may be switched off and the new system replacing it might not be able to capture data in the same manner. A vendor who supplied customer leads or risk ratings may no longer be contracted and data quality may even suffer from a new vendor. Businesses and modelers need to be aware of these challenges.
Archiving policy
There is an archiving and retrieval policy in place in most organizations. However, retrieval can take time and may also lead to higher costs for sourcing data. These constraints could easily put off a modeler from exploring historical data that may have been archived. Archiving policy should therefore be based on the importance of the data, the regulatory requirement, and the ease of data retrieval.
Good versus bad forecasts
Forecasting plays a fundamental role in ensuring the success and future viability of an organization. The famous camera and film company Kodak failed to forecast the growth of digital photography, for example, and has now fallen behind its peers. Coca-Cola had to famously ramp up its own production after pulling the curtains on its revamped Coke New in response to a surge in popularity of Pepsi in the 1980s. Because of this, Coke miscalculated the potential popularity of its new formula and branding and instead went back to its core formula and started calling it Classic Coke. As we can see, most business decisions involve estimates or forecasts. These decisions can range from opening a new manufacturing facility to launching a new product range, opening up more stores, or even launching a new mobile application.
Since forecasting is so integral to the whole business process, it is important to get the forecast as accurate as possible. Seldom will you see a forecast that is the exact quantity of the observed event. However, it isn't rare to see forecasts miss their objective by a wide margin either. There are various statistical measures that we will cover in upcoming chapters that will help us to assess the probable success of a model's forecast. For now, let's first assess the following factors that define the quality of forecasts produced:
- Subject area: Forecasting accuracy depends on what is being forecasted and its application. In the earlier example of a spacecraft being readied for launch, the accuracy of the weather forecast cannot be wrong by a significant margin as the cost of getting it wrong will be high. However, if you are simply planning a picnic, the costs of getting the weather forecast wrong are completely different.
- Consistency: One of the most difficult tasks in the corporate world is to get peers in various teams to trust the model that generates forecasts. An inconsistent model isn't going to help in convincing others to support the model through budget allocation or ensuring that the output is consistently used. Any model needs testing, and validation data in ideal circumstances, before it is formally signed off. If a model is replacing a manual process, then it might be a good idea to conduct a pilot or parallel run where the model and the manual input both act as inputs. This might help overcome any teething problems when making the model operational, and may also highlight any concerns before the model gets a reputation.
- Error margins: In most cases, the brief for any forecasting model is to get it right–but get it right by what percentage? Is there an acceptable tolerance? And should a model be right all the time? A model isn't a crystal ball, and there will be instances when forecasts aren't right or miss the mark within a reasonable level. While sharing forecasts, a modeler should provide a confidence level that implies a margin for error. A business' expectation of the error margin may be different, so it is best to discuss this prior to building.
- Rare events: In hindsight, rare events are relatively simple to model. You will probably see a big crest or trough in a time series line plot and will therefore be able to make out a significant event. If it's a rare event, dummy variable creation should help smooth out its effect. If another rare event occurs in the future, a model might not be able to deal with it effectively. There is always a possibility of this happening and the impact of rare events is unpredictable. A modeler should be able to interpret an event's effects and communicate with stakeholders on the relationship between the event and their forecast, as well as if the model needs recalibrating.
- Judgment versus modeled forecasts: In any large organization, there will be individuals who might think they can predict a scenario better than a model. They might deal with the forecasted scenario more closely than the modeler, they might have some inherent bias towards an outcome, or they might feel that the model doesn't take into account factors that they think are important. Rather than taking a skeptical view of such individuals, a modeler should try and engage them to see if their model can learn from their experiences.
- Volatile environment: Will a model's performance be the same in both a volatile and stable period? Post-Lehman crisis, the interest rates of major central banks have nosedived. The two scenarios that a model would probably forecast in this scenario is that the central bank will hold rates or revise them downwards. Once the US Federal Bank starts revising rates upwards, other banks might follow. So, will the model be able to correctly forecast the rate rise and be able to effectively predict for an alternative scenario? A model that incorporates good explanatory variables should ideally be able to predict rate rises and accommodate for other scenarios; however, not all models continue to perform well and any deterioration may prompt the need for model recalibration or a rebuild.
- Assessing period: Some models are built for a one-off objective, whereas others are built into business as usual (BAU) processes and will generate forecasts for years to come. The benchmark for judging forecasts as good or bad should depend on the assessing period. Another aspect of the assessing period to take note of is its length. A weather model might be more accurate when forecasting a day ahead but not when forecasting a month ahead, for example. The monthly forecast model might need to use different variables and methodology, and so this model might not be fit for purpose in this case. A modeler should therefore try to build separate models for predicting the risk of default by a customer at any point in time versus any time in the next 12 months. A regulator might also require that certain businesses and models are validated every few months or years to ensure they are fit for purpose.
Use of time series in the financial industry
The financial industry has managed to find varied uses for time series. Some of the uses we are going to cover are as follows:
- Predicting stock prices and making portfolio decisions
- Adhering to Basel norms
- Demand planning
- Inflation forecasting
- Managing customer journeys and maintaining loyalty
Predicting stock prices and making portfolio decisions
Stock price prediction is based on the assumption that the efficient market hypothesis doesn't hold true. The efficient market hypothesis states that, at any point, the price of stock is already reflective of all information and rational expectations. Hence, no amount of insight generated from historical price trends or influencer variables will predict the stock price movement effectively. There is academic evidence to support the efficient market hypothesis, but also an acknowledgement that there are some individuals and institutions who have managed to beat the average returns of the stock market by using their judgment. However, it is worth noting that stock prices are highly reactive to news and events, and also seem to be driven by both rational and irrational expectations. Time series data does have a role to play in predicting stock prices but its application is changing. In predicting stock prices, the problem isn't the availability of data but rather about cancelling out the noise and finding the real reasons that a stock moves.
Time series is also helpful when making portfolio decisions. Unlike stock prices, which can change by the second, portfolio decisions are taken over a slightly longer time-frame, ranging from a day to years. Time series data can help us understand the elements of an investment portfolio, the expected returns in a number of years, and even the probable behavior of investors once they re-invest their money from a maturity fixed bond into available products in the market.
Adhering to Basel norms
Basel norms were introduced by the Basel Committee on Bank Supervision (BCBS), which set out the minimum capital requirements that financial institutions need to hold to minimize credit risk. What started out as a voluntary framework that institutions were free to adopt is now a key requirement for some central banks. The Basel norms have been revised to safeguard against the growing risks that financial institutions face. Time series data is used to build various models related to the probability of default and various other metrics that help in assessing credit risk and deciding the level of capital that institutions need to hold to offset risk. The Prudential Regulatory Authority (PRA) in the UK and similar federal organizations regulate and monitor adherence to the Basel norms.
Demand planning
Any organization, industry sector, or government body needs to estimate demand for products or services. The estimation needs to be primarily done at the firm and industry level, as there might be many more models required within one firm to estimate demand. A finance team may use demand estimation models to assess its funding needs; an inventory management team may assess consumer demand and its current production levels to assess stock needs and plan production accordingly. At times, forecasting might happen at a macro level, for example involving the economy, market sizing, and so on. A company planning to diversify into a new sector will want to know what the current market demand is, how much is it expected to grow by, and what proportion of this market can be captured as a new entrant in what might be a crowded marketplace of established players. Demand planning helps with all of these scenarios.
Inflation forecasting
Inflation is a measure that affects all aspects of our life, including earnings and spending power. It is produced by central banks, or some other nominated government institution, and is used as a benchmark to assess the health of the economy and set expectations on the level of future earnings to ensure sufficient returns on investment. Various levels of inflation can highlight different problems in the economy. Japan can be considered as a classic example of experiencing deflation, where a government tries to increase spending through various measures to get the inflation rate higher. Run-away inflation in Zimbabwe and Venezuela has caused havoc for its residents, on the other hand, while the Eurozone is struggling to get inflation to a meaningful growth rate. Whatever the rate of inflation, forecasting it using time series data is of the utmost importance.
Managing customer journeys and maintaining loyalty
Managing customer journeys and maintaining loyalty aren't the most obvious uses of time series data, but by assessing the history of customers' past product choices, transactional data, and their engagement with an organization, you can try to manage this customer journey. After all, in most instances, it is much cheaper to keep a customer loyal and onboard than to acquire a new customer.
Summary
In this chapter, we defined time series and learned why it is important for forecasting. We looked at the characteristics of time series data, and we also explored the challenges associated with it when we try to make forecasts. Lastly, we looked at the use of time series in various industries. In the next chapter, we will learn how to forecast stock prices using time series data modeling.
References
Please refer to the following articles:
- Lo, A.W. and Mackinlay, A.C. A Non-Random Walk Down Wall Street 5th Ed. Princeton University Press, 2002
- Shumway, R. H. (1988). Applied statistical time series analysis. Englewood Cliffs, NJ: Prentice Hall. ISBN0130415006.
- Gershenfeld, N. (1999). The Nature of Mathematical Modeling. New York: Cambridge University Press. pp. 205-208. ISBN0521570956.