QlikView is an easy-to-use business intelligence product. It is designed to facilitate ad hoc relationship analysis but can also be used for more formal corporate performance applications for the financial user. It is designed to use a methodology of direct discovery to analyze data from multiple sources. QlikView is designed to allow you to do your own business discovery and to take you quickly out of the data management stage and into the data relationship investigation stage. Investigating relationships and outliers in financial data more quickly can lead to better management.
In this chapter, we will cover the following topics:
When do we use QlikView?
Getting ready—downloading and installing QlikView
Becoming familiar with QlikView
Opening and examining QlikView
Loading data from Excel
How QlikView works for analysis—finding the out of balance
Modifying the load script
Loading more than one spreadsheet
Automatically linking data
With that in mind, when would you want to use QlikView? You would use it when you wish to analyze and quickly see trends and exceptions that—with normal financial application-oriented BI products—would not be readily apparent without days of setting up by consultants and technology departments. With QlikView, you can also analyze data relationships that are not measured in monetary units. Certainly, QlikView can be used to analyze sales trends and stock performance, but other relationships soon become apparent when using QlikView.
This chapter will take you through getting financial ledger data into QlikView and analyzing the out of balance.
QlikView is available in a free, personal edition from the QlikTech company website at http://www.qlik.com. The version of QlikView used in the screenshots in this book is 11.20.12577.0 64 bit.
If you have never downloaded your own personal edition of QlikView before or you want the latest edition, navigate to the website and click on the button labeled Free Download. Scroll down to, where you will be asked to register and choose a username.
Click on Download Now, and select your preferred Language and the version of the product you need for your environment. Choose the correct version for your computer.
Click on the Download QlikView Now button, and when your system asks you what you want to do, click on the Run button. You may want to come back and download the tutorial too.
Follow the instructions on the install screens. Give your system permission to install the software, if necessary, and accept the license agreement. It can take 10–20 minutes to download and install depending on your Internet speed. The latest version of QlikView is now available to use.
Note
There are two sample data Excel spreadsheets (available for download from your account at http://www.PacktPub.com) that are used in the first chapter. Their names are CHData_Oct.xls and CHData-Nov.xls.
This book is designed to give financial executives and personnel a greater understanding of how to use QlikView for financial insight. The lessons and examples in this book presume that you have already downloaded QlikView and can start it from your program menu. You should also have a working knowledge of Microsoft Excel.
Start QlikView from your Start program menu in Windows. After QlikView starts, you can begin to navigate around in it and start to familiarize yourself with the environment.
QlikView consists of two parts: the sheet contains sheet objects, such as charts or list boxes that show clickable information, and the load script stores information about the data and the data sources that the data is coming from.
Financial professionals always use Excel to examine their data. So, we are going to start by loading data from an Excel sheet using the New document button. QlikView can also help you create a basic document sheet containing a chart. The newest version of QlikView comes with sample Sales Order data that can be used to investigate and create sheet objects.
To use data from other file types, you can use File Wizard: Type that you start from the Edit Script dialog by clicking on the Table Files button.
Using the Edit Script dialog, you can view your data script, edit the script, and add other data sources. You reload your data by clicking on the Reload button. If you just want to analyze data from an existing QlikView file and analyze the information in it, you do not need to work with the script at all.
After QlikView opens, you will see the default start screen:
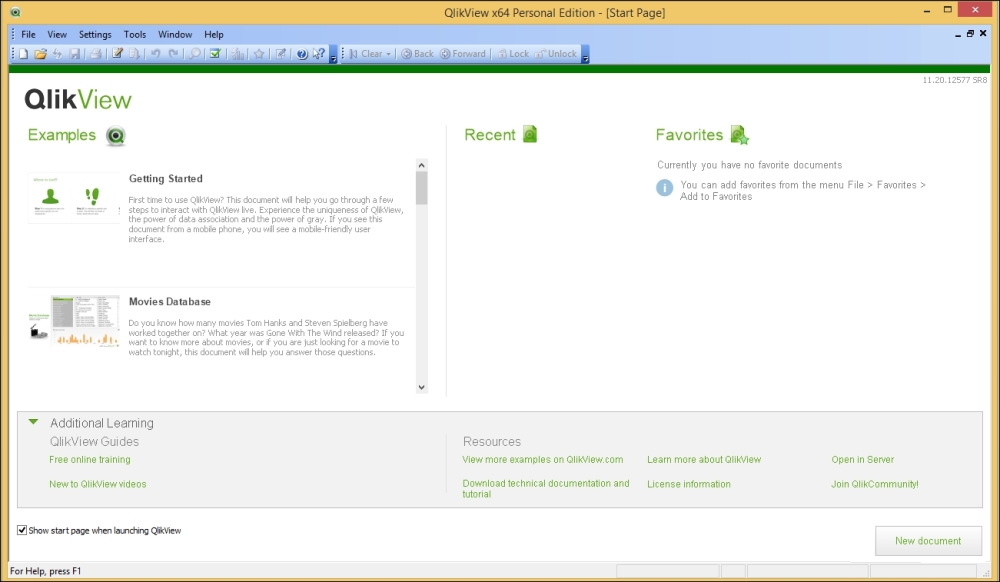
Figure 1-1: The default start screen
Here, you will see the side menu with Getting Started ► as the highlighted selection; along with Recent, which will be blank the first time QlikView is opened; Favorites, which is also empty at this point; Open in Server, which allows you to register the QlikView server if your company has an Enterprise QlikView license and is running QlikView from a server; and Resources, where you can follow links back to the QlikView website and see more examples. In the lower-left corner, you have the option to uncheck the box to show this screen when starting QlikView. Leave that option checked to make it easy to navigate to examples and training.
Getting Started shows that you are running QlikView Personal Edition, with options to use Learn QlikView and to see Examples. The third entry, under Examples in this version, is Data Visualization, which is a very good tutorial on what types of charts to use to aid in visual discovery and understanding of your data relationships.
Now, let's create our first QlikView document by loading data from Excel. Start by clicking on the New Document button located in the lower-right corner of this version of QlikView. Prior editions of the personal download have other options, such as a link under Learn QlikView saying Create a new QlikView document by loading data from an Excel file.
For this example, we will use sample financial data downloaded from an ERP system into Excel. This sample data can be downloaded from your account at Packt Publishing at http://www.PacktPub.com. The filenames are CHData-Oct.xls and CHData-Nov.xls. Review the data in Excel before you load it to learn how a load file should be set up.
There are six steps to setting up the load file:
Select the data source. Do this by clicking on Browse and navigating to the Excel file that you are going to analyze. First, we will load the file named
CHData-Oct.xls.Verify the data and choose to use column headers from this data file (or create your own for each column in the data). With the sample data, we will use the existing column headers.
Save your new QlikView QVW file and give it a name of your choice. Our example uses
CheyenneCO.qvw.Choose the chart type that you wish to create for your first sheet object. Here, because it is one month of financial type data, we will choose a bar chart to start examining our sample data.
Select the dimension(s) that you want to use in your first chart. Here, we selected AcctGroup. We can alternatively choose CostCenter. Dimensions represents the columns of data from the Excel file that we loaded. We will add a mathematical expression, such as sum or average. We will just add the sum expression of the Amount column we loaded.
For our final selections, we will choose a table box that will list and group all our fields.
We have now created our first QlikView application. Move your objects around so that your table box is lower in the screen, and widen it so that all the columns can be seen. Then, in the free space above, right-click and add a statistics box. I have named it Statistics Box in the screenshot. Make sure that you choose Amount as your statistic. If you prefer, you can remove or add statistical measures from your statistics. Your QlikView Financial Analysis of Cheyenne Company should appear similar to the following screenshot:
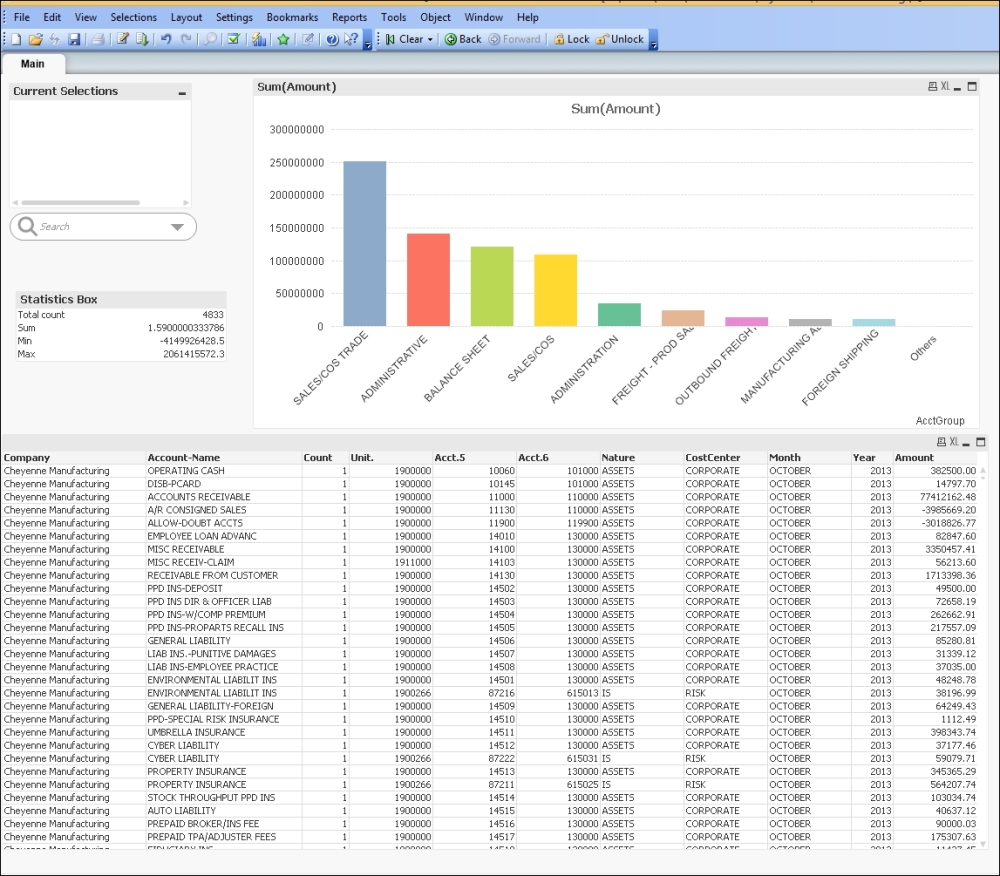
Figure 1-2: Our financial analysis QlikView application
As you can see in the menu drop-down, there are multiple sheet object types to choose from, such as List Box, Statistics Box, Chart, Input Box, Current Selections Box, Multi Box, Table Box, Button, Text Object, Line/Arrow Object, Slider/Calendar Object, and Bookmark Object. We will cover more of them in the course of this book. Help and Extended Examples on the QlikView website will allow you to explore ideas beyond the scope of this book.
We chose the Statistic Box Sheet object to add the grand total to our analysis. From this, we can see that the total company is out of balance by $1.59. From an auditor's point of view, this amount is probably small enough to be immaterial, but, from our point of view as financial professionals, we want to know where our books are not in balance.
To make our investigation easier, we will add one additional sheet object—List Box—for Company. Right-click and, from the Context menu, choose New Sheet Object; then choose List Box. We will now go through each tab of the List Box properties.
On the General tab of List Box, we will give the new List Box the Title of Company List. The object ID will be system-generated. We choose the Field Company from the fields available in the data file that we loaded. We can check the box to show Frequency in Percent below Title and Field, which will only tell us how many account lines in October were loaded for each company.
In the Expressions tab, we can add formulas to analyze the data. Here, we will click on ADD and will choose SUM; since we only have numerical data in the Amount field, we will sum Amount. Don't forget to click on the PASTE button to move your expression into Expression Checker. Expression Checker will tell you whether the expression format is OK or whether there is a syntax problem.
Note
If you forget to move your expression into Expression Checker with the PASTE button, the expression will not be saved and will not appear in your application.
The Sort tab allows you to change the Sort criteria from text to numeric or even date. We will not change the Sort for Company.
The Presentation tab allows you to adjust things such as column or row header wrap, cell borders, and background pictures.
The Number tab allows you to override the default format to tell the sheet whether you want to format the data as money, a percentage, or dates, for example. But in this version, it does not seem to be working properly until selected. We can use this tab on our table box that is currently labeled Sum(Amount) to format Amount as money after we have finished creating our new company List Box.
The Font tab lets you choose the display font you want to use, the display size, and whether to make your font bold.
Layout allows you to establish and apply themes and format the appearance of the sheet object, which, in this case, is List Box.
The Caption tab further formats the sheet object and allows us, in the case of List Box, to choose the icons that will appear in the top bar of the List Box so that we can use those icons to Select and Clear selections in the List Box. In this example, we have selected Search, Select All, and Clear. The following screenshot shows this:
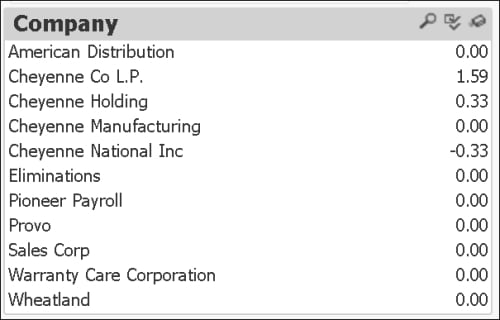
Figure 1-3: Added company list box
We can now see that we are actually out of balance in three companies. Cheyenne Co L.P. is the company that is out of balance by $1.59, but Cheyenne Holding and Cheyenne National Inc seem to have balancing entries that balance at the total companies level but don't balance at the individual company level.
Now we need to edit our Table Box sheet object with the Amount displayed. Right-click on the Straight Table sheet object and choose Properties from the pop-up menu. In the first tab, the General tab, give Table a suitable name if desired. Then move over to the Number tab and choose Money for the number format. Click on APPLY to immediately apply the number format, and click on OK to close the wizard.
Now our Straight Table sheet object looks like the previous screenshot displaying dollar signs and two decimals for Amount.
We can analyze our data just using the list boxes by selecting Company, seeing which Account Groups are included, and seeing which Cost Centers are included (white) and which are excluded (gray). Our selected company shows up in green and in Current Selection Box.
By selecting Cheyenne Holding, we can see that it is indeed a holding company and doesn't have any manufacturing or sales accounting groups or cost centers. Also, that particular company is in balance.
Next we will use the second Excel spreadsheet available from your Packt account:
CHData-Nov.xls.
Note
There are two sample data Excel spreadsheets (available for download from your account at http://www.PacktPub.com) that are used in the first chapter. Their names are CHData_Oct.xls and CHData-Nov.xls.
To load more than one spreadsheet or to load from a different data source, we must edit the load script. The Edit Script dialog is opened from the File menu or by clicking on the Edit Script symbol in the toolbar.
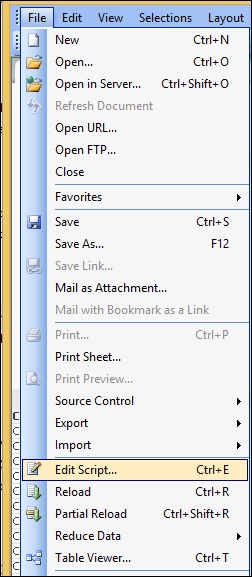
Figure 1-4: A closeup of the File menu showing Edit Script
From the Edit Script interface, we can modify and execute a script that connects the QlikView document to an ODBC data source (or to data files of different types) and also pulls in the data source information.
Our first script was generated automatically; but scripts can be typed manually, or automatically generated scripts can be modified. Complex script statements must, at least partially, be entered manually. The statements, expressions, functions, and so on available for the creation of scripts are described in the QlikView Help: Script Syntax and Script Expressions.
The Edit Script dialog uses autocomplete so, when you type, the program tries to predict what is required in the script without you having to type it completely. The predictions include words that are part of the script syntax. The script is also color-coded by syntax components. The Edit Script interface and behavior can be customized by choosing Tools and Editor Preferences.
At the top of the dialog, a menu bar, with various script-related commands, is found. The most frequently used commands also appear in the toolbar. In the toolbar, there is also a drop-down list for the tabs of the Edit Script wizard.
Note
Make sure your Excel column headers aren't named the same if you are going to use them as labels. If the columns are named the same, QlikView automatically tries to combine them!
Once we have clicked on the Edit Script menu item, we will see the following script in the script interface:
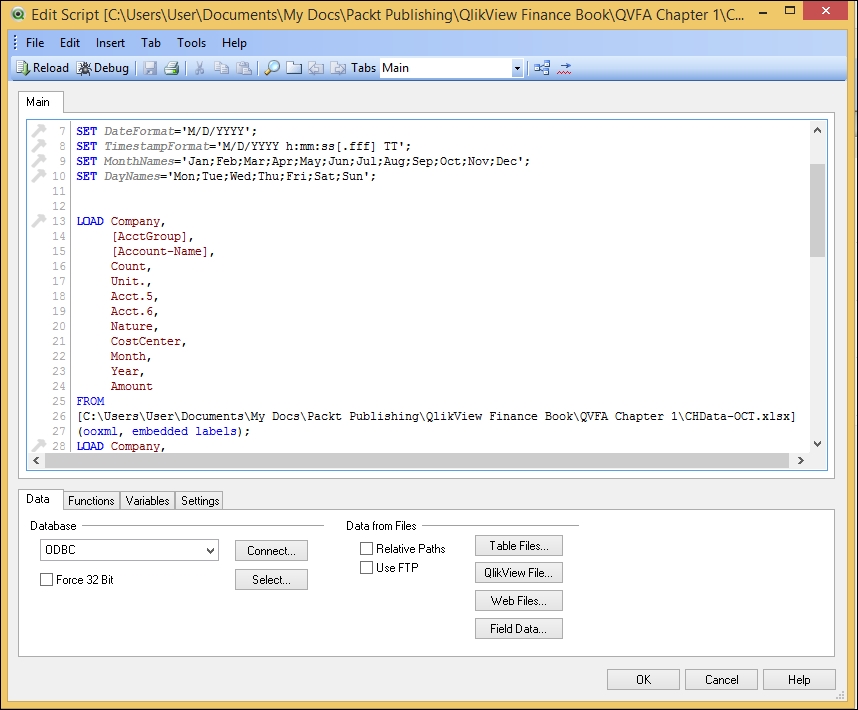
Figure 1-5: The Edit Script interface with our generated script
The script in the Edit Script interface is the automatically generated one that was created by the wizard when we started this QlikView file. The automatically generated script picked up the column names from the Excel file and put in some default formatting scripting. The actual text of the script is as follows:
SET DateFormat='M/D/YYYY';
SET TimestampFormat='M/D/YYYY h:mm:ss[.fff] TT';
SET MonthNames='Jan;Feb;Mar;Apr;May;Jun;Jul;Aug;Sep;Oct;Nov;Dec';
SET DayNames='Mon;Tue;Wed;Thu;Fri;Sat;Sun';

LOAD Company,
     [AcctGroup],
     [Account-Name],
     Count,
     Unit.,
     Acct.5,
     Acct.6,
     Nature,
     CostCenter,
     Month,
     Year,
     Amount
FROM
[C:\Users\User\Documents\My Docs\Packt Publishing\QlikView Finance Book\QVFA Chapter 1\CHData-OCT.xlsx]
(ooxml, embedded labels);
We can change our date formats, month names, day names, our thousands, and our decimal separators by changing them in the automatically generated formats. We can copy this part of the script into new blank scripts to get started. The language selection that we made during the initial installation of QlikView determines the defaults assigned to this portion of the script.
We can add data from multiple sources, such as ODBC links, additional Excel tables, sources from the Web, FTP, and even other QlikView files.
Our first Excel file, which we used to create the initial QlikView document, is already in our script. It happened to be October 2013 data, but what if we wanted to add November data to our analysis? We would just go into Edit Script from the File menu and then click on the script itself.
Note
Make sure your cursor is at the bottom of the script after the first Excel file path and description. If you do not position your cursor where you want your additional script information to populate, you could generate your new script code in the middle of your existing script code. If you make a mistake, click on CANCEL and start over.
After navigating to the script location where you want to add your new code, click on the Table Files button below the script and toward the center-right—the first button in the column. Click on NEXT through the next four screens unless you need to add column labels or transform your data for analysis in some way. The following section is added to our script:
LOAD Company,
     [AcctGroup],
     [Account-Name],
     Count,
     Unit.,
     Acct.5,
     Acct.6,
     Nature,
     CostCenter,
     Month,
     Year,
     Amount
FROM
[C:\Users\User\Documents\My Docs\Packt Publishing\QlikView Finance Book\QVFA Chapter 1\CHData-NOV.xlsx](ooxml, embedded labels, table is LNData);
Comments can be added to scripts using // for a single line or by surrounding the comment by a beginning /* and an ending */; they show up in green. After using the OK button to get out of the Edit Script interface, there is another File menu item that can be used to see whether QlikView has correctly interpreted the joins. This is the Table Viewer menu item. You cannot edit in the Table view, but it is convenient to visualize how the table fields are interacting.
Tell the Edit Script interface OK by clicking on the OK button in the lower-right corner. This will save the changes to the script. Now, using the File menu, navigate below Edit Script to the RELOAD menu item, and click on that to reload your data. If you receive any error messages, the solutions can be researched in the QlikView Help. In this case, QlikView knew that we were adding data to the same table, the layout was the same, and the column names were the same. But looking at company List Box and Amount Statistics Box, we see everything added together. The following screenshot shows this:
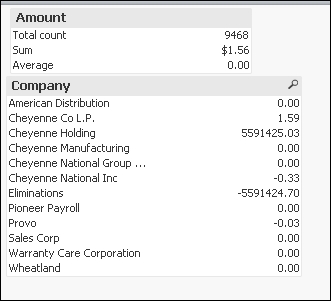
Figure 1-6: Data doubled after the reload with the additional file
The reason why this is happening is that we do not have a selection to split the months and only select October or November or to split October from November. What do we do? Now that we have more than one month of data, we can add another List Box with Months. This will automatically link up with our Chart and Straight Table sheet objects to separate our monthly data.
First, we will add a new List Box for Months. Right-click on the sheet and select New Sheet Object | List Box. In the General tab, we will choose Field (labeled Month in the Excel files). Then, we go to the Sort tab and check Sort by Text. Finally, we choose the icons that we want to appear on the top bar of List Box in the Captions tab.
When we choose OCTOBER or NOVEMBER, our sheet objects automatically show the correct sum of the individual months. Your QlikView document will now look somewhat similar to this next screenshot, depending on how you arranged your added sheet objects:
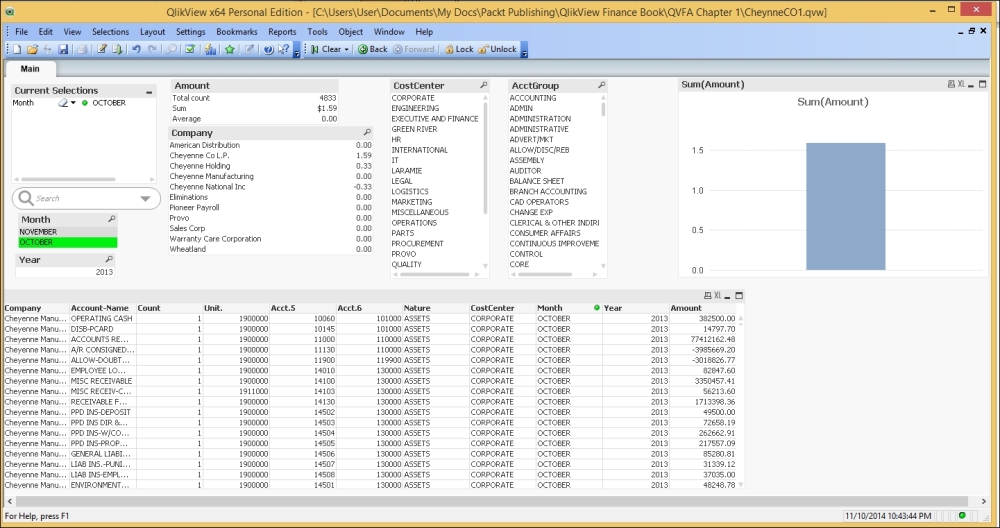
Figure 1-7: A QlikView document
You learned how to obtain and install QlikView. You created your first QlikView analysis and learned how to add data to that analysis. We have scratched the surface of some of the things that can be done with QlikView. The next chapters are designed to tackle ways of analyzing different financial information within QlikView.