Download code from GitHub
Designing GUI Applications
Software applications are developed in three repeating phases: understanding a problem, designing a solution, and implementing the solution. These phases repeat throughout the life of an application as you add new features, refine functionality, and update your application until it is either optimal or obsolete. While many programmers want to jump right into the implementation phase, putting away your code editor and taking the time to work through the first two phases will give you a better chance to develop an application that solves the problem correctly.
In this chapter, we'll be introduced to a problem at your new workplace and begin designing a solution to that problem over the following topics:
- In Analyzing a problem at ABQ AgriLabs, we'll learn about an issue at your new job that you can help solve with your coding skills.
- In Documenting specification requirements, we'll create a program specification that lays out the requirements of our solution.
- In Designing the application, we'll develop a design for a GUI application that implements the solution.
- In Evaluating technology options, we'll consider which toolkit and language are most appropriate for our project.
Analyzing a problem at ABQ AgriLabs
Congratulations! Your Python skills have landed you a great job as a data analyst at ABQ AgriLabs. So far, your job is fairly simple: collating and doing simple data analysis on the CSV files sent to you daily by the lab's data entry staff.
There is a problem, though. You've noted with frustration that the quality of the CSV files from the lab is sadly inconsistent. Data is missing, typos abound, and often the files have to be re-entered in a time-consuming process. The lab director has noticed this as well and, knowing that you are a skilled Python programmer, she thinks you might be able to help. You've been enlisted to program a solution that will allow the data entry staff to enter lab data into a CSV file with fewer mistakes. Your application needs to be simple and allow as little room for error as possible.
Assessing the problem
Spreadsheets are often a first stop for computer users who need to keep track of data. Their table-like layouts and computational features seem to make them ideal for the task.
However, as a set of data grows and is added to by multiple users, the shortcomings of spreadsheets become apparent: they don't enforce data integrity, their table-like layout can be visually confusing when dealing with long rows of sparse or ambiguous data, and users can easily delete or overwrite data if they aren't being careful.
To improve this situation, you propose to implement a simple GUI data entry form that appends data to a CSV file in the format we need. Forms can help to improve data integrity in several ways:
- They can enforce the type of data to be entered (for example, numbers or dates).
- They can verify that entered data is within expected ranges, matches expected patterns, or is within a valid set of options.
- They can auto-fill information such as current dates, times, and usernames.
- They can ensure that required data fields have not been left empty.
By implementing a well-designed form, we can greatly reduce the amount of human error from the data entry staff. Where do we begin?
Gathering information about the problem
To build a truly effective data entry application, you need to do more than just throw some entry fields on a form. It's important to understand the data and the workflow around the data from all sides of the problem. It's also important to understand the human and technological limitations that you need to accommodate. To do that, we need to speak with a few different parties:
- The originators of the data for the application – in this case, the lab technicians who check the plots in each lab. They can help us understand the significance of the data, the possible values, and the possible outlier situations where the data might need special handling.
- The users of our application – in this case, the data entry staff. We need to understand what the data looks like when they receive it, what their workflow is like for entering the data, what practical or knowledge limitations they face, and ultimately how our software can make their job easier rather than harder.
- The consumers of the data from the application – that is, everyone who will use the CSV files (including you!). What are their expectations for the output of this application? How would they like outlier situations to be handled? What are their goals in keeping and analyzing the data?
- The support staff who are involved with the systems that will run or consume data from your application. What sort of technologies need to be supported? What technological limitations need to be accommodated? What security concerns need to be addressed?
Sometimes these groups overlap, of course. In any case, it's important to think through everyone whose job will be affected by the data and the software, and take their needs into consideration as you design your application. So, before we start coding away, we're going to put together some questions to help us gather these details.
Interviewing the interested parties
The first group you'll talk to are the lab technicians, from whom you'll try find out more detail about the data being recorded. This isn't always as easy as it sounds. Software needs absolute, black-and-white rules when dealing with data; people, on the other hand, tend to think in generalities about their data, and they often don't consider the exact details of limits or edge cases without some prompting. As an application designer, it's your job to come up with questions that will bring out the information you need.
Here are some questions we can ask the lab technicians to learn more about the data:
- What values are acceptable for character fields? Are any of them constrained to a discrete set of values?
- What units are represented by each of the numeric fields?
- Are numeric fields truly number-only fields? Would they ever need letters or symbols?
- What range of numbers is acceptable for each numeric field?
- How is unavailable data (such as from an equipment failure) notated?
Next, let's interview the users of the application. If we're making a program to help reduce user error, we have to understand those users and how they work. In the case of this application, our users will be the data entry staff. We need to ask them questions about their needs and workflow so that we can create an application that works well for them.
Here are some good questions we can ask the data entry staff:
- How is the data formatted when you receive it?
- When is the data received and how soon is it entered? When's the latest it might be entered?
- Are there fields that could be automatically populated? Should users be able to override the automatic values?
- What's the overall technical ability of the users? Are they strong typists, or would they prefer a mouse-driven interface?
- What do you like about the current solution? What do you dislike?
- Do any users have visual or manual impairments that should be accommodated?
Listen to your users! When talking to users about an application design, they may often put forward requests or ideas that are impractical, that don't follow best practice, or that seem frivolous. For example, they may request that a button display an animation under certain conditions, that a particular field be yellow, or that a time field be represented as a set of dropdowns for hours and minutes. Rather than dismissing these ideas, try to understand the reasoning behind them, or the problem that prompted them. It will often uncover aspects of the data and the workflow you did not understand before, and lead to a better solution.
Once we have spoken with our users, it's time to talk to the consumers of our data. In this case, that's you! You already know a good deal about what you need and expect from the data, but even so, it's important to reflect and consider how you would ideally like to receive data from this application. For example:
- Is CSV really the best output format, or is that just what has always been used?
- Does the order of fields in the CSV matter? Are there constraints on the header values (no spaces, mixed case, and so on)?
- How should outlier cases be handled by the application? What should they look like in the data?
- How should different objects like Boolean or date values be represented in the data?
- Is there additional data that should be captured to help you accomplish your goals?
Finally, we need to understand the technology that our application will be working with; that is, the computers, networks, servers, and platforms available to accomplish the task. You come up with the following questions to ask the IT support staff:
- What kind of computer does data entry use? How fast or powerful is it?
- What operating system platform does it run?
- Is Python available on these systems? If so, are there any Python libraries installed?
- What other scripts or applications are involved in the current solution?
- How many users need to use the program at once?
Inevitably, more questions will come up about the data, workflow, and technologies as the development process continues. For that reason, be sure to keep in touch with all these groups and ask more questions as the need arises.
Analyzing what we've found out
You've done all your interviews with the interested parties, and now it's time to look over your notes. You begin by writing down the basic information about operations at ABQ that you already know:
- Your ABQ facility has three greenhouses, each operating with a different climate, marked A, B, and C
- Each greenhouse has 20 plots (labeled 1 through 20)
- There are currently four types of seed samples, each coded with a six-character label
- Each plot has 20 seeds of a given sample planted in it, as well as its own environmental sensor unit
Information from the data originators
Your talk with the lab technicians revealed a lot about the data. Four times a day, at 8:00, 12:00, 16:00, and 20:00, each technician checks the plots in his or her assigned lab. They use a paper form to record information about plants and environmental conditions at each plot, recording all numeric values to no more than two decimal places. This usually takes between 45 and 90 minutes, depending on how far along the plant growth has progressed.
Each plot has its own environmental sensor that detects the light, temperature, and humidity at the plot. Unfortunately, these devices are prone to temporary failure, indicated by an Equipment Fault light on the unit. Since a fault makes the environmental data suspect, they simply cross out the fields in those cases and don't record that data.
They provide you with an example copy of the paper form, which looks like this:
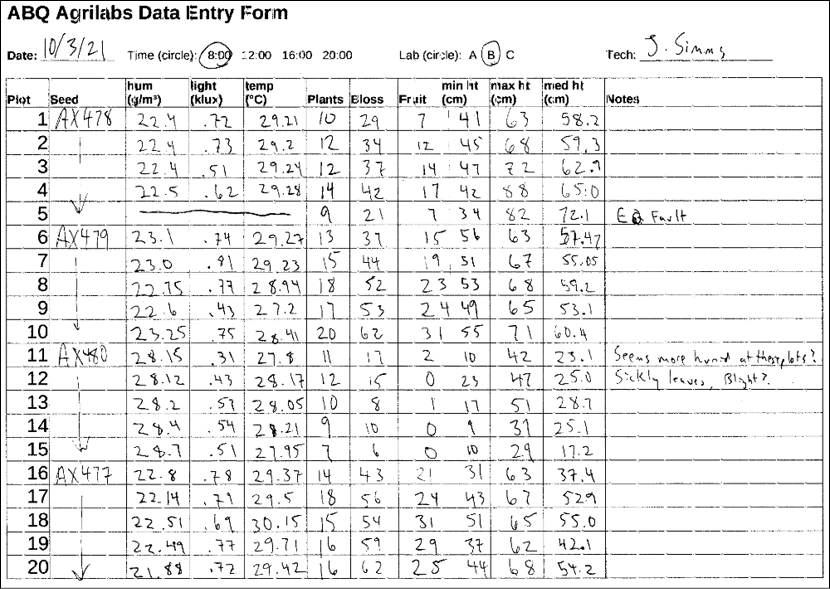
Figure 2.1: Paper form filled out by the lab technicians
Finally, the technicians tell you about the units and possible ranges of data for the fields, which you record in the following chart:
|
Field |
Data type |
Notes |
|
Date |
Date |
The data collection date. Usually the current date. |
|
Time |
Time |
The start of the period during which measurements were taken. One of 8:00, 12:00, 16:00, or 20:00. |
|
Lab |
Character |
The lab ID, either A, B, or C. |
|
Technician |
Text |
The name of the technician recording the data. |
|
Plot |
Integer |
The plot ID, from 1 to 20. |
|
Seed Sample |
Text |
ID string for the seed sample. Always a six-character code containing digits 0 to 9 and capital letters A to Z. |
|
Fault |
Boolean |
True if environmental equipment registered a failure, otherwise False. |
|
Humidity |
Decimal |
The absolute humidity in g/m³, roughly between 0.5 and 52.0. |
|
Light |
Decimal |
The amount of sunlight at the plot center in kilolux, between 0 and 100. |
|
Temperature |
Decimal |
The temperature at the plot, in degrees C; should be between 4 and 40. |
|
Blossoms |
Integer |
The number of blossoms on the plants in a plot. No maximum, but unlikely to approach 1,000. |
|
Fruit |
Integer |
The number of fruits on the plant. No maximum, but unlikely to ever approach 1,000. |
|
Plants |
Integer |
The number of plants in the plot; should be no more than 20. |
|
Max Height |
Decimal |
The height of the tallest plant in the plot, in cm. No maximum, but unlikely to approach 1,000. |
|
Median Height |
Decimal |
The median height of the plants in the plot, in cm. No maximum, but unlikely to approach 1,000. |
|
Min Height |
Decimal |
The height of the smallest plant in the plot, in cm. No maximum, but unlikely to approach 1,000. |
|
Notes |
Long Text |
Additional observations about the plant, data, instruments, and so on. |
Information from the users of the application
Your session with the data entry staff yielded good information about their workflow and practical concerns. You learn that the lab technicians drop off their paper forms as they're completed, from which the data is typically entered right away and usually on the same day as it's handed in.
The data entry staff are currently using a spreadsheet (LibreOffice Calc) to enter the data. They like that they can use copy and paste to bulk-fill fields with repeated data like the date, time, and technician name. They also note that the autocompletion feature of LibreOffice is often helpful in text fields, but sometimes causes accidental data errors in the number fields.
You take these notes about how they enter data from the forms:
- Dates are entered in month/day/year format, since this is how LibreOffice formats them by default with the system's locale setting.
- Time is entered as 24-hour time.
- Technicians are entered as first initial and last name.
- In the case of equipment faults, the environmental data is entered as
N/A. - The CSV file is generally created one lab at a time in plot order (from 1 to 20).
There are four data entry clerks in total, but only one working at any one time; while interviewing the clerks, you learn that one has red-green color blindness, and another has trouble using a mouse due to RSI issues. All are reasonably computer literate and prefer keyboard entry to mouse entry as it allows them to work faster.
One user in particular had some ideas about how your program should look. He suggested doing the labs as a set of checkboxes, and to have separate pop-up dialogs for plant data and environmental data.
Information from technical support
Speaking with IT personnel, you learn that the data entry staff have only a single PC workstation, which they share. It is an older system running Debian GNU/Linux, but it performs adequately. Python3 and Tkinter are already installed as part of the base system, though they are slightly older versions than you have on your workstation. The data entry staff save their CSV data for the current day to a file called abq_data_record.csv. When all the data is entered, the data entry staff have a script they can run to email you the file and build a new, empty file for the next day. The script also backs up the old file with a date-stamp so it can be pulled up later for corrections.
Information from the data consumer
As the main data consumer, it would be pretty easy for you to just stick with what you know already; nevertheless, you take the time to review a recent copy of abq_data_record.csv, which looks something like this:
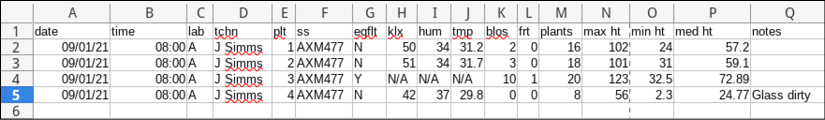
Figure 2.2: The abq_data_record.csv file
In reflecting on this, you realize there are a few changes to the status quo that could make life easier for you as you do your data analysis:
- It would be great to have the files date-stamped right away. Currently, you have an inbox full of files called
abq_data_record.csvand no good way to tell them apart. - It would be helpful if the data in the files were saved in a way that Python could more easily parse without ambiguity. For example, dates are currently saved with the local month/day/year formatting, but ISO-format would be less problematic.
- You'd like a field that indicates explicitly when there is an equipment fault, rather than just implying it with missing environmental data.
- The
N/Ais something you just have to filter out when you process the data. It would be nice if an equipment fault would just blank out the environmental data fields so that the file doesn't contain useless data like that. - The current CSV headers are cryptic, and you're always having to translate them in your report scripts. It would be good to have readable headers.
These changes won't just make your job easier, they will also leave the data in a more usable state than it was before. Legacy data formats like these CSV files are often fraught with artifacts from obsolete software environments or outdated workflows. Improving the clarity and readability of the data will help anyone trying to use it in the future as the lab's usage of the data evolves.
Documenting specification requirements
Now that you've assembled your information about the data, people, and technologies affected by your application, it's time to write up a software specification. Software specifications can range from very formal, contractual documents that include time estimates and deadlines to a simple set of descriptions of what the programmer intends to build. The purpose of the specification is to give everyone involved in the project a point of reference for what the developer will create. It spells out the problem to be solved, the functionality required, and the scope of what the program should and shouldn't do.
Your scenario is rather informal and your application is simple, so you do not need a detailed formal specification in this case. However, a basic write-up of what you know will make sure that you, your employer, and the users all understand the essentials of the application you will be writing.
Contents of a simple specification
We'll start our specification with the following outline of the items we need to write:
- Description: This is one or two sentences that describe the primary purpose, function, and goals of the application. Think of it as the program's mission statement.
- Requirements: This section is a list of specific things the program must be able to do in order to be minimally functional. It can include both functional and non-functional requirements.
- Functional requirements are concrete goals that the program must achieve; for example, the business logic that it must perform or the output format it must produce. Listing these helps us know when our program is ready for production use.
- Non-functional requirements tend to be less specific and focus on user expectations and general goals, for example, usability, performance, or accessibility requirements. Although these aren't always measurable goals, they help to guide the focus of our development.
- Functionality not required: This section is a list of things the program does not need to do; it exists to clarify the scope of the software and make sure nobody expects unreasonable things from the application. We don't need to include every possible thing our application won't do; naturally, our program won't make toast or do the laundry. However, if there are features we are not implementing that users might reasonably expect, this is a good place to clarify what won't be done.
- Limitations: This is a list of constraints under which the program must operate, both technological and human.
- Data dictionary: This is a detailed list of the data fields in the application and their parameters. A data dictionary can get quite lengthy, and may be worthy of a document of its own. It will not only be useful during the development of our application but will become a critical reference to the data produced by the application as the application expands and the data gets utilized in other contexts.
Writing the ABQ data entry program specification
You could write a specification in your favorite word processor, but ideally the specification should be treated as a part of your code; it will need to be kept with the code and synchronized with any changes to the application. For that reason, we're going to write our specification in our code editor using the reStructuredText markup language.
For Python documentation, reStructuredText, or reST, is the official markup language. The Python community encourages the use of reST to document Python projects, and many packaging and publication tools used in the Python community expect the reST format. For an in-depth coverage of reST, see Appendix A, A Quick Primer on reStructuredText, or see the official documentation at https://docutils.sourceforge.io/rst.html.
Let's start with the Description section of our documentation:
======================================
 ABQ Data Entry Program specification
======================================
Description
-----------
This program facilitates entry of laboratory observations
into a CSV file.
Now, let's list the Requirements. Remember that functional requirements are objectively attainable goals, like input and output requirements, calculations that must be done, or features that must be present. Non-functional requirements, on the other hand, are subjective or best-effort goals. Look through your findings from the last section, and consider which needs are which. You should come up with something like the following:
Requirements
----------------------
Functional Requirements:
  * Allow all relevant, valid data to be entered,
    as per the data dictionary.
  * Append entered data to a CSV file:
    - The CSV file must have a filename of
    abq_data_record_CURRENTDATE.csv, where CURRENTDATE is the date
    of the laboratory observations in ISO format (Year-month-day).
    - The CSV file must include all fields
    listed in the data dictionary.
    - The CSV headers will avoid cryptic abbreviations.
  * Enforce correct datatypes per field.
Non-functional Requirements:
  * Enforce reasonable limits on data entered, per the data dict.
  * Auto-fill data to save time.
  * Suggest likely correct values.
  * Provide a smooth and efficient workflow.
  * Store data in a format easily understandable by Python.
Next, we'll reign in the scope of the program with the Functionality Not Required section. Remember that this is only an entry form for now; editing or deletion of data will be handled in the spreadsheet application. We'll clarify this as follows:
Functionality Not Required
--------------------------
The program does not need to:
  * Allow editing of data.
  * Allow deletion of data.
Users can perform both actions in LibreOffice if needed.
For the Limitations section, remember that we have some users with physical constraints, as well as hardware and operating system constraints. It should look something like this:
Limitations
-----------
The program must:
  * Be efficiently operable by keyboard-only users.
  * Be accessible to color blind users.
  * Run on Debian GNU/Linux.
  * Run acceptably on a low-end PC.
Finally, we will write the data dictionary. This is essentially the table we made previously, but we'll break out range, data types, and units for quick reference, as follows:
+------------+--------+----+---------------+--------------------+
|Field       | Type   |Unit| Valid Values  |Description         |
+============+========+====+===============+====================+
|Date        |Date    |    |               |Date of record      |
+------------+--------+----+---------------+--------------------+
|Time        |Time    |    | 8:00, 12:00,  |Time period         |
|            |        |    | 16:00, 20:00  |                    |
+------------+--------+----+---------------+--------------------+
|Lab         |String  |    | A - C         |Lab ID              |
+------------+--------+----+---------------+--------------------+
|Technician  |String  |    |               |Technician name     |
+------------+--------+----+---------------+--------------------+
|Plot        |Int     |    | 1 - 20        |Plot ID             |
+------------+--------+----+---------------+--------------------+
|Seed        |String  |    | 6-character   |Seed sample ID      |
|Sample      |        |    | string        |                    |
+------------+--------+----+---------------+--------------------+
|Fault       |Bool    |    | True, False   |Environmental       |
|            |        |    |               |sensor fault        |
+------------+--------+----+---------------+--------------------+
|Light       |Decimal |klx | 0 - 100       |Light at plot       |
|            |        |    |               |blank on fault      |
+------------+--------+----+---------------+--------------------+
|Humidity    |Decimal |g/m³| 0.5 - 52.0    |Abs humidity at plot|
|            |        |    |               |blank on fault      |
+------------+--------+----+---------------+--------------------+
|Temperature |Decimal |°C  | 4 - 40        |Temperature at plot |
|            |        |    |               |blank on fault      |
+------------+--------+----+---------------+--------------------+
|Blossoms    |Int     |    | 0 - 1000      |No. blossoms in plot|
+------------+--------+----+---------------+--------------------+
|Fruit       |Int     |    | 0 - 1000      |No. fruits in plot  |
+------------+--------+----+---------------+--------------------+
|Plants      |Int     |    | 0 - 20        |No. plants in plot  |
+------------+--------+----+---------------+--------------------+
|Max Height  |Decimal |cm  | 0 - 1000      |Height of tallest   |
|            |        |    |               |plant in plot       |
+------------+--------+----+---------------+--------------------+
|Min Height  |Decimal |cm  | 0 - 1000      |Height of shortest  |
|            |        |    |               |plant in plot       |
+------------+--------+----+---------------+--------------------+
|Median      |Decimal |cm  | 0 - 1000      |Median height of    |
|Height      |        |    |               |plants in plot      |
+------------+--------+----+---------------+--------------------+
|Notes       |String  |    |               |Miscellaneous notes |
+------------+--------+----+---------------+--------------------+
That's our specification for now! The specification is very likely to grow, change, or evolve in complexity as we discover new needs, but it gives us a great starting point for designing the first version of our application.
Designing the application
With our specification in hand and our requirements clear, it's time to start designing our solution. The main focus of our application is the data entry form itself, so we'll begin with that GUI component.
We're going to create a basic design for our form in three steps:
- Determine the appropriate input widget type for each data field
- Group together related items to create a sense of organization
- Lay out our widgets within their groups
Deciding on input widgets
Without committing ourselves to a particular GUI library or widget set, we can start our form design by deciding on an appropriate input widget type for each field. Most toolkits come with the same basic types of inputs for different types of data.
We've already seen some of these in our look at Tkinter, but let's see what sort of options are likely to be available:
|
Widget type |
Tkinter example |
Used for |
|
Line entry |
|
Single-line strings |
|
Number entry |
|
Integer or decimal values |
|
Select list (drop-down) |
|
Choice between many distinct values |
|
Check box |
|
True/false value |
|
Radio button |
|
Choice between a few distinct values |
|
Text entry |
|
Multi-line text entry |
|
Date entry |
(None specific) |
Dates |
Looking at our data dictionary, what sort of widgets should we pick out for each of our fields? Let's consider:
- There are several decimal fields, many with clear boundary ranges, like Min Height, Max Height, Median Height, Humidity, Temperature, and Light. We'll need some kind of number entry, perhaps a Tkinter
Spinbox, for these. - There are also some integer fields, such as Plants, Blossoms, and Fruit. Again, a number entry like the
Spinboxwidget is the right choice. - There are a couple of fields with a limited set of possible values: Time and Lab. For these we could go with radio buttons or a select list of some kind. It really depends on the number of options and how we want to lay it out: radio buttons take a lot of space with more than a few choices, but select list widgets take additional interaction and slow down a user. We'll choose a select/drop-down for the Time field, and radio buttons for the Lab field.
- The Plot field is a tricky case. At face value, it looks like an integer field, but think about it: the plots could just as well be identified by letters, or symbols, or names. Numbers just happen to be an easy set of values with which to assign arbitrary identifiers. The Plot ID, like the Lab ID, is actually a constrained set of values; so, it would make more sense to use a select list here.
- The Notes field is multiline text, so the Text widget is appropriate here.
- There is one Boolean field, Fault. A check box type widget is a good choice here, especially since this value is normally false and represents an exceptional circumstance.
- For the Date field, it would be nice to use a date entry of some sort. We don't know of one in Tkinter yet, but we'll see if we can solve that when we write our application.
- The remaining lines are simple, one-line character fields. We'll use a text entry-type widget for those fields.
Our final analysis comes to the following:
|
Field |
Widget type |
|
Date |
Date entry |
|
Time |
Select list |
|
Lab |
Radio buttons |
|
Technician |
Text entry |
|
Plot |
Select list |
|
Seed Sample |
Text entry |
|
Fault |
Check box |
|
Humidity |
Number entry |
|
Light |
Number entry |
|
Temperature |
Number entry |
|
Blossoms |
Number entry |
|
Fruit |
Number entry |
|
Plants |
Number entry |
|
Max Height |
Number entry |
|
Median Height |
Number entry |
|
Min Height |
Number entry |
|
Notes |
Text entry |
Bear in mind, this analysis is not set in stone; it will almost certainly be revised as we receive feedback from our users, as the application's use case evolves, or as we become more familiar with the capabilities and limitations of Python and Tkinter. This is simply a starting place from which we can create an initial design.
Grouping our fields
Humans tend to get confused when staring at a huge wall of inputs in no particular order. You can do your users a big favor by breaking up the input form into sets of related fields. Of course, that assumes that your data has related sets of fields, doesn't it? Does our data have groups?
Recall some of the information we gathered during our interviews:
- One of the employees requested separate forms for "environmental data" and "plant data"
- The layout of the paper form has Time, Date, Lab, and Technician, all together at the top; these things help identify the data recording session
Details like this tell you a lot about how your users think about their data, and that should inform how the application presents that data.
Considering all this, you identify the following related groups:
- The Date, Lab, Plot, Seed Sample, Technician, and Time fields are identifying data or metadata about the record itself. You could group these together under a heading calling Record Information.
- The Blossoms, Fruit, three Height fields, and Plants fields are all measurements that have to do with the plants in the Plot field. You could group these together under the heading Plant Data.
- The Humidity, Light, Temperature, and Equipment Fault fields are all information from the environmental sensor. You could group these as Environmental Data.
- The Notes field could be related to anything, so it's in a category of its own.
Most GUI libraries offer a variety of ways to group sections of a form together; think of some you have seen. A few are listed in this table:
|
Widget type |
Description |
|
Tabs (notebook) |
Allows multiple tabbed pages that the user can switch between |
|
Frames/boxes |
Draws boxes around sections of a form, sometimes with a header |
|
Accordion |
Divides a form into sections that can be hidden or expanded one at a time |
Framed boxes are the simplest way to break up a GUI. In cases where there are a lot of fields, a tabbed or accordion widget can help by hiding fields the user isn't working with. However, they require additional user interaction to switch between pages or sections. You decide, after some consideration, that framed boxes with headers will be perfectly adequate for this form. There are not really enough fields to justify separate pages, and switching between them would just add more overhead to the data entry process.
Laying out the form
So far, we know that we have 17 inputs, which are grouped as follows:
- Six fields under Record Information
- Four fields under Environmental Data
- Six fields under Plant Data
- One large Notes field
We want to group the preceding inputs using some kind of box or frame with a header label. Notice that two of the first three sections have widgets in multiples of three. That suggests that we could arrange them in a grid with three items across. How should we order the fields within each group?
Ordering of fields seems like a trivial item, but for the user it can make a significant difference in usability. Users who have to jump around a form haphazardly to match their workflow are more likely to make mistakes.
As you learned, the data is entered from paper forms filled out by the lab technicians. Refer back to the screenshot of the paper form shown in Figure 2.1 in the previous section. It looks like items are mostly grouped the way our records are grouped, so we'll use the ordering on this form to order our fields. That way, data entry clerks can zip right through the form from top to bottom, left to right, without having to bounce around the screen.
Remember, user workflow is important! When designing a new application to replace some part of an existing procedure, it's crucial to respect the established workflow. While improving the status quo may require adjusting the workflow, be careful that you aren't making someone else's job harder without a good reason.
One last consideration in our design is where to place field labels in relation to the fields. There is a good deal of debate in the UI design community over the best placement of labels, but the consensus is that one of the following two options is best:
- Labels above fields
- Labels to the left of fields
You might try sketching out both to see which you prefer, but for this application, labels above fields will probably work better for the following reasons:
- Since both fields and labels are rectangular in shape, our form will be more compact by stacking them
- It's a lot easier to make the layout work, since we don't have to find a label width that works for all the labels without distancing them too far from the fields
The one exception is the check button field; check buttons are typically labeled to the right of the widget.
Take a moment to make a mockup of your form, using paper and pencil, or a drawing program if you prefer. Your form should look something like this:
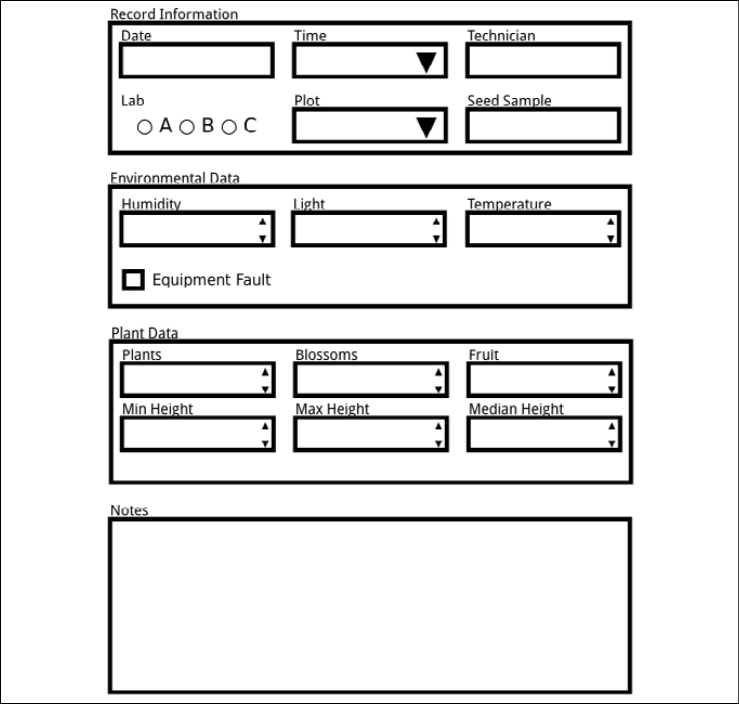
Figure 2.3: The form layout
Laying out the application
With your form designed, it's time to consider the rest of the application's GUI:
- You'll need a save button to trigger storage of the entered data.
- It's customary to include a button to reset the form, so the user can start over if needed.
- Sometimes, we might need to provide status information to the user. For example, we might want to let them know when a record was successfully saved, or if there is an error in a particular field. Applications typically have a status bar that displays these kinds of messages at the bottom of the window.
- Finally, it might be good to have a header indicating what the form is.
Adding the following things to our sketch, we have something like the following screenshot:
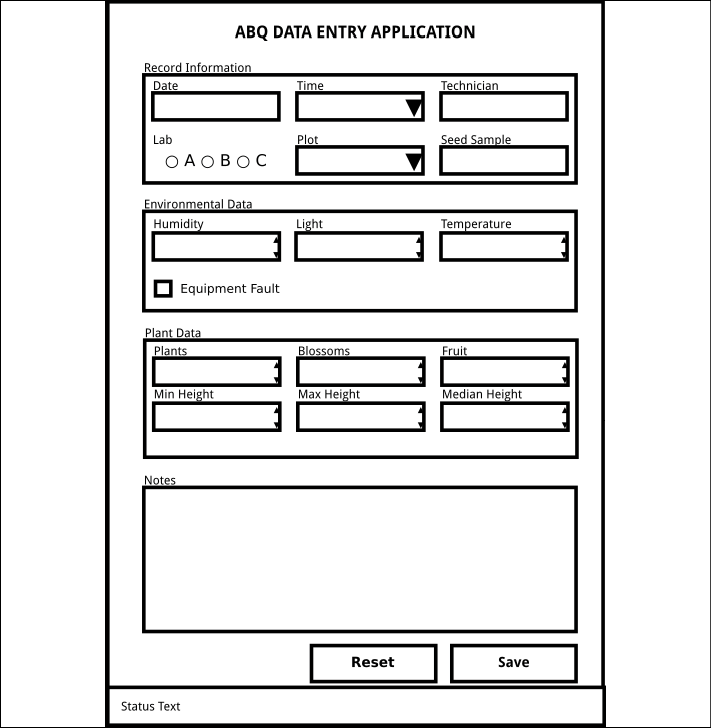
Figure 2.4: The application layout
Looks good! Your final step is to show these designs to your users and the director for any feedback or approval. Good luck!
Keep stakeholders – your boss, users, and others who will be affected by your program – involved as much as possible in your application design process. This reduces the possibility that you'll have to go back and redesign your application later.
Evaluating technology options
Before we start coding, let's take a moment to evaluate the technology choices available to implement this design.
Naturally, we're going to build this form using Python and Tkinter, because that's what this book is about. However, in a real-world situation it's worth asking whether Tkinter is really a good choice of technology for the application. Many criteria come into play when making decisions about languages, libraries, and other technologies used in implementing an application, including performance, feature availability, cost and license, platform support, and developer knowledge and confidence.
Let's evaluate the situation with our ABQ application according to these criteria:
- Performance: This will not be a high-performance application. There are no computationally demanding tasks, and high speed is not critical. Python and Tkinter will work perfectly fine in terms of performance.
- Feature availability: Your application needs to be able to display basic form fields, validate the data entered, and write it to CSV. Tkinter can handle these front-end requirements, and Python can handle the CSV file easily. You are a little concerned about Tkinter's lack of a dedicated date entry field, but this may be something we can work around.
- Cost and license: This project isn't going to be distributed or sold, so licenses are not a big concern. There is no budget for the project, though, so whatever you use will need to be free from any financial cost. Both Python and Tkinter are free and liberally licensed, so in any case this is not a concern.
- Platform support: You will be developing the application on a Windows PC, but it will need to run on Debian Linux, so the choice of GUI should be cross-platform. The computer it will run on is old and slow, so your program needs to be frugal with resources. Python and Tkinter check both boxes here.
- Developer knowledge and confidence: Your expertise is in Python, but you have little experience in creating GUIs. For the fastest time to delivery, you need an option that works well with Python and isn't complicated to learn. You also want something established and stable, as you won't have time to keep up with new developments in the toolkit. Tkinter is a good fit here.
Don't take your own skills, knowledge, and comfort level with the technology out of the equation here! While it's good to make objective choices and recognize your personal biases toward things you already know, it's equally important to recognize that your ability to confidently deliver and maintain a product is a critical factor in your evaluation.
Given the options available for Python, Tkinter is a good choice for this application. It's easy to learn, lightweight, free, readily available on both your development and target platforms, and provides the basic functionality necessary for our data entry form. Having settled this question, it's time to take a deeper look into Tkinter to find what we'll need to build this application.
Python has other options for GUI development, including PyQt, Kivy, and wxPython. These have different strengths and weaknesses compared to Tkinter, but if you find Tkinter doesn't fit well for a project, one of these might be a better option.
Summary
In this chapter, you worked through the first two phases of application development: understanding the problem and designing a solution. You learned how to develop an application specification by interviewing users and examining the data and requirements, created an optimal form layout for your users, and learned about the different types of widgets available in GUI frameworks for dealing with different kinds of input data. After creating the specification, you evaluated Tkinter to see if it was an appropriate technology. Most importantly, you learned that developing an application doesn't begin with code, but with research and planning.
In the next chapter, you'll create a basic implementation of your designs with Tkinter and Python. You'll learn about a new widget set, Ttk, and use it along with some Tkinter widgets we've already met to create the form and the application.