Download code from GitHub
Data Science Terminology
We live in the Data Age. No matter the industry you work in, be it IT, fashion, food, or finance, there is no doubt that data affects your life and work. At some point today, this week, or this month, you will either have or hear about a conversation about data. News outlets are covering more and more stories about data leaks, cybercrimes, and how modern artificial intelligence and machine learning algorithms are changing the way we work and live.
In this book, we will attempt to cover, to put it simply, the principles of how we should interpret, interact with, manipulate, and utilize data. We will attempt to cover the principles of data science. Before we can begin covering such a huge topic, first, we have to build a solid foundation below our feet.
To begin our journey, this chapter will explore the terminology and vocabulary of the modern data scientist. We will learn keywords and phrases that will be essential in our discussion of data science throughout this book. We will also learn why we use data science and learn about the three key domains that data science is derived from before we begin to look at the code in Python, the primary language that will be used in this book.
This chapter will cover the following topics:
- The basic terminology of data science
- The three domains of data science
- The basic Python syntax
What is data science?
This is a simple question, but before we go any further, let’s look at some basic definitions that we will use throughout this book. The great/awful thing about the field of data science is that it is young enough that sometimes, even basic definitions and terminology can be debated across publications and people. The basic definition is that data science is the process of acquiring knowledge through data.
It may seem like a small definition for such a big topic, and rightfully so! Data science covers so many things that it would take pages to list them all out. Put another way, data science is all about how we take data, use it to acquire knowledge, and then use that knowledge to do the following:
- Make informed decisions
- Predict the future
- Understand the past/present
- Create new industries/products
This book is all about the methods of data science, including how to process data, gather insights, and use those insights to make informed decisions and predictions.
Understanding basic data science terminology
The definitions that follow are general enough to be used in daily conversations and work to serve the purpose of this book, which is an introduction to the principles of data science.
Let’s start by defining what data is. This might seem like a silly first definition to look at, but it is very important. Whenever we use the word “data,” we refer to a collection of information in either a structured or unstructured format. These formats have the following qualities:
- Structured data: This refers to data that is sorted into a row/column structure, where every row represents a single observation and the columns represent the characteristics of that observation
- Unstructured data: This is the type of data that is in a free form, usually text or raw audio/signals that must be parsed further to become structured
Data is everywhere around us and originates from a multitude of sources, including everyday internet browsing, social media activities, and technological processes such as system logs. This data, when structured, becomes a useful tool for various algorithms and businesses. Consider the data from your online shopping history. Each transaction you make is recorded with details such as the product, price, date and time, and payment method. This structured information, laid out in rows and columns, forms a clear picture of your shopping habits, preferences, and patterns.
Yet not all data comes neatly packaged. Unstructured data, such as comments and reviews on social media or an e-commerce site, don’t follow a set format. They might include text, images, or even videos, making it more challenging to organize and analyze. However, once processed correctly, this free-flowing information offers valuable insights such as sentiment analysis, providing a deeper understanding of customer attitudes and opinions. In essence, the ability to harness both structured and unstructured data is key to unlocking the potential of the vast amounts of information we generate daily.
Opening Excel, or any spreadsheet software, presents you with a blank grid meant for structured data. It’s not ideally suited for handling unstructured data. While our primary focus will be structured data, given its ease of interpretation, we won’t overlook the richness of raw text and other unstructured data types, and the techniques to make them comprehensible.
The crux of data science lies in employing data to unveil insights that would otherwise remain hidden. Consider a healthcare setting, where data science techniques can predict which patients are likely not to attend their appointments. This not only optimizes resource allocation but also ensures other patients can utilize these slots. Understanding data science is more than grasping what it does – it’s about appreciating its importance and recognizing why mastering it is in such high demand.
Why data science?
Data science won’t replace the human brain (at least not for a while), but rather augment and complement it, working alongside it. Data science should not be thought of as an end-all solution to our data woes; it is merely an opinion – a very informed opinion, but still an opinion, nonetheless. It deserves a seat at the table.
In this Data Age, it’s clear that we have a surplus of data. But why should that necessitate an entirely new set of vocabulary? What was wrong with our previous forms of analysis? For one, the sheer volume of data makes it impossible for a human to parse it in a reasonable time frame. Data is collected in various forms and from different sources and often comes in a very unstructured format.
Data can be missing, incomplete, or just flat-out wrong. Oftentimes, we will have data on very different scales, and that makes it tough to compare it. Say we are looking at data concerning pricing used cars. One characteristic of a car is the year it was made, and another might be the number of miles on that car. Once we clean our data (which we will spend a great deal of time looking at in this book), the relationships between the data become more obvious, and the knowledge that was once buried deep in millions of rows of data simply pops out. One of the main goals of data science is to make explicit practices and procedures to discover and apply these relationships in the data.
Let’s take a minute to discuss its role today using a very relevant example.
Example – predicting COVID-19 with machine learning
A large component of this book is about how we can leverage powerful machine learning algorithms, including deep learning, to solve modern and complicated tasks. One such problem is using deep learning to be able to aid in the diagnosis, treatment, and prevention of fatal illnesses, including COVID-19. Since the global pandemic erupted in 2020, numerous organizations around the globe turned to data science to alleviate and solve problems related to COVID-19. For example, the following figure shows a visualization of a process for using machine learning (deep learning, in this case) to screen for COVID-19 that was published in March 2020. By then, the world had only known of COVID-19 for a few months, and yet we were able to apply machine learning techniques to such a novel use case with relative ease:

Figure 1.1 – A visualization of a COVID-19 screening algorithm based on deep learning from 2020
This screening algorithm was one of the first of its kind working to identify COVID-19 and recognize it from known illnesses such as the flu. Algorithms like these suggested that we could turn to data and machine learning to aid when unforeseen catastrophes strike. We will learn how to develop algorithms such as this life-changing system later in this book. Creating such algorithms takes a combination of three distinct skills that, when combined, form the backbone of data science. It requires people who are knowledgeable about COVID-19, people who know how to create statistical models, and people who know how to productionize those models so that people can benefit from them.
The data science Venn diagram
It is a common misconception that only those with advanced degrees such as a Ph.D. or math prodigies can understand the math/programming behind data science. This is false. Understanding data science begins with three basic areas:
- Math/statistics: This involves using equations and formulas to perform analysis
- Computer programming: This is the ability to use code to create outcomes on a computer
- Domain knowledge: This refers to understanding the problem domain (medicine, finance, social science, and so on)
The following Venn diagram provides a visual representation of how these three areas of data science intersect:
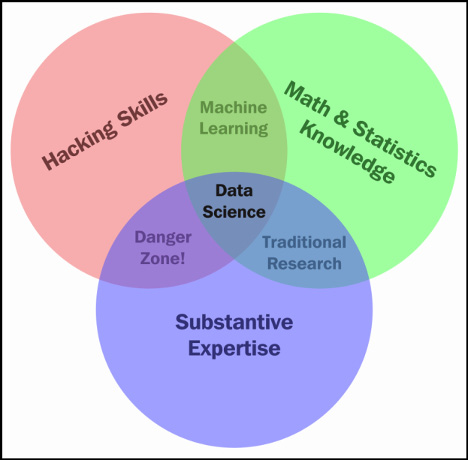
Figure 1.2 – The Venn diagram of data science
Those with hacking skills can conceptualize and program complicated algorithms using computer languages. Having a math and statistics background allows you to theorize and evaluate algorithms and tweak the existing procedures to fit specific situations. Having substantive expertise (domain expertise) allows you to apply concepts and results in a meaningful and effective way.
While having only two of these three qualities can make you intelligent, it will also leave a gap. Let’s say that you are very skilled in coding and have formal training in day trading. You might create an automated system to trade in your place but lack the math skills to evaluate your algorithms. This will mean that you end up losing money in the long run. It is only when you boost your skills in coding, math, and domain knowledge that you can truly perform data science.
The quality that was probably a surprise for you was domain knowledge. It is just knowledge of the area you are working in. If a financial analyst started analyzing data about heart attacks, they might need the help of a cardiologist to make sense of a lot of the numbers.
Data science is the intersection of the three key areas mentioned earlier. To gain knowledge from data, we must be able to utilize computer programming to access the data, understand the mathematics behind the models we derive, and, above all, understand our analyses’ place in the domain we are in. This includes the presentation of data. If we are creating a model to predict heart attacks in patients, is it better to create a PDF of information or an app where we can type in numbers and get a quick prediction? All these decisions must be made by the data scientist.
The intersection of math and coding is machine learning. This book will look at machine learning in great detail later on, but it is important to note that without the explicit ability to generalize any models or results to a domain, machine learning algorithms remain just that – algorithms sitting on your computer. You might have the best algorithm to predict cancer. You could be able to predict cancer with over 99% accuracy based on past cancer patient data, but if you don’t understand how to apply this model in a practical sense so that doctors and nurses can easily use it, your model might be useless.
Both computer programming and math will be covered extensively in this book. Domain knowledge comes with both the practice of data science and reading examples of other people’s analyses.
The math
Most people stop listening once someone says the word “math.” They’ll nod along in an attempt to hide their utter disdain for the topic but hear me out. As an experienced math teacher, I promise that this book will guide you through the math needed for data science, specifically statistics and probability. We will use these subdomains of mathematics to create what are called models. A data model refers to an organized and formal relationship between elements of data, usually meant to simulate a real-world phenomenon.
The central idea of using math is that we will use it to formalize relationships between variables. As a former pure mathematician and current math teacher, I know how difficult this can be. I will do my best to explain everything as clearly as I can. Of the three areas of data science, math is what allows us to move from domain to domain. Understanding the theory allows us to apply a model that we built for the fashion industry to a financial domain.
The math covered in this book ranges from basic algebra to advanced probabilistic and statistical modeling. Do not skip over these chapters, even if you already know these topics or you’re afraid of them. Every mathematical concept that I will introduce will be introduced with care and purpose, using examples. The math in this book is essential for data scientists.
There are many types of data models, including probabilistic and statistical models. Both of these are subsets of a larger paradigm, called machine learning. The essential idea behind these three topics is that we use data to come up with the best model possible. We no longer rely on human instincts – rather, we rely on data. Math and coding are vehicles that allow data scientists to step back and apply their skills virtually anywhere.
Computer programming
Let’s be honest: you probably think computer science is way cooler than mathematics. That’s OK, I don’t blame you. The news isn’t filled with math news like it is with news on technology (although I think that’s a shame). You don’t turn on the TV to see a new theory on primes or about Euler’s equation – rather, you see investigative reports on how the latest smartphone can take better photos of cats or how generative AI models such as ChatGPT can learn to create websites from scratch. Computer languages are how we communicate with machines and tell them to do our bidding. A computer speaks many languages and, like a book, can be written in many languages; similarly, data science can also be done in many languages. Python, Julia, and R are some of the many languages that are available to us. This book will exclusively use Python.
Why Python?
We will use Python for a variety of reasons, listed as follows:
- Python is an extremely simple language to read and write, even if you’ve never coded before, which will make future examples easy to understand and read later on, even after you have read this book.
- It is one of the most common languages, both in production and in an academic setting (one of the fastest growing, as a matter of fact).
- The language’s online community is vast and friendly. This means that a quick search for the solution to a problem should yield many people who have faced and solved similar (if not the same) situations.
- Python has prebuilt data science modules that both novice and veteran data scientists can utilize.
The last point is probably the biggest reason we will focus on Python. These pre built modules are not only powerful but also easy to pick up. By the end of the first few chapters, you will be very comfortable with these modules. Some of these modules include the following:
- pandas
- PyTorch
- Scikit-learn
- Seaborn
- NumPy/scipy
- Requests (to mine data from the web)
- BeautifulSoup (for web-HTML parsing)
We will assume that you have basic Python coding skills. This includes the ability to recognize and use the basic types (int, float, boolean, and so on) and create functions and classes with ease. We will also assume that you have mastery over logistical operators, including ==, >=, and <=.
Example – parsing a single tweet
Here is some Python code that should be readable to you. In this example, I will be parsing some tweets about stock prices. If you can follow along with this example easily, then you are ready to proceed!
tweet = "RT @j_o_n_dnger: $TWTR now top holding for Andor, unseating $AAPL"
words_in_tweet = tweet.split(' ') # list of words in tweet
for word in words_in_tweet: # for each word in list
 if "$" in word: # if word has a "cashtag"
  print("THIS TWEET IS ABOUT", word) # alert the user
I will point out a few things about this code snippet line by line, as follows:
- First, we set a variable to hold some text (known as a string in Python). In this example, the tweet in question is
RT @robdv: $TWTR now top holding for Andor,unseating $AAPL. - The
words_in_tweetvariable tokenizes the tweet (separates it by word). If you were to print this variable, you would see the following:['RT', '@robdv:', '$TWTR', 'now', 'top', 'holding', 'for', 'Andor,', 'unseating', '$AAPL']
- We iterate through this list of words using a
forloop, going through the list one by one. - Here, we have another
ifstatement. For each word in this tweet, if the word contains the$character, this represents stock tickers on Twitter.if "$" in word: # if word has a "cashtag"
- If the preceding
ifstatement isTrue(that is, if the tweet contains a cashtag), print it and show it to the user.The output of this code will be as follows:
THIS TWEET IS ABOUT $TWTR
THIS TWEET IS ABOUT $AAPL
Whenever I use Python in this book, I will ensure that I am as explicit as possible about what I am doing in each line of code. I know what it’s like to feel lost in code. I know what it’s like to see someone coding and want them to just slow down and explain what is going on.
As someone who is entirely self-taught in Python and has also taught Python at the highest levels, I promise you that I will do everything in my power to not let you feel that way when reading this book.
Domain knowledge
As I mentioned earlier, domain knowledge focuses mainly on knowing the particular topic you are working on. For example, if you are a financial analyst working on stock market data, you have a lot of domain knowledge. If you are a journalist looking at worldwide adoption rates, you might benefit from consulting an expert in the field. This book will attempt to show examples from several problem domains, including medicine, marketing, finance, and even UFO sightings!
Does this mean that if you’re not a doctor, you can’t work with medical data? Of course not! Great data scientists can apply their skills to any area, even if they aren’t fluent in it. Data scientists can adapt to the field and contribute meaningfully when their analysis is complete.
A big part of domain knowledge is presentation. Depending on your audience, it can matter greatly how you present your findings. Your results are only as good as your vehicle of communication. You can predict the movement of the market with 99.99% accuracy, but if your program is impossible to execute, your results will go unused. Likewise, if your vehicle is inappropriate for the field, your results will go equally unused. I know I’m throwing a lot at you already, but we should look at just a few more relevant terminologies so that we can hit the ground running.
Some more terminology
At this point, you’re probably excitedly looking up a lot of data science material and seeing words and phrases I haven’t used yet. Here are some common terms that you are likely to encounter:
- Machine learning: This refers to giving computers the ability to learn from data without explicit “rules” being given by a programmer. Earlier in this chapter, we saw the concept of machine learning as the union of someone who has both coding and math skills. Here, we are attempting to formalize this definition. Machine learning combines the power of computers with intelligent learning algorithms to automate the discovery of relationships in data and create powerful data models.
- Statistical model: This refers to taking advantage of statistical theorems to formalize relationships between data elements in a (usually) simple mathematical formula.
- Exploratory data analysis (EDA): This refers to preparing data to standardize results and gain quick insights. EDA is concerned with data visualization and preparation. This is where we turn unstructured data into structured data and clean up missing/incorrect data points. During EDA, we will create many types of plots and use these plots to identify key features and relationships to exploit in our data models.
- Data mining: This is the process of finding relationships between elements of data. Data mining is the part of data science where we try to find relationships between variables (think the spawn-recruit model).
I have tried pretty hard not to use the term big data up until now. This is because I think this term is misused – a lot. Big data is data that is too large to be processed by a single machine (if your laptop crashed, it might be suffering from a case of big data).
The following diagram shows the relationship between these data science concepts.

Figure 1.3 – The state of data science (so far)
With these terms securely stored in our brains, we can move on to the main educational resource in this book: data science case studies.
Data science case studies
We will spend much of this book looking at real-life examples of using data science and machine learning. The combination of math, computer programming, and domain knowledge is what makes data science so powerful but it can often be too abstract without concrete coding examples.
Oftentimes, it is difficult for a single person to master all three of these areas. That’s why it’s very common for companies to hire teams of data scientists instead of a single person. Let’s look at a few powerful examples of data science in action and its outcomes.
Case study – automating government paper pushing
Social security claims are known to be a major hassle for both the agent reading them and the person who wrote the claims. Some claims take over two years to get resolved in their entirety, and that’s absurd! Let’s look at the following figure, which shows what goes into a claim:

Figure 1.4 – Sample social security form
Not bad. It’s mostly just text, though. Fill this in, then that, then this, and so on. You can see how it would be difficult for an agent to read these all day, form after form. There must be a better way!
Well, there is. Elder Research Inc. parsed this unstructured data and was able to automate 20% of all disability social security forms. This means that a computer could look at 20% of these written forms and give its opinion on the approval.
Apart from this, the third-party company that is hired to rate the approvals of the forms gave the machine-graded forms a higher grade than the human forms. So, not only did the computer handle 20% of the load on average, but it also did better than a human.
Modern language models such as GPT-3 and BERT have taken the world of NLP by storm by pushing the boundaries of what we thought was possible way beyond its previously considered limits. We will spend a lengthy amount of time talking about these models later in this book.
Fire all humans, am I right?
Before I get a load of angry emails and tweets claiming that data science is bringing about the end of human workers, keep in mind that the computer was only able to handle 20% of the load in our previous example. This means that it probably performed terribly on 80% of the forms! This is because the computer was probably great at simple forms. The claims that would have taken a human minutes to compute took the computer seconds. But these minutes add up, and before you know it, each human is being saved over an hour a day!
Forms that might be easy for a human to read are also likely easy for the computer. It’s when the forms are very terse, or when the writer starts deviating from the usual grammar, that the computer starts to fail. This model is great because it lets humans spend more time on those difficult claims and give them more attention without getting distracted by the sheer volume of papers.
Note that I used the word “model.” Remember that a model is a relationship between elements. In this case, the relationship is between written words and the approval status of a claim.
Case study – what’s in a job description?
Looking for a job in data science? Great! Let me help. In this case study, I have scraped (used code to read from the web) 1,000 job descriptions for companies that are actively hiring data scientists. The goal here is to look at some of the most common keywords that people use in their job descriptions, as shown in the following screenshot:

Figure 1.5 – An example of data scientist job listings
In the following Python code, the first two imports are used to grab web data from Indeed.com, and the third import is meant to simply count the number of times a word or phrase appears, as shown in the following code:
import requests
from bs4 import BeautifulSoup
from sklearn.feature_extraction.text import CountVectorizer
# grab postings from the web
texts = []
# cycle through 100 pages of indeed job resources
for i in range(0,1000,10):
 response = requests.get('http://www.indeed.com/jobs?q=data+scientist&sta rt='+str(i)).text
 soup  = BeautifulSoup(response)
 texts += [a.text for a in soup.findAll('span', {'class':'summary'})]
print(type(texts))
print(texts[0]) # first job description
All this loop is doing is going through 100 pages of job descriptions, and for each page, it is grabbing each job description. The important variable here is texts, which is a list of over 1,000 job descriptions, as shown in the following code:
type(texts) # == list
vectorizer = CountVectorizer(ngram_range=(1,2), stop_words='english')
# Get basic counts of one and two word phrases
matrix = vectorizer.fit_transform(texts)
# fit and learn to the vocabulary in the corpus
print len(vect.get_feature_names()) # how many features there are
There are 10,857 total one- and two-word phrases in my case! Since web pages are scraped in real time and these pages may change when you run this code, you may get a different number than 10,857.
I have omitted some code here because we will cover these packages in more depth in our NLP chapters later, but it exists in the GitHub repository for this book. The results are as follows (represented by the phrase and then the number of times it occurred):

Figure 1.6 – The top one- and two-word phrases when looking at job descriptions on Indeed for the title of “Data Scientist”
There are many interesting things to note about this case study, but the biggest takeaway is that there are many keywords and phrases that make up a data science role. It isn’t just math, coding, or domain knowledge; it truly is a combination of these three ideas (whether exemplified in a single-person team or across a multi-person team) that makes data science possible and powerful.
Summary
In this chapter, we explored basic data science terminology and saw how even the term “data science” can be fraught with ambiguity and misconception. We also learned that coding, math, and domain expertise are the fundamental building blocks of data science. As we seek new and innovative ways to discover data trends, a beast lurks in the shadows. I’m not talking about the learning curve of mathematics or programming, nor am I referring to the surplus of data. The Industrial Age left us with an ongoing battle against pollution. The subsequent Information Age left behind a trail of big data. So, what dangers might the Data Age bring us?
The Data Age can lead to something much more sinister – the dehumanization of the individual through mass data and the rise of automated bias in machine learning systems.
More and more people are jumping headfirst into the field of data science, most with no prior experience in math or computer science, which, on the surface, is great. The average data scientist has access to millions of dating profiles’ data, tweets, online reviews, and much more to jump-start their education. However, if you jump into data science without the proper exposure to theory or coding practices, and without respect for the domain you are working in, you face the risk of oversimplifying the very phenomenon you are trying to model.
Now, it’s time to begin. In the next chapter, we will explore the different types of data that exist in the world, ranging from free-form text to highly structured row/column files. We will also look at the mathematical operations that are allowed for different types of data, as well as deduce insights based on the form the data comes in.