


Pentaho Data Integration is an engine along with a suite of tools responsible for the processes of extracting, transforming, and loading—best known as the ETL processes. This book is meant to teach you how to use PDI.
In this chapter you will:
Learn what Pentaho Data Integration is
Install the software and start working with the PDI graphical designer
Install MySQL, a database engine that you will use when you start working with databases
Before introducing PDI, let's talk about Pentaho BI Suite. The Pentaho Business Intelligence Suite is a collection of software applications intended to create and deliver solutions for decision making. The main functional areas covered by the suite are:
Analysis: The analysis engine serves multidimensional analysis. It's provided by the Mondrian OLAP server and the JPivot library for navigation and exploring.
Reporting: The reporting engine allows designing, creating, and distributing reports in various known formats (HTML, PDF, and so on) from different kinds of sources. The reports created in Pentaho are based mainly in the JFreeReport library, but it's possible to integrate reports created with external reporting libraries such as Jasper Reports or BIRT.
Data Mining: Data mining is running data through algorithms in order to understand the business and do predictive analysis. Data mining is possible thanks to the Weka Project.
Dashboards: Dashboards are used to monitor and analyze Key Performance Indicators (KPIs). A set of tools incorporated to the BI Suite in the latest version allows users to create interesting dashboards, including graphs, reports, analysis views, and other Pentaho content, without much effort.

Data integration: Data integration is used to integrate scattered information from different sources (applications, databases, files) and make the integrated information available to the final user. Pentaho Data Integration—our main concern—is the engine that provides this functionality.
All this functionality can be used standalone as well as integrated. In order to run analysis, reports, and so on integrated as a suite, you have to use the Pentaho BI Platform. The platform has a solution engine, and offers critical services such as authentication, scheduling, security, and web services.
This set of software and services forms a complete BI Platform, which makes Pentaho Suite the world's leading open source Business Intelligence Suite.
Despite being out of the scope of this book, it's worth to briefly introduce the Pentaho Demo. The Pentaho BI Platform Demo is a preconfigured installation that lets you explore several capabilities of the Pentaho platform. It includes sample reports, cubes, and dashboards for Steel Wheels. Steel Wheels is a fictional store that sells all kind of scale replicas of vehicles.
The demo can be downloaded from http://sourceforge.net/projects/pentaho/files/. Under the Business Intelligence Server folder, look for the latest stable version. The file you have to download is named biserver-ce-3.5.2.stable.zip for Windows and biserver-ce-3.5.2.stable.tar.gz for other systems.
In the same folder you will find a file named biserver-getting_started-ce-3.5.0.pdf. The file is a guide that introduces you the platform and gives you some guidance on how to install and run it. The guide even includes a mini tutorial on building a simple PDI input-output transformation.
Note
You can find more about Pentaho BI Suite at www.pentaho.org.
Most of the Pentaho engines, including the engines mentioned earlier, were created as community projects and later adopted by Pentaho. The PDI engine is no exception—Pentaho Data Integration is the new denomination for the business intelligence tool born as Kettle.
Note
The name Kettle didn't come from the recursive acronym Kettle Extraction, Transportation, Transformation, and Loading Environment it has now, but from KDE Extraction, Transportation, Transformation and Loading Environment, as the tool was planned to be written on top of KDE, as mentioned in the introduction of the book.
In April 2006 the Kettle project was acquired by the Pentaho Corporation and Matt Casters, Kettle's founder, also joined the Pentaho team as a Data Integration Architect.
When Pentaho announced the acquisition, James Dixon, the Chief Technology Officer, said:
We reviewed many alternatives for open source data integration, and Kettle clearly had the best architecture, richest functionality, and most mature user interface. The open architecture and superior technology of the Pentaho BI Platform and Kettle allowed us to deliver integration in only a few days, and make that integration available to the community.
By joining forces with Pentaho, Kettle benefited from a huge developer community, as well as from a company that would support the future of the project.
From that moment the tool has grown constantly. Every few months a new release is available, bringing to the users, improvements in performance and existing functionality, new functionality, ease of use, and great changes in look and feel. The following is a timeline of the major events related to PDI since its acquisition by Pentaho:
June 2006: PDI 2.3 is released. Numerous developers had joined the project and there were bug fixes provided by people in various regions of the world. Among other changes, the version included enhancements for large scale environments and multilingual capabilities.
February 2007: Almost seven months after the last major revision, PDI 2.4 is released including remote execution and clustering support (more on this in Chapter 13), enhanced database support, and a single designer for the two main elements you design in Kettle—jobs and transformations.
May 2007: PDI 2.5 is released including many new features, the main feature being the advanced error handling.
November 2007: PDI 3.0 emerges totally redesigned. Its major library changed to gain massive performance. The look and feel also changed completely.
October 2008: PDI 3.1 comes with an easier-to-use tool, along with a lot of new functionalities as well.
April 2009: PDI 3.2 is released with a really large number of changes for a minor version—new functionality, visualization improvements, performance improvements, and a huge pile of bug fixes. The main change in this version was the incorporation of dynamic clustering (see Chapter 13 for details).
In 2010 PDI 4.0 will be released, delivering mostly improvements with regard to enterprise features such as version control.
Note
Most users still refer to PDI as Kettle, its further name. Therefore, the names PDI, Pentaho Data Integration, and Kettle will be used interchangeably throughout the book.
Paying attention to its name, Pentaho Data Integration, you could think of PDI as a tool to integrate data.
In you look at its original name, K.E.T.T.L.E., then you must conclude that it is a tool used for ETL processes which, as you may know, are most frequently seen in data warehouse environments.
In fact, PDI not only serves as a data integrator or an ETL tool, but is such a powerful tool that it is common to see it used for those and for many other purposes. Here you have some examples.
The loading of a datawarehouse or a datamart involves many steps, and there are many variants depending on business area or business rules. However, in every case, the process involves the following steps:
Extracting information from one or different databases, text files, and other sources. The extraction process may include the task of validating and discarding data that doesn't match expected patterns or rules.
Transforming the obtained data to meet the business and technical needs required on the target. Transformation implies tasks such as converting data types, doing some calculations, filtering irrelevant data, and summarizing.
Loading the transformed data into the target database. Depending on the requirements, the loading may overwrite the existing information, or may add new information each time it is executed.
Kettle comes ready to do every stage of this loading process. The following sample screenshot shows a simple ETL designed with Kettle:

Imagine two similar companies that need to merge their databases in order to have a unified view of the data, or a single company that has to combine information from a main ERP application and a CRM application, though they're not connected. These are just two of hundreds of examples where data integration is needed. Integrating data is not just a matter of gathering and mixing data; some conversions, validation, and transport of data has to be done. Kettle is meant to do all those tasks.
Why do we need that data be correct and accurate? There are many reasons—for the efficiency of business, to generate trusted conclusions in data mining or statistical studies, to succeed when integrating data, and so on. Data cleansing is about ensuring that the data is correct and precise. This can be ensured by verifying if the data meets certain rules, discarding or correcting those that don't follow the expected pattern, setting default values for missing data, eliminating information that is duplicated, normalizing data to conform minimum and maximum values, and so on—tasks that Kettle makes possible, thanks to its vast set of transformation and validation capabilities.
Think of a company of any size that uses a commercial ERP application. One day the owners realize that the licences are consuming an important share of its budget and so they decide to migrate to an open source ERP. The company will no longer have to pay licences, but if they want to do the change, they will have to migrate the information. Obviously it is not an option to start from scratch, or type the information by hand. Kettle makes the migration possible, thanks to its ability to interact with most kinds of sources and destinations such as plain files, and commercial and free databases and spreadsheets.
Sometimes you are forced by government regulations to export certain data to be processed by legacy systems. You can't just print and deliver some reports containing the required data. The data has to have a rigid format, with columns that have to obey some rules (size, format, content), different records for heading and tail, just to name some common demands. Kettle has the power to take crude data from the source and generate these kinds of ad hoc reports.
The previous examples show typical uses of PDI as a standalone application. However, Kettle may be used as part of a process inside the Pentaho BI Platform. There are many things embedded in the Pentaho application that Kettle can do—preprocessing data for an on-line report, sending mails in a schedule fashion, or generating spreadsheet reports.
Note
You'll find more on this in Chapter 13. However, the use of PDI integrated with the BI Suite is beyond the scope of this book.
These are the instructions to install Kettle, whatever your operating system.
The only prerequisite to install PDI is to have JRE 5.0 or higher installed. If you don't have it, please download it from http://www.javasoft.com/ and install it before proceeding. Once you have checked the prerequisite, follow these steps:
From http://community.pentaho.com/sourceforge/ follow the link to Pentaho Data Integration (Kettle). Alternatively, go directly to the download page http://sourceforge.net/projects/pentaho/files/Data Integration.
Choose the newest stable release. At this time, it is 3.2.0.

Download the file that matches your platform. The preceding screenshot should help you.
Unzip the downloaded file in a folder of your choice—
C:/Kettleor/home/your_dir/kettle.If your system is Windows, you're done. Under UNIX-like environments, it's recommended that you make the scripts executable. Assuming that you chose Kettle as the installation folder, execute the following command:
cd Kettle
chmod +x *.sh
In this tutorial you're going to launch the PDI graphical designer and get familiarized with its main features.
If your system is Windows, type the following command:
Spoon.batIn other platforms such as Unix, Linux, and so on, type:
Spoon.shIf you didn't make
spoon.shexecutable, you may type:sh Spoon.sh
As soon as Spoon starts, a dialog window appears asking for the repository connection data. Click the No Repository button. The main window appears. You will see a small window with the tip of the day. After reading it, close that window.
A welcome! window appears with some useful links for you to see.
Close the welcome window. You can open that window later from the main menu.
Click Options... from the Edit menu. A window appears where you can change various general and visual characteristics. Uncheck the circled checkboxes:

Select the tab window Look Feel.
Change the Grid size and Preferred Language settings as follows:

Click the OK button.
Restart Spoon in order to apply the changes. You should neither see the repository dialog, nor the welcome window. You should see the following screen instead:

You ran for the first time the graphical designer of PDI Spoon, and applied some custom configuration.
From the Look Feel configuration window, you changed the size of the dotted grid that appears in the canvas area while you are working. You also changed the preferred language. In the Option tab window, you chose not to show either the repository dialog or the welcome window at startup. These changes were applied as you restarted the tool, not before.
The second time you launched the tool, the repository dialog didn't show up. When the main window appeared, all the visible texts were shown in French, which was the selected language, and instead of the welcome window, there was a blank screen.
This tool that you're exploring in this section is the PDI's desktop design tool. With Spoon you design, preview, and test all your work, that is, transformations and jobs. When you see PDI screenshots, what you are really seeing are Spoon screenshots. The other PDI components that you will meet in the following chapters are executed from terminal windows.
In the tutorial you changed some preferences in the Options window. There are several look and feel characteristics you can change beyond those you changed. Feel free to experiment with this setting.
Tip
If you choose any language as preferred language other than English, you should select a different language as alternative. If you do so, every name or description not translated to your preferred language will be shown in the alternative language.
Just for the curious people: Italian and French are the overall winners of the list of languages to which the tool has been translated from English. Below them follow Korean, Argentinean Spanish, Japanese, and Chinese.
One of the settings you changed was the appearance of the welcome window at start up. The welcome window has many useful links, all related with the tool: wiki pages, news, forum access, and more. It's worth exploring them.
The first time you launched Spoon, you chose No Repository. After that, you configured Spoon to stop asking you for the Repository option. You must be curious about what the repository is and why not to use it. Let's explain it.
As said, the results of working with PDI are Transformations and Jobs. In order to save the Transformations and Jobs, PDI offers two methods:
Repository: When you use the repository method you save jobs and transformations in a repository. A repository is a relational database specially designed for this purpose.
Files: The files method consists of saving jobs and transformations as regular XML files in the filesystem, with extension
kjbandktrrespectively.
The following diagram summarizes this:
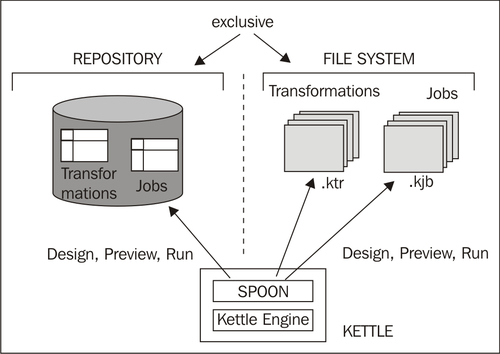
You cannot mix the two methods (files and repository) in the same project. Therefore, you must choose the method when you start the tool.
Why did we choose not to work with repository, or in other words, to work with files? This is mainly for the following two reasons:
Working with files is more natural and practical for most users.
Working with repository requires minimum database knowledge and that you also have access to a database engine from your computer. Having both preconditions would allow you to learn working with both methods. However, it's probable that you haven't.
Throughout this book, we will use the file method. For details of working with repositories, please refer to Appendix A.
How about starting by saying Hello to the World? Not original but enough for a very first practical exercise. Here is how you do it:
Create a folder named
pdi_labsunder the folder of your choice.Open Spoon.
From the main menu select File | New Transformation.
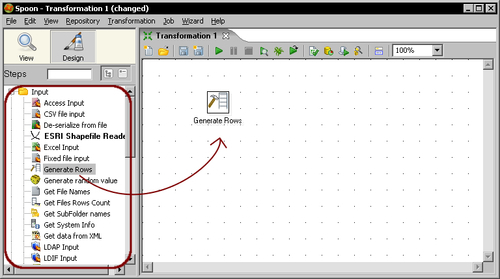
At the left-hand side of the screen, you'll see a tree of Steps. Expand the Input branch by double-clicking it.
Left-click the Generate Rows icon.
Without releasing the button, drag-and-drop the selected icon to the main canvas. The screen will look like this:
Double-click the Generate Rows step that you just put in the canvas and fill the text boxes and grid as follows:

From the Steps tree, double-click the Flow step.
Click the Dummy icon and drag-and-drop it to the main canvas.
Click the Generate Rows step and holding the Shift key down, drag the cursor towards the Dummy step. Release the button. The screen should look like this:

Right-click somewhere on the canvas to bring up a contextual menu.
Select New note. A note editor appears.
Type some description such as Hello World! and click OK.
From the main menu, select Transformation | Configuration. A window appears to specify transformation properties. Fill the Transformation name with a simple name as hello_world. Fill the Description field with a short description such as My first transformation. Finally provide a more clear explanation in the Extended description text box and click OK.
From the main menu, select File | Save.
Save the transformation in the folder
pdi_labswith the namehello_world.Select the Dummy step by left-clicking it.
Click on the Preview button in the menu above the main canvas.

A debug window appears. Click the Quick Launch button.
The following window appears to preview the data generated by the transformation:

Close the preview window and click the Run button.

A window appears. Click Launch.
The execution results are shown in the bottom of the screen. The Logging tab should look as follows:

You've just created your first transformation.
First, you created a new transformation. From the tree on the left, you dragged two steps and drop them into the canvas. Finally, you linked them with a hop.
With the Generate Rows step, you created 10 rows of data with the message Hello World!. The Dummy step simply served as a destination of those rows.
After creating the transformation, you did a preview. The preview allowed you to see the content of the created data, this is, the 10 rows with the message Hello World!
Finally, you ran the transformation. You could see the results of the execution at the bottom of the windows. There is a tab named Step Metrics with information about what happens with each steps in the transformation. There is also a Logging tab showing a complete detail of what happened.
As shown in the following diagram, transformation is an entity made of steps linked by hops. These steps and hops build paths through which data flows. The data enters or is created in a step, the step applies some kind of transformation to it, and finally the data leaves that step. Therefore, it's said that a transformation is data-flow oriented.

A transformation itself is not a program nor an executable file. It is just plain XML. The transformation contains metadata that tells the Kettle engine what to do.
A step is the minimal unit inside a transformation. A big set of steps is available. These steps are grouped in categories such as the input and flow categories that you saw in the example. Each step is conceived to accomplish a specific function, going from reading a parameter to normalizing a dataset. Each step has a configuration window. These windows vary according to the functionality of the steps and the category to which they belong. What all steps have in common are the name and description:
|
Step property |
Description |
|---|---|
|
Name |
A representative name inside the transformation. |
|
Description |
A brief explanation that allows you to clarify the purpose of the step. It's not mandatory but it is useful. |
A hop is a graphical representation of data flowing between two steps—an origin and a destination. The data that flows through that hop constitutes the output data of the origin step and the input data of the destination step.
As you just saw, the Spoon is the tool using which you create, preview, and run transformations. The following screenshot shows you the basic work areas:


The Preview functionality allows you to see a sample of the data produced for selected steps. In the previous example, you previewed the output of the Dummy Step. The Run option effectively runs the whole transformation.
Whether you preview or run a transformation, you'll get an execution results window showing what happened. Let's explain it through an example.
Let's do some testing and explore the results:
Open the
hello_worldtransformation.Edit the Generate Rows step, and change the limit from
10to1000so that it generates 1,000 rows.Select the Logging tab window at the bottom of the screen.
Click on Run.
In the Log level drop-down list, select RowLevel detail.
Click on Launch.
You can see how the logging window shows every task in a very detailed way.

Edit the Generate Rows step, and change the limit to 10,000 so that it generates 10,000 rows.
Select the Step Metrics.
Run the transformation.
You can see how the numbers change as the rows travel through the steps.

You did some tests with the hello_world transformation and saw the results in the Execution Results window.
The Execution Results window shows you what is happening while you preview or run a transformation.
The Logging tab shows the execution of your transformation, step by step. By default, the level of the logging detail is Basic but you can change it to see different levels of detail—from a minimal logging (level Minimal) to a very detailed one (level RowLevel).
The Step Metrics tab shows, for each step of the transformation, the executed operations and several status and information columns. You may be interested in the following columns:
|
Column |
Description |
|---|---|
|
Read |
Contains the number of rows coming from previous steps |
|
Written |
Contains the number of rows leaving from this step toward the next |
|
Input |
Number of rows read from a file or table |
|
Output |
Number of rows written to a file or table |
|
Errors |
Errors in the execution. If there are errors, the whole row becomes red |
|
Active |
Tells the current status of the execution |
In the example, you can see that the Generate Rows step writes rows, which then are read by the Dummy step. The Dummy step also writes the same rows, but in this case those go nowhere.
For each of the following, decide if the sentence is true or false:
There are several graphical tools in PDI, but Spoon is the most used.
You can choose to save Transformations either in files or in a database.
To run a Transformation, an executable file has to be generated from Spoon.
The grid size option in the Look and Feel windows allows you to resize the work area.
To create a transformation, you have to provide external data.
Before skipping to the next chapter, let's devote some minutes to the installation of MySQL.
In Chapter 8 you will begin working with databases from PDI. In order to do that, you will need access to some database engine. As MySQL is the world's most popular open source database, it was the database engine chosen for the database-related tutorials in the book.
In this section you will learn to install the MySQL database engine both in Windows and Ubuntu, the most popular distribution of Linux these days. As the procedures for installing the software are different, a separate explanation is given for each system.
In order to install MySQL on your Windows system, please follow these instructions:
Open an internet browser and type http://dev.mysql.com/downloads/mysql/.
Select the Microsoft Windows platform and download the mysql-essential package that matches your system: 32-bit or 64-bit.
Double-click the downloaded file. A wizard will guide you through the process.
When asked about the setup type, select Typical.
Several screens follow. When the wizard is complete you'll have the option to configure the server. Check Configure the MySQL Server now and click Finish.
A new wizard will be launched that lets you configure the server.
When asked about the configuration type, select Standard Configuration.
When prompted, set the Windows options as shown in the next screenshot:

When prompted for the security options, provide a password for the root user.You'll have to retype the password.
In the next window click on Execute to proceed with the configuration. When the configuration is done, you'll see this:

Click on Finish. After installing MySQL it is recommended that you install the GUI tools for administering and querying the database.
Open an Internet browser and type http://dev.mysql.com/downloads/gui-tools/.
Look for the Windows downloads and download the Windows (x86) package.
Double-click the downloaded file. A wizard will guide you through the process.
When asked about the setup type, select Complete.
Several screens follow. Just follow the wizard instructions.
When the wizard ends, you'll have the GUI tools added to the MySQL menu.

This tutorial shows you the procedure to install MySQL on Ubuntu.
Please follow these instructions:
Check that you have access to the Internet.
Open the Synaptic package manager from System | Administration | Synaptic Package Manager.

Under Quick search type
mysql-serverand click on the Search button.Among the results, locate
mysql-server-5.1, click in the tiny square to the left, and select Mark for Installation.You'll be prompted for confirmation. Click on Mark.
Now search for a package named
mysql-admin.When found, mark it for installation in the same way.
Click on Apply on the main toolbar.

A window shows up asking for confirmation. Click on Mark again. What follows is the download process followed by the installation process.
At a particular moment a window appears asking you for a password for the root user—the administrator of the database. Enter a password of your choice. You'll have to enter it twice.
When the process ends, you will see the changes applied.

Under Applications a new menu will also be added to access the GUI tools.

You installed MySQL server and GUI Tools in your Ubuntu system.
Tip
The previous directions are for standard installations. For custom installations, instructions related to other operating systems, or for troubleshooting, please check the MySQL documentation at—http://dev.mysql.com/doc/refman/5.1/en/installing.html.
In this first chapter, you were introduced to Pentaho Data Integration. Specifically, you learned what Pentaho Data Integration is and you installed the tool. You were also introduced to Spoon, the graphical designer of PDI, and you created your first transformation.
As an additional exercise, you installed a MySQL server and the MySQL GUI tools. You will need this software when you start working with databases in Chapter 8.
Now that you've learned the basics, you're ready to begin creating your own transformations to explore real data. That is the topic of the next chapter.