


Oracle BI Publisher (formerly known as Oracle XML Publisher) is Oracle's reporting XML-based technology, which generates highly formatted data output using multiple data sources. It was originally developed to solve the reporting problems faced by Oracle Applications, released as a standalone version, and finally it also became a part of the Oracle BI Enterprise Edition as Oracle BI Publisher. Starting with the 11g version, Oracle BI Publisher was completely redesigned to incorporate new functionalities. In this chapter, we will be covering the following topics:
A comparison with 10g
Getting started with Oracle BI Publisher 11g
Backward compatibility of BI Publisher 11g with BI Publisher 10g reports
The new 11g release of Oracle BI Publisher introduces some new features highly anticipated and desired by both reports' developers and the reports' end users. Let's take a look at the major improvements brought about with the new release.
In the 10g release, for a data definition you had to create an XML configuration file containing both data sources definition and XML structure definition. For example, this code is written using notepad:
Tip
Downloading the example code
You can download the example code files for all Packt books you have purchased from your account at http://www.PacktPub.com. If you purchased this book elsewhere, you can visit http://www.PacktPub.com/support and register to have the files e-mailed directly to you.
<?xml version="1.0" encoding="UTF-8" ?>
<dataTemplate name="AR_RECEIPT" version="1.0">
<properties>
  <property name="xml_tag_case" value="upper" />
  <property name="debug_mode" value="on" />
</properties>
<parameters>
  <parameter name="P_CASH_RECEIPT_ID" dataType = "number"></parameter>
</parameters>
<dataQuery>
  <sqlStatement name="Q_RECEIPT">
SELECT acr.cash_receipt_id, acr.amount, acr.currency_code, acr.receipt_number, to_char(acr.receipt_date, fnd_profile.value('ICX_DATE_FORMAT_MASK'))
receipt_date, acr.pay_from_customer, acr.deposit_date, hp.party_name, hp.address1 || ' ' || hp.address2 client_address, ar_receipt_string.rows_to_string, xxrop_string.currency_to_string(acr.amount) words
FROM ar_cash_receipts_all acr, hz_cust_accounts hca, hz_parties hp WHERE acr.cash_receipt_id=:P_CASH_RECEIPT_ID AND acr.pay_from_customer = hca.cust_account_id AND hca.party_id = hp.party_id
  </sqlStatement>
   <sqlStatement name="Q_SIGNATURE">
    <![CDATA[   SELECT   user_name FROM fnd_user, fnd_concurrent_requests
          WHERE REQUESTED_BY = user_id and CONCURRENT_PROGRAM_ID = fnd_global.conc_program_id() and request_id = fnd_global.conc_request_id() ]]>
  </sqlStatement>
  <sqlStatement name="Q_MO">
    <![CDATA[ SELECT  fnd_profile.value('COMPANY_NAME') org_name FROM dual ]]>
  </sqlStatement>
</dataQuery>
<dataStructure>
    <group name="G_SIGNATURE" dataType="varchar2" source="Q_SIGNATURE">
      <element name="REP_AUTHOR" dataType="varchar2" value="user_name"/>
    </group>
    <group name="G_MO" dataType="varchar2" source="Q_MO">
      <element name="COMPANY_NAME" value="org_name"/>
    </group>
    <group name="G_REC" source="Q_RECEIPT">
      <element name="NUMBER" value="receipt_number" />
      <element name="REC_DATE" value=" receipt_date " />
      <element name="AMOUNT" value="amount" />
      <element name="CURRENCY" value="currency_code" />
      <element name="CLIENT" value="party_name" />
      <element name="CLIENT_ADDRESS" value="client_address" />
    </group>
</dataStructure>
</dataTemplate>
You can see the distinctive parts of the data template file, such as, dataQuery
containing SQL statements and dataStructure
containing groups and elements.
With the new release of BI Publisher, you don't need to see and edit XML templates anymore. The new web-based user interface makes it all visual. The Data Model Editor provides tools to build queries, define the data structure, and create formulae from different data sources, as you can see in the following screenshot:
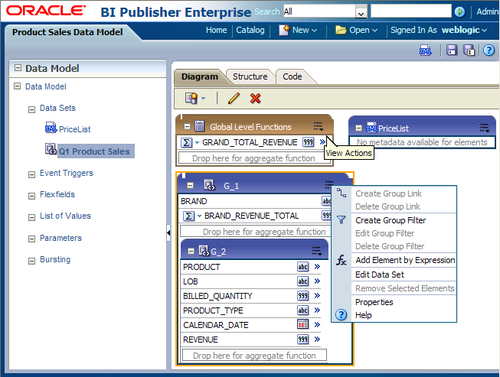
Another advantage of the Data Model is that it now has a life of its own. A Data Model can be saved and, afterwards, used as many times as you like, increasing reusability and data quality. Compared to 10g, where a Data Model couldn't be reused, this is a great new feature.
In BI Publisher 10g, the layout template can be designed using external tools such as: Microsoft Word, Adobe Acrobat, Microsoft Excel, and Adobe Flash. Templates created using these tools contain embedded fields with properties that determine how the XML data will be merged into the template. Using a combination of native Microsoft Word features and BI Publisher command syntax, you can create a report template that is ready to accept XML data from your system. You have to choose the desired tool to build the data template according to the design specifications and final output type.
For example, RTF templates can generate the following output types: PDF, HTML, RTF, Excel, Power Point, zipped PDF, and MHTML. The following screenshot shows how you can assign an XML element (this could be a formula or a parameter) to a report field in the template builder for Word:
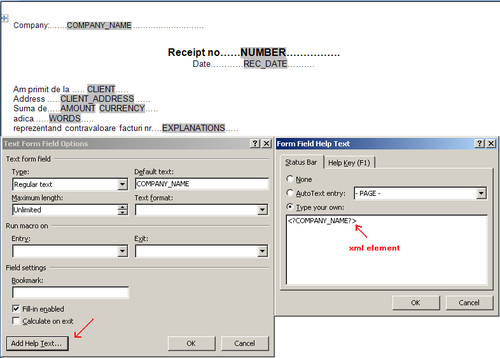
Double click on the Text form field to get the Text Form Field Options window and then click the Add Help Text button to get the Form Field Help Text window.
You can load a sample XML and you have tools to support adding tables, pivot tables, charts, grouping and formatting data, and also to preview the final result.
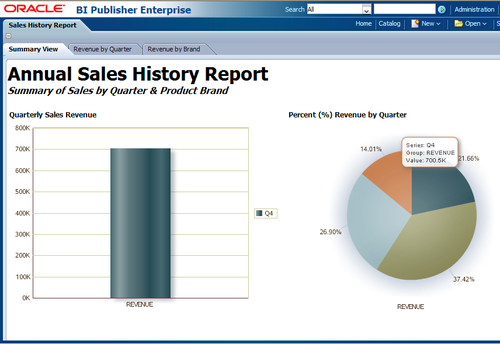
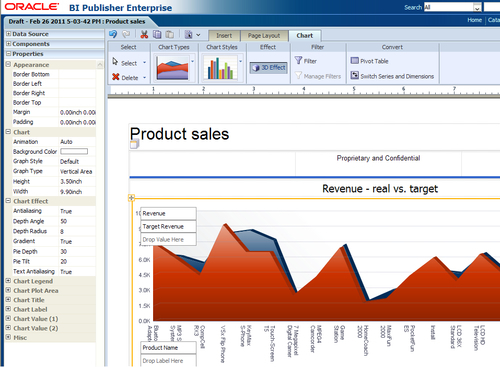
But with the arrival of BI Publisher 11g, the layout template definition changed radically—a web-based layout editor was introduced. This can generate pixel perfect reports, and the most exciting part is that you can interact with data allowing re-sorting and filtering of existing reports. Clicking on any section of a component such as Table, Chart, Pivot Table, or Gauge refreshes other linked components in the report to reflect the selection, without refreshing the whole report or page.
In the following screenshot, you can see the correspondence created between the right side chart where I have the total revenue divided by quarters, and the left side chart where revenues for only one quarter is displayed. The link created between these two entities allows you to interactively change the values from the Quarterly Sales Revenue by clicking the desired quarter on the Percent(%) Revenue by Quarter chart:
Note
You can add multiple templates of different types to your report, whereas with 10g you had to use many reports containing the same data. Now with 11g you can include many data perspectives in one report, and have many output types attached to the same report.
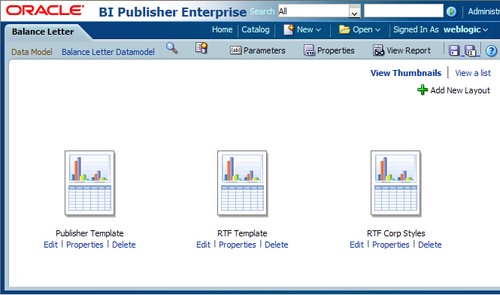
The different types of templates are shown in the preceding screenshot.
There are a few more features introduced/ improved upon by the BI Publisher 11g release. These include:
For defining a reusable formatting functionality in BI Publisher, a Subtemplate can be defined in an RTF or an XSL file format. Previously the sub-templates were saved and called from an external directory; but with the new release, sub-templates are considered catalog objects and are saved and managed in the catalog.
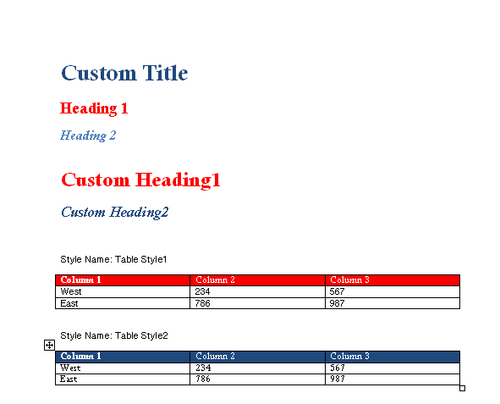
Also managed in the BI Publisher catalog are the newly introduced Style Templates . To keep the company identity intact across all company reports, a style template can be applied to RTF layouts. You can see an example style template in the following screenshot:
The BI Publisher 11g release also introduces a new output type: PDFZ or zipped PDF. The purpose was to have smaller and more manageable files instead of a large PDF output file. So when PDF output splitting is enabled for a report, this file is split into multiple files generated in one zip file. An index file is also created with from/to in it.
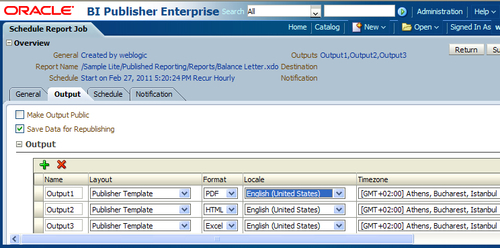
Another thing improved from the previous release is the scheduling options . Now you can schedule multiple outputs for a report with a different layout applied as you can see in the following screenshot and send each output to a different destination. Also to define schedule times, there are now more recurrence pattern options:
The main components for working with Oracle BI Publisher are:
Data query: This engine formats XML data provided by any system that can generate XML, including web services and any data available through Java DataBase Connectivity (JDBC).
Layout template: This defines the layout format. The layout template can be designed using Microsoft Word, Adobe Acrobat, Microsoft Excel (standalone version), Adobe Flash (standalone version), and Oracle BI Publisher's own layout editor.
Report definition: This brings together the query and one or more templates, which you will see in the Layout Options section of this chapter.
Report jobs: This means submitting, scheduling, and delivering reports to multiple destinations.
To start with, let's take a tour through BI Publisher's interface components.
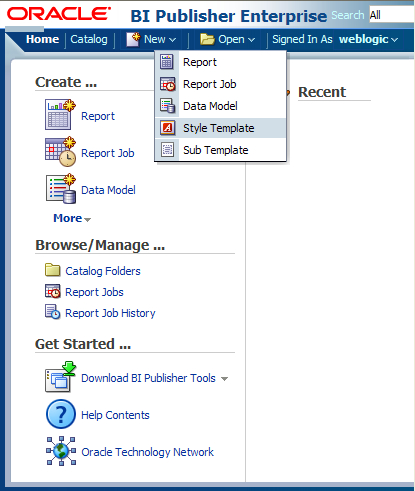
Starting on the homepage, it is very easy to see all of the main actions that you can proceed with. You can create a new:
Report
Report Job
Data Model
Style Template
Sub Template
You can also browse the existing ones.
Tip
You can access the current running jobs from the Report Jobs link, and completed jobs from Report Job History.
In this screenshot, the central section shows a list of Recent accessed objects:
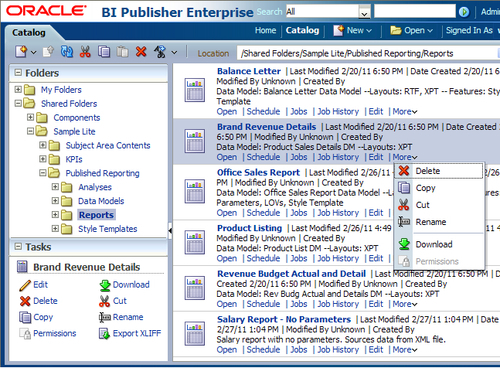
For browsing existing entities, you must open the Catalog. The Catalog page contains a tree-like structure of folders of all the elements created in BI Publisher. It is, in my opinion, a very friendly interface which enables quick access to general actions (available for any kind of component), such as Delete, Copy, Cut, Rename, and so on, and also to specific actions. For example, when you look at a report you can see that a report can be opened, scheduled, and edited, or its submissions tracked in Jobs or Jobs History lists.
Notice the Search bar on the top, where you can search through All entities, or you can select other categories of entities to search through:
Let's browse the catalog to find and edit an existing Data Model.
The Data Model Editor provides tools to choose various types of data sources and to build the desired model and structure of data. For data type sources, you can choose one or more from: SQL query, MDX query, Oracle BI Analysis, view object, web service, LDAP query, XML file, Microsoft Excel file, and HTML (XML Feed).
As you can see in the left section of the next screenshot, you can attach the following to a Data Model:
Data Sets: Contains the Data Model query structure
Event Triggers: Triggers to be executed before or after the report
FlexFields: Oracle EBS Flexfields
List of Values: LOV's for parameters
Parameters: Report variables, which are requested by the report at runtime
Bursting options: Setup of bursting destinations
These options will be addressed in much more detail in Chapter 2, Creating a Data Model for a Report.
To design your Data Model query structure, the Data Set editor presents three different approaches:
For example, to create a SQL Data Set, you must choose the Data Source (from all the options available in the data source list) and provide the SQL query. But we'll go into more detail with this in Chapter 3, Multiple Data Sources, of this book.
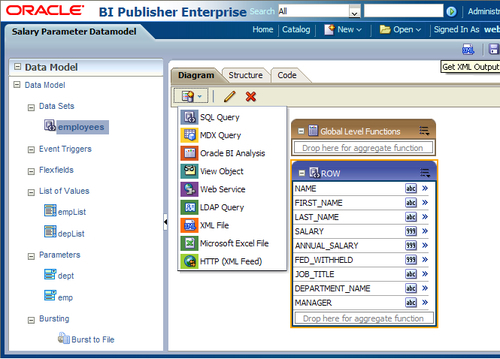
After creating the Data Model, there is another feature you can take advantage of, that is, you can generate a sample XML data by accessing the Get XML output option, which is shown in the preceding screenshot. In this way, you will be able to take a first look at the generated data, and afterwards test your layout template.
Once you have built the desired Data Model, you can start building the report. First, you have to choose the template designer type to use. This is somehow a difficult task to complete because you have to take the following into consideration:
The tools offered by each template designer (depending on the template type you choose from those specified in the next screenshot)
The desired output, requested in specifications
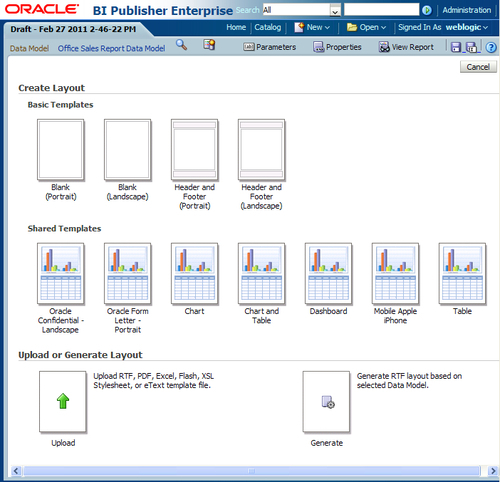
As shown in the next screenshot, choosing a template type from the Create Layout section will trigger BI Publisher's own layout editor. Newly available in the BI Publisher 11g release, templates can be created, edited, and viewed online. But, you still have the option to build your template using an external tool. From the Upload or Generate Layout section, you can access an interface for browsing and uploading these types of template files:
RTF
PDF
Excel
Flash
XSL Stylesheets
eText
An RTF template can also be simply generated. In this case, BI Publisher (BIP) will actually create a default layout for you, which includes all the fields specified in your Data Model:
To edit a BIP template using Template Builder for Word, you have the option of logging into BIP to choose and open the desired template.
Once all modifications are complete, the template can be uploaded back into BIP by following the menu function Upload Template. The Template Builder will import your changes back into the BIP report definition.
Using the Template Builder for Word you can build an RTF template as shown in the following screenshot:
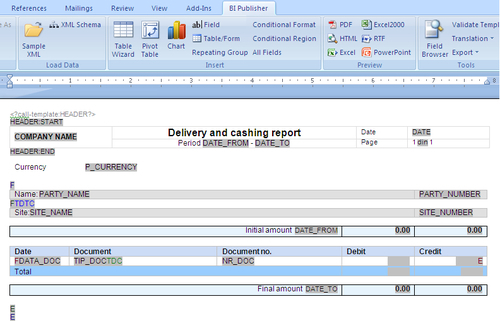
To map the template field to the XML element data field, a placeholder is created. At runtime the placeholder is replaced by the value of the element with the same name in the XML data file. A more in-depth description of the methodology will follow later in the book, in Chapter 6, Oracle BIP Template Builder for Microsoft Word.
Finally, on opening the created report, BI Publisher immediately displays the results obtained by applying the attached templates against the chosen Data Model. As you can see in the next screenshot, for the current report You have five layouts defined in tabs:
Simple
Advance P age Totals
Batch Manager Salary
W-2 2010 (Partial)
Manager Summary
Each tab page contains a report layout, depending on the number of attached templates:
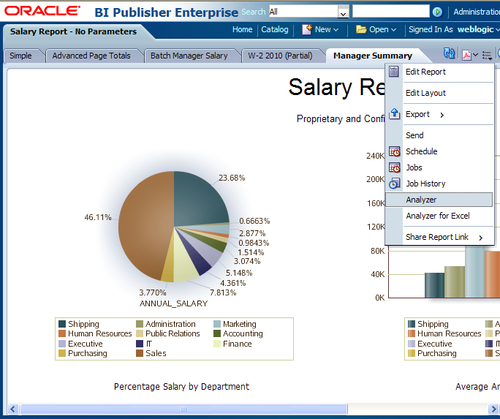
From here, you can further edit the report or the layout, or export, send, or schedule the report, but you also have access to an another interesting BI Publisher feature: the Online Analyzer.
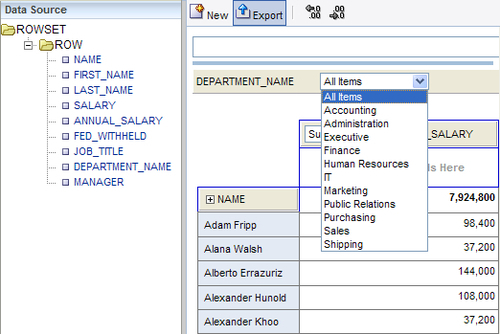
The Online Analyzer enables you to create ad hoc pivot views of your data. In a pivot table structure, you can drag and drop data elements, which can be afterwards arranged, filtered, and summarized. You can see in the next screenshot the interface offered to build a pivot table.
You can save your pivot table as a layout for your report by exporting it and saving it as a BI Publisher layout. The export command saves the pivot table as the BI Publisher layout type (.xpt). It will then have all the features and properties of a BI Publisher layout:
Besides having the report running online, you can also schedule the report. Using the Schedule Report Job page, you can submit a report job with precise parameters, define multiple outputs for a scheduled job, and add different delivery destinations. The BI Publisher interface provides four tabs to input Report Job parameters, as shown in the next screenshot:
On the General tab you have to choose the report name and input its parameters.
On the Output tab you can choose to:
Use a bursting definition to determine the output and delivery destination. This option is available only if the report has a bursting definition and disables all the other fields on the page.
Make the output public. The output will be available to all users with access to the report.
Save the data for republishing, that is, save the XML data.
On the same tab, in the output table, you can add multiple outputs, that is, you have to set output parameters: Name, Layout, Format, Locale, Timezone, and Calendar. Multiple destinations can also be set for the report to be delivered to. There are five destination types:
On the Schedule tab, schedule times are defined. You can set a combination of parameters between: Frequency, Every, On, Start, End, Right now, and On a fixed day.
The Notification tab allows you to configure a notification to be sent by e-mail or HTTP when the report is Completed, is Completed with warnings, or Failed:

Bursting definitions are defined in the Data Model design interface.
Bursting is a process of splitting data into blocks. For each block of the data, a separate document is generated and delivered to one or more destinations. For the delivery, based on an element in the Data Model, you can have different templates, output format, delivery method, or locale.
On the Bursting page you have to set a few parameters, as shown in the next screenshot:
Split by: An element from the Data Set, used to split the data
Deliver By: An element from the Data Set, used to format and deliver the data
SQL Query: Provides the required information to format and deliver the report parameters

The following is the Report Job History page, which displays information about running report jobs and completed report jobs. In the first place, this page provides a filter list to facilitate report job searching.
A matching criteria jobs list will be displayed and from the Report Job Histories list you will be able to do the following:
View the status and details of running and completed report jobs. For this click on the Report Job Name drop-down.
Download or view the report XML data.
Download or view the report document.
Republish the report data.
Delete report jobs from history.

You have a complete set of tools to provide multiple layouts for your data, grouped into three tabs, as shown in the following screenshot:
In the Insert tab, you can choose to insert components such as:
Chart
Data Table
Pivot table
Layout grid
Gauge
In the Page Layout tab, you can set the page orientation and insert the page footer or header.
The third tab is contextual and contains characteristics that one can set for the current selected component. For example, for a text field you can set font characteristics and alignment.
Data elements available on the left side of the layout editor are added into the desired structure by simply dragging-and-dropping it into the designated locations. Notice these very useful hints: Drop Value Here or Drop Label Here:
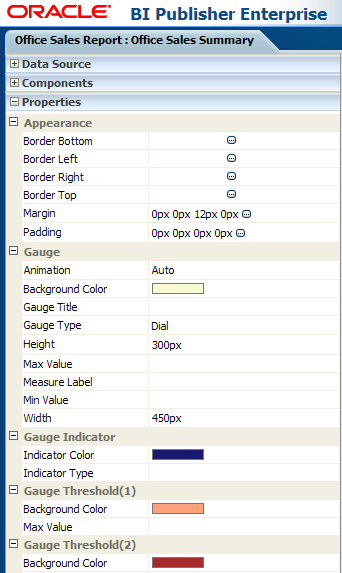
A complete list of properties can be accessed on the left side too, as shown in the next screenshot. Gauge properties list is shown in this example:
To complete the new features list, let's see how the Interactive Viewer , which is the most exciting new feature added in the 11g release works, by making different components on the report page interact. This is only a short introduction of this feature, and we'll discuss this in detail in Chapter 5, The New XPT Format.
In the following screenshot, on the Page Layout tab you have the Configure Events option, which triggers the Configure Events interface:
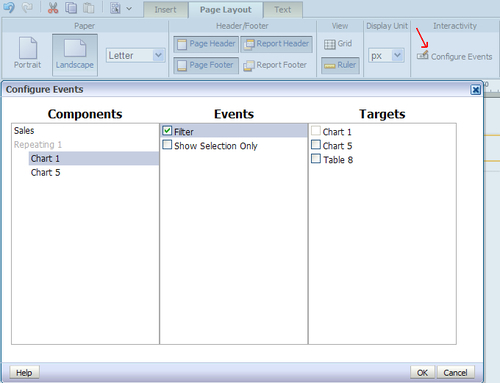
As you can see in this screenshot, the Configure Events interface adds layout components to the Components list (only if they can trigger events) and to the Targets list (all the components). In the next step, the user creates links between elements belonging to these two categories using the Events list.
Seeing all these new great features, you may be asking how much trouble it would be to upgrade your work to the BIP 11g release?
But once BIP 11g is installed, Oracle provides the upgrade assistant utility to upgrade the repository and web catalogs.
When moving from 10g to 11g, we will have to use the upgrade utility because the repository structure and the web catalog structure have changed a lot between the different versions.
Oracle Business Intelligence Publisher 11g proves to be a great reporting solution, generating any kind of data output you might need. The following are among the strengths of the new release:
Various data sources types
Incorporated Data Model designer
Separation of the Data Model from the report layout
Incorporated layout editor
A great variety of output formats
Interactive viewer
Multiple possible destinations
Report jobs scheduler
Report translations support

As the preceding figure reveals, BI Publisher can query or accept data from different data sources like databases, web services, HTTP feeds, or file data. BI Publisher structures the input data in an XML-based format, applies a format against it, and delivers it to the end users.
BI Publisher layout templates can be designed using Microsoft Word, Microsoft Excel, Adobe Acrobat, Adobe Flash tools or its own layout designer.
It is a tool that can efficiently generate thousands of pre-formatted documents like invoices, financial statements, sales reports, and so on, per hour with minimal impact to transactional systems. Reports can be published to different output formats and delivered in environments like online reports, e-mail, printers, faxes, FTP, and HTTP.
In the next chapter, you'll learn to work with the Data Model Editor to configure and use multiple data source types for your reports.