


In this chapter, we will cover the following recipes:
Creating a new network host
Creating a new HTTP service
Creating a new e-mail contact
Verifying configuration
Creating a new hostgroup
Creating a new servicegroup
Creating a new contactgroup
Creating a new time period
Running a service on all hosts on a group
Nagios Core is appropriate for monitoring services and states on all sorts of hosts and one of its primary advantages is that the configuration can be as simple or as complex as required. Many Nagios Core users will only ever use the software as a way to send PING requests to a few hosts on their local network, or possibly the Internet, and use it to send an administrator an e-mail or pager message if they don't get any replies. Nagios Core is vastly capable of monitoring more complex systems than this, scaling from simple LAN configurations to being the cornerstone for monitoring for an entire network operations team.
However, for both simple and complex configurations of Nagios Core, the most basic building blocks of configuration are hosts, services, and contacts. These are the three things that administrators of even very simple networking setups will end up editing and probably creating. If you're a beginner to Nagios Core, you might have changed a hostname here and there or copied a stanza in a configuration to get it to do what you want; in this first chapter, we're going to look at what these configurations do in a bit more depth than that.
In a Nagios Core configuration, hosts, services, and contacts are three fundamental types of objects:
Hosts usually correspond to a computer, whether it's the machine running Nagios Core itself, a virtual machine hosted upon it, or a machine reachable via a network. Conceptually, however, a host can monitor any kind of network entity, such as the endpoint of a VPN.
Services usually correspond to an arrangement for Nagios Core to check something about a host; this can either be something as simple as whether the monitoring server can get PING replies from the host or something more complicated as whether the value of an SNMP OID is within acceptable bounds.
Contacts define a means to notify someone when events take place on the services on our hosts, such as not being able to get a PING response or send a test e-mail message.
In this chapter, we'll add all three of these configurations, we'll learn how to group their definitions together to make the configuration more readable, and to work with hosts in groups rather than having to edit each one individually. We'll also set up a custom time period for notifications so that hardworking system administrators like us don't end up getting paged at midnight unnecessarily!
In this recipe, we'll start with the default Nagios Core configuration and set up a host definition for a server that responds to PING on our local network. The end result will be that Nagios Core will add our new host to its internal tables when it starts up and will automatically check it (probably using PING) on a regular basis. In this example, I'll use the example of my Nagios Core monitoring server with the DNS name olympus.example.net and add a host definition for a web server with the DNS name sparta.example.net. This is all on an example network 192.0.2.0/24.
You'll need a working Nagios Core 4.0 or greater installation with a web interface and all the Nagios Core plugins installed. If you have not yet installed Nagios Core, you should start with the quick start guide at http://nagios.sourceforge.net/docs/nagioscore/4/en/quickstart.html that is appropriate to your operating system.
We'll assume that the configuration file Nagios Core reads on startup is at /usr/local/nagios/etc/nagios.cfg, as is the case with the default installation. It shouldn't matter where you include this new host definition in the configuration, as long as Nagios Core is going to read the file at some point. However, it might be a good idea to give each host its own file in a separate objects directory, which we'll do here. You should have access to a shell on the server and be able to write text files using an editor of your choice; I'll use vi. You will need root privileges on the server via su or sudo.
You should know how to reload Nagios Core on the server so that the configuration you're going to add gets applied. It shouldn't be necessary to restart the whole machine to do this! A common location for the startup/shutdown script on Unix-like hosts is /etc/init.d/nagios, which I'll use here. On modern GNU/Linux systems, it may be a better practice to use system nagios reload.
You should also get the hostname or IP address of the server you'd like to monitor ready. We'll use IP addresses rather than DNS hostnames here, which means that our checks will keep working even if DNS is unavailable. You may prefer to use hostnames if your addresses change regularly. You shouldn't need the subnet mask or anything like that; Nagios Core will only need whatever information the ping(8) tool would need for its own check_ping command.
Finally, you should test things first; confirm that you're able to reach the host from the Nagios Core server using ping(8) by checking directly from the shell, to make sure your network stack, routes, firewalls, and netmasks are all correct:
user@olympus:~$ ping 192.0.2.21
PING sparta.example.net (192.0.2.21) 56(84) bytes of data.
64 bytes from sparta.example.net (192.0.2.21): icmp_req=1 ttl=64 time=0.149 ms
We can create the new host definition for sparta.example.net as follows:
Change the directory to
/usr/local/nagios/etc/objectsand create a new file calledsparta.example.net.cfg:# cd /usr/local/nagios/etc/objects # vi sparta.example.net.cfg
Write the following code into the file, changing the values in bold as appropriate for your own setup:
define host {
    host_name              sparta.example.net
    alias                  sparta
    address                192.0.2.21
    max_check_attempts     3
    check_period           24x7
    check_command          check-host-alive
    contacts               nagiosadmin
    notification_interval  60
    notification_period    24x7
}
Change the directory to
/usr/local/nagios/etcand edit thenagios.cfgfile:# cd .. # vi nagios.cfg
At the end of the file, add the following line:
cfg_file=/usr/local/nagios/etc/objects/sparta.example.net.cfg
Reload the configuration:
# /etc/init.d/nagios reload
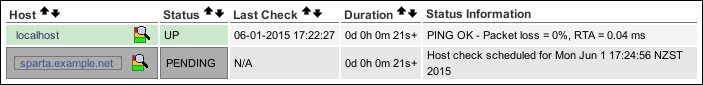
If the server restarted successfully, the web interface should now show a brand new host in the hosts list and a PENDING state as it waits to verify that the host is alive:
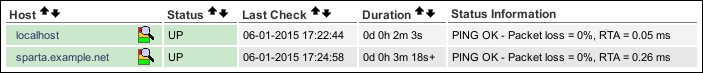
In the next few minutes, the host's background should change to green to show that the verification was complete and the host status should change to UP, assuming that the checks succeeded:
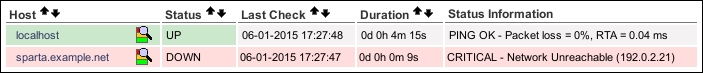
If the test failed and Nagios Core was not able to get a PING response from the target machine after three tries, for whatever reason, it would probably look something like this:
The configuration we included in the preceding adds a host to Nagios Core's list of hosts to check, Nagios Core will periodically send a PING request to 192.0.2.21, checking whether it receives a reply, and will update the status as shown in the Nagios Core web interface appropriately. We have neither defined any other services to check for this host yet, nor have we specified what action it should take if the host is down. However, the host itself will be automatically checked at regular intervals by Nagios Core and we can view its state in the web interface at any time.
The directives we defined in the preceding configuration are as follows:
host_name: This defines the hostname of the machine that is used internally by Nagios Core to refer to this host. It will end up being used in other parts of the configuration.alias: This defines a more recognizable human-readable name for the host; this appears in the web interface. It could also be used for a full-text description of the host.address: This defines the IP address of the machine. This is the actual value that Nagios Core will use to contact the server; using an IP address rather than a DNS name is generally a best practice, so the checks continue to work even if DNS is not functioning. In Nagios 4.0 or newer, if you leave this field blank, the value ofhost_namewill be used instead. Before using Nagios 4.0, you must define it.max_check_attempts: This defines the number of times Nagios Core should try to run the check if the checks fail. Here, we've defined a value of3, meaning that Nagios Core will make a total of three attempts to contact the host before flagging it asDOWN.check_period: This references the time period during which this host should be checked. The24x7time period is defined in the default configuration for Nagios Core. This is a sensible value for hosts, as it means the host will always be checked. This defines how often Nagios Core will check the host, not how often it will notify anyone.check_command: This references the command that will be used to check whether the host isUP,DOWN, orUNREACHABLE. In this case, a standard Nagios Core configuration definescheck-host-aliveas a PING check, which suits as a good test of basic network connectivity and a sensible default for most hosts. This directive is actually not required to make a valid host, but you will want to include it under most circumstances; without it, no checks will be run.contacts: This references the contact or contacts that will be told about state changes in the host. In this instance, we've usednagiosadmin, which is defined in the default Nagios Core configuration.notification_interval: This defines how regularly the host should repeat its notifications if it is having problems. Here, we've used a value of60, which corresponds to 60 minutes, or 1 hour.notification_period: This references the time period during which Nagios Core should send out notifications if there are problems. Here, we're again use the24x7time period, but for other hosts, another time period such asworkhoursmight be more appropriate.
Note that we added the definition in its own file called sparta.example.net.cfg and then referred to it in the main configuration file nagios.cfg. This is simply a conventional way of laying out hosts and it happens to be a tidy way to manage things to keep definitions in their own files.
There are a lot of other useful parameters for hosts, but the ones we've used include everything that's required.
While this is a perfectly valid way of specifying a host, it's more typical to define a host based on a
template, with definitions of how often the host should be checked, who should be contacted when its state changes and on what basis, and similar properties. Nagios Core defines a simple template host called generic-host, which could be used by extending the host definition, as with the use directive:
define host {
    use                 generic-host
    name                sparta
    host_name           sparta.example.net
    address             192.0.2.21
    max_check_attempts  3
    contacts            nagiosadmin
    check_period        24x7
    check_command       check-host-alive
}
This uses all the parameters defined for generic-host and then adds on the details of the specific host that needs to be checked. If you're curious to see what's defined in generic-host, you'll find its definition by navigating to /usr/local/nagios/etc/objects/templates.cfg.
Specifying how frequently to check a host, Chapter 3, Working with Checks and States
Using an alternative check command for hosts, Chapter 2, Working with Commands and Plugins
Grouping configuration files in directories, Chapter 9, Managing Configuration
Using inheritance to simplify configuration, Chapter 9, Managing Configuration
In this recipe, we'll create a new service to check on an existing host. Specifically, we'll check our sparta.example.net server to verify that it's responding to HTTP requests on the usual HTTP TCP port of 80. To do this, we'll be using a predefined command called check_http, which in turn uses one of the standard set of Nagios Core plugins, also called check_http. If you don't yet have a web server defined as a host in Nagios Core, you may like to try the recipe Creating a new network host in this chapter first.
After we've done this, not only will our host be checked for a PING response with its check_command, but Nagios Core will also run a periodic check to ensure that a HTTP service on that machine is responding to requests on the same host.
You'll need a working Nagios Core 4.0 or greater installation with a web interface, all the Nagios Plugins installed, and at least one host defined. If you need to set up a host definition for your web server first, you might like to read the Creating a new network host recipe in this chapter, for which the requirements are the same.
It would be a good idea to test that the Nagios Core server is actually able to contact the web server first, so we know that the test we're about to set up should succeed. The telnet(1) tool is a fine way to test that a response comes back from the TCP port 80 as we would expect from a web server:
user@olympus:~$ telnet 192.0.2.21 80
Trying 192.0.2.21...
Connected to 192.0.2.21.
Escape character is '^]'.
We can create the service definition for sparta.example.net as follows:
Change to the directory containing the file in which the
sparta.example.nethost is defined and edit it:# cd /usr/local/nagios/etc/objects # vi sparta.example.net.cfg
Add the following to the end of the file, substituting the value of the host's
host_namedirective:define service { host_name sparta.example.net service_description HTTP check_command check_http max_check_attempts 3 check_interval 5 retry_interval 1 check_period 24x7 notification_interval 60 notification_period 24x7 contacts nagiosadmin }Reload the configuration:
# /etc/init.d/nagios reload
If the server restarted successfully, the web interface should now show you a new service under the Services section and a PENDING state as the service awaits its first check:

Within a few minutes, the service's state should change to OK once the check has run and succeeded with an HTTP/1.1 200 OK response, or a similar response:

If the check had problems, perhaps because the HTTP daemon isn't running on the target server, the check may show CRITICAL instead. This probably doesn't mean that the configuration is broken; it more likely means that the network or web server isn't working:

The configuration we've added adds a simple service check definition for an existing host, to check up to three times whether the HTTP daemon on that host is responding to a simple HTTP/1.1 request. If Nagios Core can't get a response to its test, it will flag the state of the service as CRITICAL and will try again two more times before sending a notification. The service will be visible in the Nagios Core web interface, we can check its state any time, and Nagios Core will continue testing the server on a regular basis and flagging whether the checks were successful or not.
It's important to note that the service is like a property of a particular host; we define a service to check for a specific host; in this case, the sparta.example.net web server. That's why it's important to get the definition for host_name right.
The directives we defined in the preceding configuration are as follows:
host_name: This references the host definition for which this service should apply. This will be the same as thehost_namedirective for the appropriate host.service_description: This is the name of the service itself, something human-recognizable that will appear in alerts and in the web interface for the service. In this case, we've usedHTTP.check_command: This references the command that should be used to check the service's state. Here, we're referring to a command defined in Nagios Core's default configuration calledcheck_http, which refers to a plugin of the same name in the Nagios Core Plugins set.max_check_attempts: This defines the number of times Nagios Core should attempt to recheck the service after finding it in a problematic state.check_interval: This defines how long Nagios Core should wait between checks when the service isOKor after the number of checks given inmax_check_attemptshas been exceeded.retry_interval: This defines how long Nagios Core should wait between retrying checks after finding them in a problematic state.check_period: This references the time period during which Nagios Core should run checks of the service. Here, we've used the sensible24x7time period, as defined in Nagios Core's default configuration. Note that this can be different fromnotification_period; we can check the service's status without necessarily notifying a contact.notification_interval: This defines how long Nagios Core should wait between resending notifications when a service is in a state other thanOK.notification_period: This references the time period during which Nagios Core should send notifications if it finds a host in a state that is notOK. Here, we've again used24x7, but for some less critical services it might be appropriate to use a time period such asworkhours.
Note that we added the service definition in the same file as defining the host, directly after it. We can actually place the definition anywhere we like, but this happens to be a good way to keep things organized.
The service we've set up to monitor on sparta.example.net is an HTTP service, but that's just one of the many possible services we could monitor on our network. Nagios Core defines many different commands for its core plugin set, such as check_smtp, check_dns, and others; all these commands, in turn, point to the programs that actually perform the check and return the results to the Nagios Core server to be dealt with. The important thing to take away from this is that a service can monitor pretty much anything and there are hundreds of plugins available for common network monitoring checks available on the Nagios Exchange website (http://exchange.nagios.org/).
There are a great deal more possible directives for services. In practice, we often want to have a service template object with common values, and then extend it for each service we need to check. This allows us to define values that we might want for a number of services, such as how long they should be in a CRITICAL state before a notification event takes place and someone gets contacted to deal with the problem.
One such template that Nagios Core's default configuration defines is called generic-service and we can use it as a basis for our new service by referring to it with the use keyword:
define service {
    use                    generic-service
    host_name              sparta.example.net
    service_description    HTTP
    check_command          check_http
}
This may work well for you, as there are a lot of very sensible default values set by the generic-service template, which makes things a lot easier. We can inspect these values by looking at the template's definition at /usr/local/nagios/etc/objects/templates.cfg. This is the same file that includes the generic-host definition that we may have used earlier.
In this recipe, we'll create a new contact with which hosts and services can interact with each other, chiefly to inform the contact when the state of hosts or services changes. We'll use the simplest example of setting up an e-mail contact and configuring an existing host so that this contact receives an e-mail message when Nagios Core's host checks fail and the host is apparently unreachable. In this instance, we'll arrange for nagios@example.net to receive an e-mail message whenever the sparta.example.net host goes from the DOWN state to the UP state, or vice-versa.
You should have a working Nagios Core 4.0 or better server running with a web interface and at least one host to check. If you need to do this first, refer to the Creating a new network host recipe in this chapter.
For this particular kind of contact, you'll also need to have a working SMTP daemon running on the monitoring server, such as Exim or Postfix. You should verify that you're able to send messages to the target address and that they're successfully delivered to the host you expect them to be delivered to.
We can add a simple new contact to the Nagios Core configuration as follows:
Change to Nagios Core's configuration directory; ideally, it should contain a file that's devoted to contacts, such as
contacts.cfghere, and edit that file:# cd /usr/local/nagios/etc/objects # vi contacts.cfg
Add the following contact definition to the end of the file, substituting your own values for the properties in bold as you need them:
define contact {
    contact_name                   spartaadmin
    alias                          Administrator of sparta.example.net
    email                          nagios@example.net
    host_notification_commands     notify-host-by-email
    host_notification_options      d,u,r
    host_notification_period       24x7
    service_notification_commands  notify-service-by-email
    service_notification_options   w,u,c,r
    service_notification_period    24x7
}
Edit the definition for the
sparta.example.nethost and add or replace the definition ofcontactsfor the appropriate host to our new contactspartaadmin:define host { host_name sparta.example.net alias sparta address 192.0.2.21 max_check_attempts 3 check_period 24x7 check_command check-host-alive contacts spartaadmin notification_interval 60 notification_period 24x7 }Reload the configuration:
# /etc/init.d/nagios reload
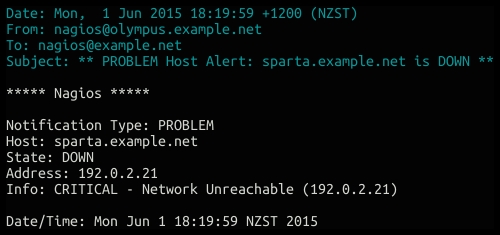
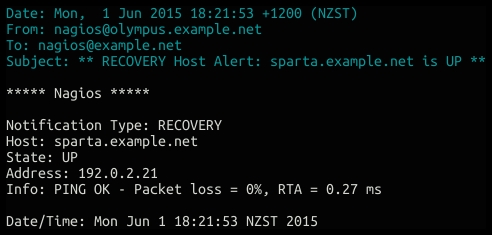
When we are done with the preceding steps, the next time our host changes its state we should receive messages like the one shown in the following screenshot:
When the host becomes available again, we should receive a recovery message as follows:
If possible, it's worth testing this setup with a test host that we can safely bring down and then up again to verify that we receive appropriate notifications.
This configuration adds a new contact to the Nagios Core configuration and references it in one of the hosts as the appropriate contact to be used when the host has problems.
We've defined the required directives for the contact and a couple of others:
contact_name: This defines a unique name for the contact so that we can refer to it in host and service definitions, or anywhere else we might need to do so in the Nagios Core configuration.alias: This defines a human-friendly name for the contact, perhaps a brief explanation of who the person or group is and/or what they're responsible for.email: This defines the e-mail address of the contact, since we're going to be sending messages by e-mails.host_notification_commands: This defines the command or commands to be run when a state change on a host prompts a notification for this contact. In this case, we're going to send e-mails to the the contact about the results with a predefined command callednotify-host-by-email.host_notification_options: This specifies different kinds of host events for which this contact should be notified. Here, we're usingd,u,r, which means that this contact will receive notifications for a host going down, becoming unreachable, or coming back up.host_notification_period: This defines the time period in which this contact can be notified by any host events. If a host notification is generated and defined to be sent to this contact, but falls outside this time period, the notification will not be sent.service_notification_commands: This defines the command or commands that are to be run when a state change on a service prompts a notification for this contact. In this case, we're going to send an e-mail to the contact about the results with a predefined command callednotify-service-by-email.service_notification_options: This specifies different kinds of service events for which this contact should be notified. Here, we're usingw,u,c,r, which means that we want to receive notifications about services enteringWARNING,UNKNOWN, orCRITICALstates, and also when they recover and go back to theOKstate.service_notification_period: This is the same as forhost_notification_period, except that this directive refers to notifications about services, not hosts.
Note that we placed the definition for the contact in contacts.cfg, which is a reasonably sensible place. However, we can place the contact definition in any file that Nagios Core will read as part of its configuration; we can organize our hosts, services, and contacts any way we like, but it helps to choose some sort of system, so we can easily identify where definitions are likely to be when we need to add, change, or remove them.
If we define a lot of contacts with similar options, it may be appropriate to have individual contacts extend contact templates, so they can inherit those common settings. The default Nagios Core configuration includes such a template, called generic-contact. We could instead define our new contact as an extension of this template as follows:
define contact {
    use           generic-contact
    contact_name  spartaadmin
    alias         Administrator of sparta.example.net
    email         nagios@example.net
}
To see the directives defined for generic-contact, you can inspect its definition in the /usr/local/nagios/etc/objects/templates.cfg file.
In this recipe, you'll learn the most basic step in debugging a Nagios Core configuration, which is to verify it. This is a very useful step to take before restarting the Nagios Core server to load an altered configuration because it will warn us about possible problems. This is a good recipe to follow if you're not able to start the Nagios Core server at any point because of configuration problems and instead get output like this:
# /etc/init.d/nagios reload
Running configuration check... CONFIG ERROR!  Check your Nagios configuration.
We can verify the Nagios Core configuration as follows:
Run the following command, substituting the path to the
nagiosbinary and our primarynagios.cfgconfiguration file if necessary:# /usr/local/nagios/bin/nagios -v /usr/local/nagios/etc/nagios.cfgIf the output is very long, it might be a good idea to pipe it through a pager program, such as
less:# /usr/local/nagios/bin/nagios -v /usr/local/nagios/etc/nagios.cfg | lessInspect the output and look for warnings and problems. Here's an example of the part of the output we can expect if our configuration is correct:

If there's a problem of some sort, we might instead see lines like the following, which is just an example of a possible error; here, my configuration is wrong because I neglected to add a
contact_namedirective for a new contact:
The configuration is parsed as though Nagios Core were about to start up, to check that the configuration all makes sense. It will run basic checks, such as looking for syntax errors, and will also check things such as having at least one host and service to monitor. Some of the things it reports are warnings, meaning that they're not necessarily problems, such as hosts not having any services monitored or not reporting to any contacts.
This is the quickest way to get an idea of whether the Nagios Core configuration is sane and will work correctly and whenever, there's trouble restarting the Nagios Core server, it's a good idea to check the output of this command.
The program at /usr/local/nagios/bin/nagios is actually the same program that runs the Nagios Core server, but the -v part of the command is a switch for the program that, instead of starting the server, verifies the configuration and shows any problems with it. The second path is to the configuration file with which Nagios Core starts, which in turn imports configuration files for objects such as the contact, host, and service definitions.
The Writing debugging information to the Nagios Core log file recipe, Chapter 10, Security and Performance
In this recipe, you'll learn how to create a new hostgroup; in this case, to group two web servers together. It is useful to have distinct groups of hosts that might have different properties, such as being monitored by different teams or running different types of monitored services. It also allows us to view a group breakdown in the Nagios Core web interface and to apply a single service to a whole group of hosts rather than doing so individually. This means that all we would have to do to get a new host monitored in the same way as all the other hosts would be to add it to the group, rather than having to specify the configuration manually.
You should have a working Nagios Core 4.0 or better server running with a web interface.
You should also have at least two hosts that form a meaningful group; perhaps they're similar kinds of servers, such as web servers, or are monitored by the same team, or both at a physical location.
In this example, we have two web servers, sparta.example.net and athens.example.net, and we're going to add them to a group called webservers.
We can add our new hostgroup webservers to the Nagios Core configuration as follows:
Create a new file called
/usr/local/nagios/etc/objects/hostgroups.cfg, if it doesn't already exist:# cd /usr/local/nagios/etc/objects # vi hostgroups.cfg
Write the following code into the new file, substituting the names in bold to suit your own layout:
define hostgroup {
 hostgroup_name  webservers
 alias           Webservers with Greek names
}
Move a directory up and then edit the
nagios.cfgfile:# cd .. # vi nagios.cfg
Add this line to the end of the file:
cfg_file=/usr/local/nagios/etc/objects/hostgroups.cfg
For each of the hosts we want to add to the group, find their definitions and add a
hostgroupsdirective to put them into the new hostgroup. In this case, our definitions forsparta.example.netandathens.example.netends up looking like this:define host { use linux-server host_name sparta.example.net alias sparta address 192.0.2.21 hostgroups webservers } define host { use linux-server host_name athens.example.net alias athens address 192.0.2.22 hostgroups webservers }Restart Nagios:
# /etc/init.d/nagios reload
We should now be able to visit the Host Groups section of the web interface and see a new hostgroup with two members:
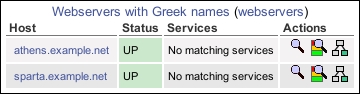
The preceding configuration that we have added includes a new file with a new hostgroup into the Nagios Core configuration and inserts appropriate hosts into the group. The hostgroup creates a separate section in the web interface for us to get a quick overview of only the hosts in that particular group.
The way we've added hosts to the preceding groups is actually not the only way to do it. If we prefer, we can instead name the hosts for the group inside the group definition, using the members directive, so we could have something like the following:
define hostgroup {
    hostgroup_name  webservers
    alias           Webservers with Greek names
    members         athens.example.net,sparta.example.net
}
We can also make a hostgroup that always includes every single host, if we find that useful:
define hostgroup {
    hostgroup_name  all
    alias           All hosts
    members         *
}
If we're going to be using hostgroups extensively in our Nagios Core configuration to add hosts to groups, we should use whichever of the two methods we think is going to be easiest for us to maintain.
It's worth noting that a host can be in more than one group and there is no limit on the number of groups we can declare, so we can afford to be quite liberal with how we group our hosts into any sort of useful categories. examples of hostgroups could be organizing servers by a function, manufacturer, or colocation customer or organizing routers by BGP or OSPF usage; it all depends on what kind of network we're monitoring.
The Creating a new host section in this chapter
The Running a service on all hosts in a group section in this chapter
Using inheritance to simplify a configuration, Chapter 9, Managing Configuration
In this recipe, we'll create a new servicegroup. This allows us to make meaningful groups out of a set of arbitrary services so that we can view the status of all those services in a separate part of the web administration area.
You should have a working Nagios Core 4.0 or better server running with a web interface.
You should also have at least two defined services that form a meaningful group; perhaps they're similar kinds of services, such as mail services, are monitored by the same team, or they are both on the same set of servers at a physical location.
In this example, we have three servers performing mail functions: smtp.example.net, pop3.example.net, and imap.example.net, running an SMTP, POP3, and IMAP daemon, respectively. All three of the hosts are set up in Nagios Core, and so are their services. We're going to add them into a new servicegroup called mailservices.
Here are the definitions of the hosts and services used in this example, so you can see how everything fits together:
define host {
    use                 linux-server
    host_name           smtp.example.net
    alias               smtp
    address             192.0.2.31
    hostgroups          webservers
}
    define service {
        use                  generic-service
        host_name            smtp.example.net
        service_description  SMTP
        check_command        check_smtp
    }
define host {
    use                 linux-server
    host_name           pop3.example.net
    alias               pop3
    address             192.0.2.32
    hostgroups          webservers
}
    define service {
        use                  generic-service
        host_name            pop3.example.net
        service_description  POP3
        check_command        check_pop
    }
define host {
    use                 linux-server
    host_name           imap.example.net
    alias               imap
    address             192.0.2.33
    hostgroups          webservers
}
    define service {
        use                  generic-service
        host_name            imap.example.net
        service_description  IMAP
        check_command        check_imap
}We can add our new servicegroup with the following steps:
Change to our Nagios Core configuration objects directory and edit a new file called
servicegroups.cfg:# cd /usr/local/nagios/etc/objects # vi servicegroups.cfg
Add the following definition to the new file, substituting the values in bold with your own values:
define servicegroup {
    servicegroup_name  mailservices
    alias              Mail services
}
Move a directory up and then edit the
nagios.cfgfile:# cd .. # vi nagios.cfg
Add this line to the end of the file:
cfg_file=/usr/local/nagios/etc/objects/servicegroups.cfg
For each of the services we want to add to the group, find their definitions and add a
servicegroupsdirective to put them into the new servicegroup. The definitions may end up looking something like this:define service { use generic-service host_name smtp.example.net service_description SMTP check_command check_smtp servicegroups mailservices } define service { use generic-service host_name pop3.example.net service_description POP3 check_command check_pop servicegroups mailservices } define service { use generic-service host_name imap.example.net service_description IMAP check_command check_imap servicegroups mailservices }Restart Nagios using the following command:
# /etc/init.d/nagios reload
We should now be able to visit the Service Groups section of the web interface and see a new servicegroup with three members:
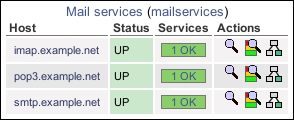
The configuration we've added in the preceding section includes a new file with a new servicegroup into the Nagios Core configuration and inserts appropriate services into the group. The servicegroup creates a separate section in the web interface for us to get a quick overview of only the services in that particular group.
The way we've added services to the preceding groups is not the only way to do it. If we prefer, we can instead name the services (and their applicable hosts) for the group inside the group definition using the members directive, so we could have something like the following:
define servicegroup {
    servicegroup_name  mailservices
    alias              Mail services
    members            smtp.example.net,SMTP,pop3.example.net,POP3,imap.example.net,IMAP
}
Note that we need to specify both the host that the service is on and the services to be monitored on it. This string needs to be comma-separated. The hostname always comes first, but it can be followed by any number of its services that are to be monitored.
This allows us to make a servicegroup that always includes every single service on every host, if we find that useful:
define servicegroup {
    servicegroup_name  all
    alias              All services
    members            *
}
If we're going to use servicegroup definitions extensively in our Nagios Core configuration to add services to groups, we should use whichever of the two methods we think is going to be easiest for us to maintain.
It's worth noting that a service can be in more than one group and there is no limit on the number of groups we can declare, so we can afford to be quite liberal with how we group our services into any sort of useful categories. A few examples of this could be organizing services by the appropriate contact for their notifications, internal functions, or customer-facing functions.
The Creating a new service section in this chapter
The Running a service on all hosts in a group section in this chapter
Using inheritance to simplify a configuration, Chapter 9, Managing Configuration
In this recipe, we'll create a new contactgroup into which we can add our contacts. Like hostgroups and servicegroups, contactgroups mostly amount to convenient shortcuts. In this case, it allows us to define a contactgroup as the recipient of notifications for a host or service definition. This means that we could define an ops group, for example, and then even if people joined or left the group, we wouldn't need to change any definitions for the hosts or services.
You should have a working Nagios Core 4.0 or better server running.
You should also have at least two contacts that form a meaningful group. In this case, we have two staff members, John Smith and Jane Doe, who are both part of our network operations team. We want them both to be notified for all the appropriate hosts and services, so we'll add them to a group called ops. Here are the definitions with which we're working:
define contact {
    use           generic-contact
    contact_name  john
    alias         John Smith
    email         john@example.net
}
define contact {
    use           generic-contact
    contact_name  jane
    alias         Jane Doe
    email         jane@example.net
}We can create our new ops contactgroup as follows:
Change to our Nagios Core configuration objects directory and edit the
contacts.cfgfile:# cd /usr/local/nagios/etc # vi contacts.cfg
Add the following definition to the file, substituting in your own values in bold as appropriate:
define contactgroup {
    contactgroup_name  ops
    alias              Network operators
}
For each of the contacts that we want to add to the group, find their definitions and add the
contactgroupsdirective to them. The definitions will end up looking something like this:define contact { use generic-contact contact_name john alias John Smith email john@example.net contactgroups ops } define contact { use generic-contact contact_name jane alias Jane Doe email jane@example.net contactgroups ops }Reload the configuration:
# /etc/init.d/nagios reload
With this group set up, we are now able to use it in the contactgroups directive for hosts and services to define which contacts notifications should be sent to. Notifications are sent to all the addresses in the group. This can replace the contacts directive, where we name contacts individually.
As an example, consider the following service definition:
define service {
    use                  generic-service
    host_name            sparta.example.net
    service_description  HTTP
    check_command        check_http
    contacts             john,jane
}
Instead of having a service definition as the preceding one, we could use this:
define service {
    use                  generic-service
    host_name            sparta.example.net
    service_description  HTTP
    check_command        check_http
    contact_groups       ops
}
If John Smith were to leave the operations team, we could simply remove his contact definition and nothing else would require changing; from then on, only Jane would receive the services notification. This method provides a layer of abstraction between contacts and the hosts and services for which they receive notifications.
In this recipe, we'll add a new time period definition to the Nagios Core configuration so that it allows us to set up monitoring for hosts and services only during weekdays. There's a default configuration defined as workhours that would almost suit us, except it doesn't include evenings, so we'll make a new one from scratch. We'll make another one to cover the weekends, too.
You should have a working Nagios Core 4.0 or better server running. You should also have a clear idea about when the boundaries for the time period you want to define are.
We can set up our new time period, which we'll call weekdays, as follows:
Change to our Nagios Core configuration objects directory and edit the file called
timeperiods.cfg:# cd /usr/local/nagios/etc/objects # vi timeperiods.cfg
Add the following definitions to the end of the file:
define timeperiod {
    timeperiod_name  weekdays
    alias            Weekdays
    monday           00:00-24:00
    tuesday          00:00-24:00
    wednesday        00:00-24:00
    thursday         00:00-24:00
    friday           00:00-24:00
}
define timeperiod {
    timeperiod_name  weekends
    alias            Weekends
    saturday         00:00-24:00
    sunday           00:00-24:00
}
Reload the configuration:
# /etc/init.d/nagios reload
In our host and service definitions, there are two directives, check_period and notification_period, which are used to define the times during which a host or service should be checked and the times when notifications about it should be sent. The two examples normally defined in the stock Nagios Core configuration are the 24x7 period and the workhours period, which are defined in the timeperiods.cfg file that we just edited and used in several of the examples and templates.
We've just added two more of these time periods that we can now use in our definitions for hosts and services. The first is called weekdays, which corresponds to any time during a weekday; the second is called weekends, which corresponds to any time that's not a weekday. Note that, in both cases, we specified the dates and times by naming each individual day and the times to which it corresponded.
The definitions for dates are flexible, and can be defined a variety of ways. The following are all valid syntaxes to define days and time periods:
june 1 – july 15 00:00-24:00: This syntax denotes June 1 to July 15, inclusivethursday -1 00:00-24:00: This syntax denotes the last Thursday of every monthday 1 – 10 13:00-21:00: This syntax denotes the time from 1 p.m. to 9 p.m. on any day from the 1st day of any month to the 10th day of the same month
In a typical practice, it's likely that the standard 24x7 and workhours definitions will be fine for day-to-day monitoring, maybe with a weekdays and weekends definition added. However, there may come a time when we need a specific host or service monitored on an unusual schedule, particularly if we're debugging a specific problem that only manifests around a certain time, or have a lot of contacts to manage, or a complex on-call roster.
Note that Nagios Core can behave in unusual ways, particularly with uptime reporting, if the time periods for our monitoring of hosts and services don't add up to 24 hours. Ideally, we should check and notify all our hosts and services in some way around the clock, but by dealing with the notifications in different ways depending on the schedule, for example paging the systems administrators about a noncritical system during work hours but just e-mailing them when they're asleep!
In this recipe, we'll create a new service but, instead of applying it to an existing host, we'll apply it to an existing hostgroup; in this case, to a hostgroup called webservers. The steps to do this are very similar to adding a service for just one host; only one directive is different.
You should have a working Nagios Core 4.0 or better server running with a web interface. You should be familiar with adding services to individual hosts.
You should also have at least one hostgroup defined, with at least one host in it; we'll use a group called webservers with the sparta.example.net and athens.example.net hosts defined in it.
For reference, here is the hostgroup definition and the definitions for the two hosts in it:
define hostgroup {
    hostgroup_name  webservers
    alias           Webservers
}
define host {
    use         linux-server
    host_name   athens.example.net
    alias       athens
    address     192.0.2.22
    hostgroups  webservers
}
define host {
    use         linux-server
    host_name   sparta.example.net
    alias       sparta
    address     192.0.2.21
    hostgroups  webservers
}We can create the service definition for the webservers group as follows:
Change to the directory containing the file in which the
webservershostgroup is defined and edit it:# cd /usr/local/nagios/etc/objects # vi hostgroups.cfg
Add the following just after the hostgroup definition. Change the lines in bold to suit your own template and hostgroup names:
define service {
    use                    generic-service
    hostgroup_name         webservers
    service_description    HTTP
    check_command          check_http
}
Reload the configuration:
# /etc/init.d/nagios reload
It's important to note that if we were already monitoring these hosts with a per-host service of the same name, we will need to remove the definitions as well; Nagios Core will not start if a service of the same description is already defined on the same host.
Adding a service to a hostgroup works exactly in the same way as adding it to an individual host, except it only requires one definition, which is then individually applied to all the hosts in the group. This means that it's a very good way to keep a Nagios Core configuration tidier. If we have a group with 50 different web servers in it and we need to monitor their HTTP services on the same basis for every one of them, we don't need to create 50 service definitions as well; we can just create one for its hostgroup, which amounts to a smaller and more easily updated configuration.
Like the host_name directive for services, hostgroup_name can actually have several hostgroups defined, separated by commas. This means that we can apply the same service to not just one group but several of them. For services that we would want to run on several different groups, for example basic PING monitoring, this can amount to a much more flexible configuration.
The Creating a new service section in this chapter
The Creating a new hostgroup section in this chapter
Using inheritance to simplify a configuration, Chapter 9, Managing Configuration

