


 Download code from GitHub
Chapter 1: Setting Targets and Identifying Problem Areas
Many people would consider report performance as the most critical area to focus on when trying to improve the speed of an analytics solution. This is largely true, because it is the most visible part of the system used by pretty much every class of user, from administrators to business executives. However, you will learn that there are other areas of a complete solution that should be considered if performance is to be managed comprehensively. For example, achieving good performance in the reporting layer might be of no consequence if the underlying dataset that powers the report takes a long time to be refreshed or is susceptible to failures due to resource limits or system limits being reached. In this case, users may have great-looking, fast reports that do not provide value due to the data being stale.
The author of this book has experienced the effects of poor report performance firsthand. In one project, a large utility company underwent a large migration from one reporting platform to another, from a different vendor. Even though the new platform was technically and functionally superior, the developers tried to copy the old reporting functionality across exactly. This led to poor design choices and very slow report performance. Millions of dollars in licensing and consulting fees were spent, yet most users refused to adopt the new system because it slowed them down so much. While it is extreme, this example demonstrates the potential ramifications when you do not build good performance into an analytical solution.
In this chapter, you will begin your journey to achieving good and consistent performance in Microsoft Power BI. To introduce the full scope of performance management, we will describe a Power BI solution as a stream of data from multiple sources being consolidated and presented to data analysts and information workers. We look at how data can be stored in Power BI and the different paths it can take before reaching a user. Many of the initial architectural design choices made in the early stages of the solution are very difficult and costly to change later. Hence, it is important to have a solid grasp of the implications of these choices and use a data-driven approach to help us decide what is best right at the start.
An area of performance management that is easily overlooked is that of setting performance targets. How do you know whether the experience you are delivering is great, merely acceptable, or poor? We will begin by exploring this theoretical area first to define our goals before diving into technical concepts.
This chapter is broken into the following sections:
- Defining good performance
- Considering areas that can slow you down
- Which choices affect performance?
Defining good performance
With the advent of ever-faster computers and the massive scale of processing available today by way of cloud computing, business users expect and demand analytical solutions that perform well. This is essential for competitive business decision making. Business Intelligence (BI) software vendors echo this need and tend to promise quick results in their sales and marketing materials. These expectations mean that it is uncommon to find users getting excited about how fast reports are or how fresh data is because it is something implicit to them having a positive experience. Conversely, when users have to wait a long time for a report to load, they are quite vocal and tend to escalate such issues via multiple channels. When these problems are widespread it can damage the reputation of both a software platform such as Power BI and the teams involved in building and maintaining those solutions. In the worst possible case, users may refuse to adopt these solutions and management may begin looking for alternative platforms. It's important to think about performance from the onset because it is often very costly and time-consuming to fix performance after a solution has reached production, potentially affecting thousands of users.
Report performance goals
Today, most BI solutions are consumed via a web interface. A typical report consumption experience involves not just opening a report, but also interacting with it. In Power BI terms, this translates to opening a report and then interacting with filters, slicers, and report visuals, and navigating to other pages explicitly or via bookmarks and drilling through. With each report interaction, the user generally has a specific intention, and the goal is to not interrupt their flow. A term commonly used in the industry is analysis at the speed of thought. This experience and the related expectations are very similar to navigating regular web pages or interacting with a web-based software system.
Therefore, defining good performance for a BI solution can take some cues from the many studies on web and user interface performance that have been performed over the past two or three decades; it is not a complex task. Nah, F. (2004) conducted a study focusing on tolerable wait time (TWT) for web users. TWT was defined as how long users are willing to wait before abandoning the download of a web page. Nah reviewed many previous studies that explored the thresholds at which users' behavioral intentions get lost and also when their attitudes begin to become negative. From this research, we can derive that a well-performing Power BI report should completely load a page or the result of an interaction ideally in less than 4 seconds and in most cases not more than 12 seconds. We should always measure report performance from the user's perspective, which means we measure from the time they request the report (for example, click a report link on the Power BI web portal) until the time the last report visual finishes drawing its results on the screen.
Setting realistic performance targets
Now that we have research-based guidance to set targets, we need to apply it to real-world scenarios. A common mistake is to set a single performance target for every report in the organization and to expect it to be met every single time a user interacts. This approach is flawed because even a well-designed system with heavy optimization could be complex enough to never meet an aggressive performance target. For example, very large dataset sizes (tens of GB) combined with complex nested DAX calculations that are then displayed on multiple hierarchical levels of granularity in a Table visual will naturally need significant time to be processed and displayed. This would generally not be the case with a report working over a small data model (tens of MB) containing a row of simple sum totals, each displayed within a Card visual.
Due to the variability of the solution complexity and other factors beyond the developer's control (such as the speed of a user's computer or which web browser they use) it is recommended that you think of performance targets in terms of typical user experience and acknowledge that there may be exceptions and outliers. Therefore, the performance target metric should consider what the majority of users experience. We recommend report performance metrics that use the 90th percentile of the report load or interaction duration, often referred to as P90. Applying the research guidance on how long a user can wait before becoming frustrated, a reasonable performance target would be P90 report load duration of 10 seconds or less. This means 90% of report loads should occur in under 10 seconds.
However, a single target such as P90 is still not sufficient and we will introduce further ideas about this in Chapter 7, Governing with a Performance Framework. For now, we should consider that there may be different levels of complexity, so it is recommended to set up a range of targets that reflect the complexity of solutions and the tolerance levels of users and management alike. The following table presents an example of a performance target table that could be adopted in an organization:
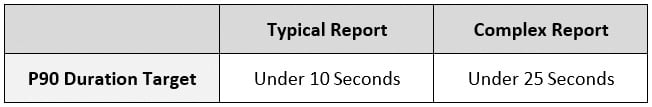
Figure 1.1 – Example Power BI report performance targets
Next, we will take a look at Power BI from a high level to get a broad understanding of the areas that need to be considered for performance improvement.
Considering areas that can slow you down
The next step in our performance management journey is to understand where time is spent. A Power BI solution is ultimately about exposing data to a user and can be thought of as a flow of data from source systems or data stores, through various Power BI system components, eventually reaching a user through a computer or mobile device. A simplified view of a Power BI solution is presented in Figure 1.2:
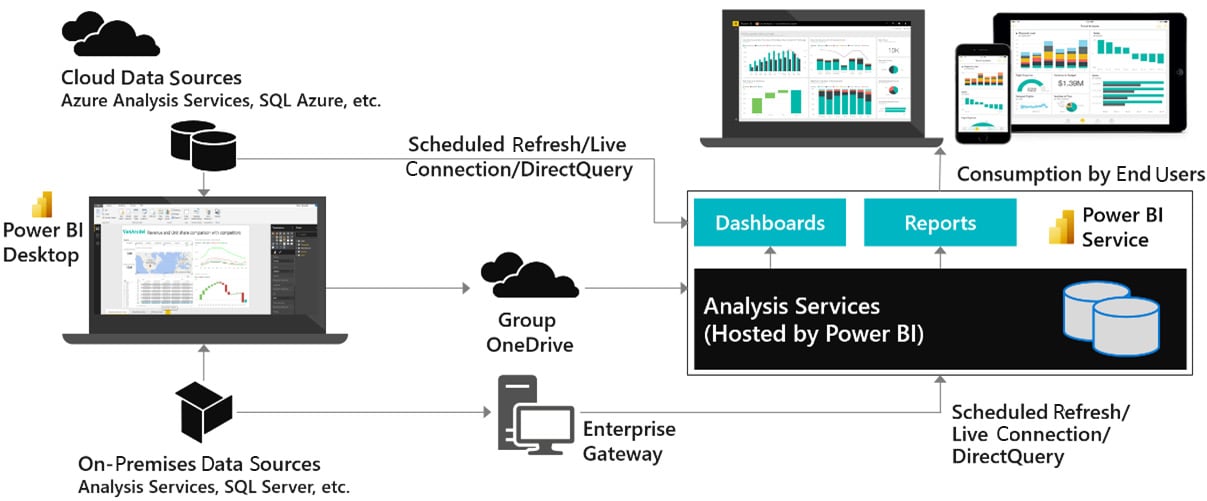
Figure 1.2 – Simplified overview of a Power BI solution
Next, we will briefly focus on the different parts of a typical solution to explain why each piece has important considerations for users and the effect poor performance can have. Some of these areas will be covered in more detail in Chapter 2, Exploring Power BI Architecture and Configuration.
Connecting data sources
The following diagram highlights the areas of the solution that are affected when data sources and connectivity methods do not perform well:
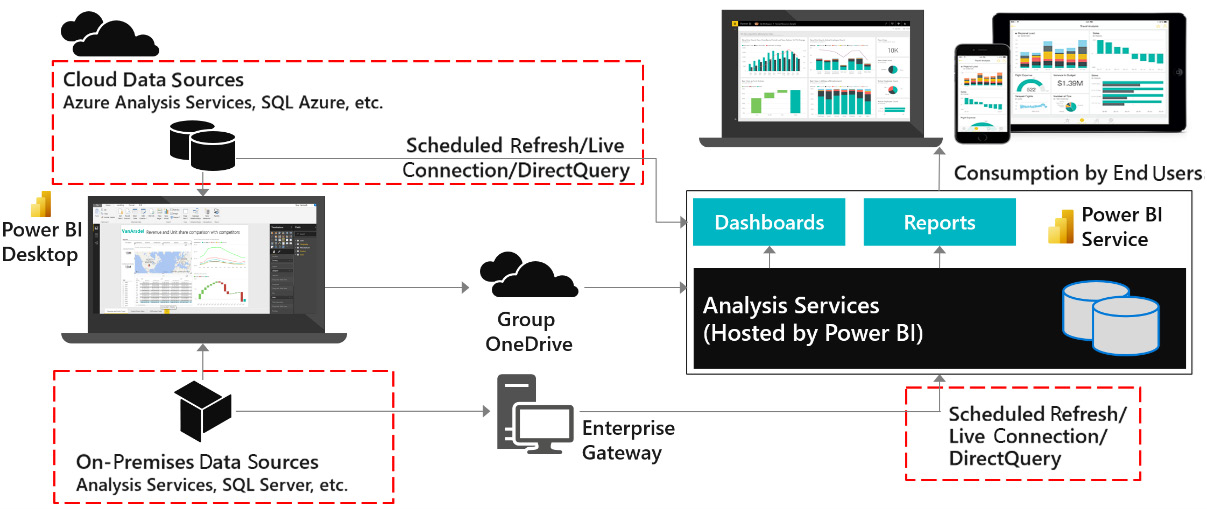
Figure 1.3 – Areas affected by data source and connectivity issues
Import mode
When using Import mode datasets, developers can experience sluggish user interface responsiveness when working with Power Query or M in Power BI Desktop. In extreme cases, this can extend data transformation development from hours to days. Once the solution is deployed, problems in this area can cause refresh times to extend or fail. The Power BI service has a refresh limit of 2 hours, while Power BI Premium extends this to 5 hours. Any refresh hitting this time limit will be canceled by the system.
DirectQuery mode
DirectQuery mode leaves the data at the source and needs to fetch data and process it within Power BI for almost every user interaction. Issues with this part of the configuration most often cause slow reports for users. Visuals will take a longer time to load, and users may get frustrated and then interrupt and interact with other views or filter conditions. This itself can issue more queries and ironically slow down the report even further by placing additional load on the external source system.
Live connection mode
Live connection mode originally referred exclusively to connections to external Analysis Services deployments, which could be cloud-native (Azure Analysis Services) or on-premises (SQL Server Analysis Services). More recently, this mode was extended to more use cases with the introduction of shared datasets and the ability to connect Power BI Desktop to build a report against a published dataset in the Power BI service. Since the underlying dataset could be Import or DirectQuery mode, the experience may vary as described in previous sections.
The Power BI enterprise gateway
The Power BI gateway is a middleware component used to connect to external data sources. It is usually part of the same physical or virtual network, and it establishes a secure outgoing connection to Power BI, over which it can send data to satisfy report queries and data refresh requests.
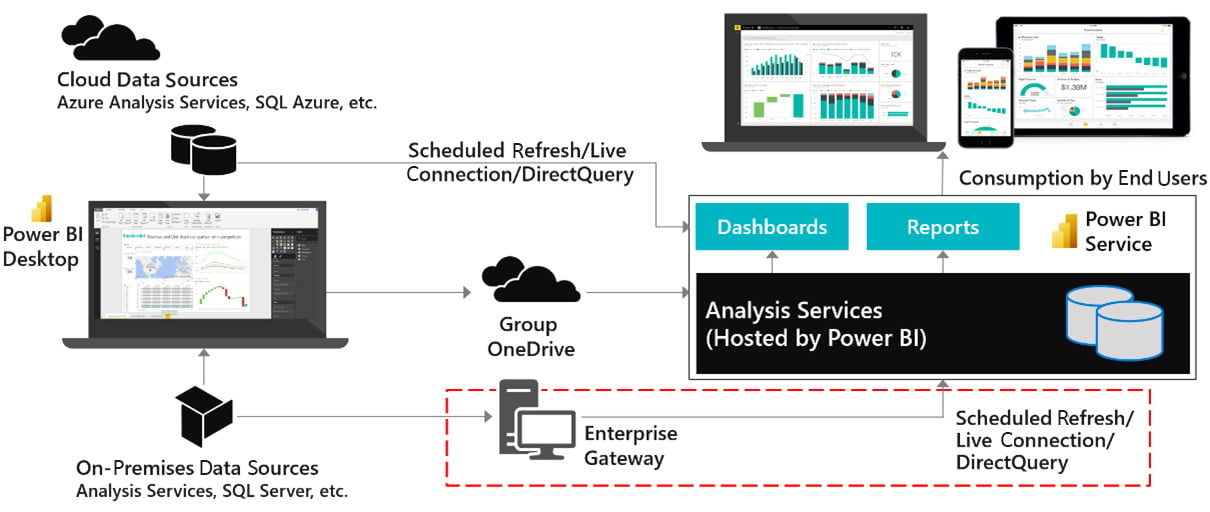
Figure 1.4 – Power BI enterprise gateway
The gateway is not just a conduit for data, which is a common misconception. In addition to providing authenticated and approved connections to data sources, it contains the mashup engine that performs data transformations and compresses data before sending it to the Power BI service. When the gateway is not optimized it can lead to long-running data refreshes, data refresh failures, slow report interactions, or visuals failing to load due to query timeouts.
Network latency
Network latency is about how long a piece of information takes to travel from one point to another in a network. Network latency is measured in milliseconds and is typically measured by performing a ping. A ping measures the time taken to send a small packet of information to a destination and receive a response acknowledging the message. Ping times that reach seconds can be problematic. The main drivers of network latency are geographical distance, the number of hops the information needs to take on the way, and how busy the networks are overall.
The following diagram highlights the possible paths that data takes within Power BI. It's worth noting that each individual arrow could have different latency, which means effects can be felt disproportionately by certain users or in certain parts of the solution.
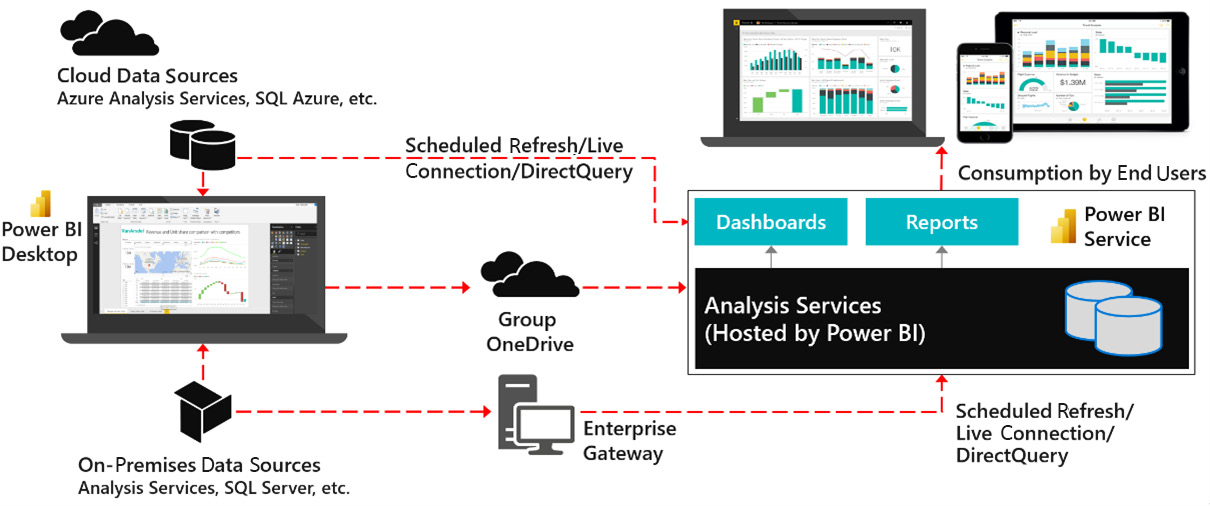
Figure 1.5 – Data movement affected by network latency
High network latency is most felt when users are interacting with reports. It is a significant contributor of slow performance primarily when there are many visuals in a report and therefore many queries to be executed. This is because such configurations require many individual pieces of information to be sent and received, and each one is affected by the latency.
The Power BI service
The Power BI service is the central part of any Power BI solution. The system components in the service are largely out of the control of developers and users. The stability and performance of these are monitored by Microsoft. The exception is Power BI Premium and Embedded, where the underlying infrastructure is still managed by Microsoft, but your administrators have many choices available on how to manage their dedicated capacity. This will be covered in detail in Chapter 13, Optimizing Premium and Embedded Capacities.
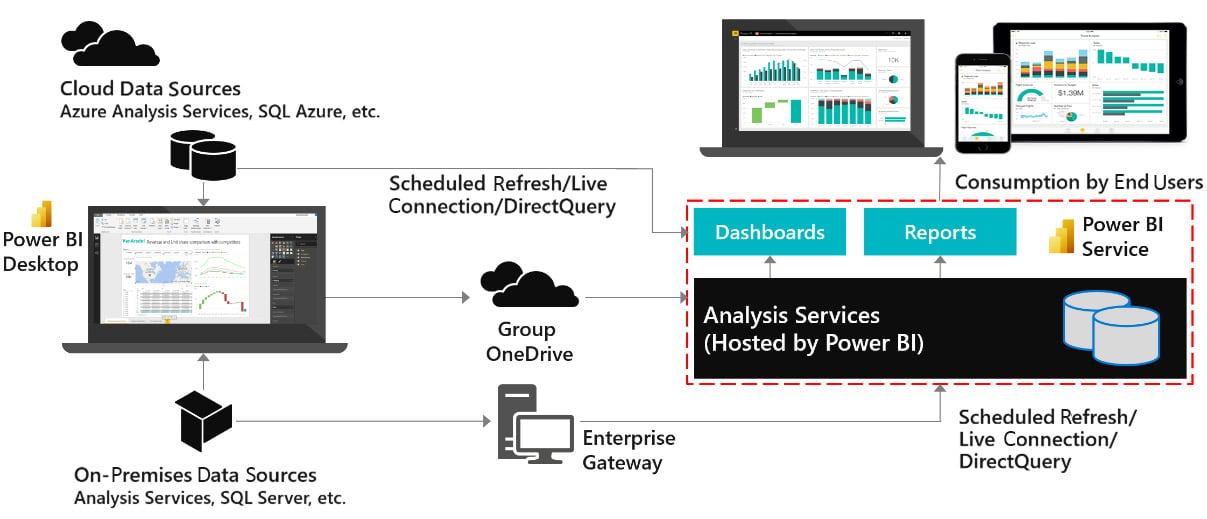
Figure 1.6 – The Power BI service
The major component of the Power BI service that is under your control is the Analysis Services engine, which sits at the core of any Power BI solution. Even with the Power BI service running efficiently under Microsoft's management, poor design choices related to Analysis Services data modeling and DAX calculations can lead to very large datasets, high memory usage, and slow query execution. This generally translates to slow reports. On Premium/Embedded capacities Analysis Services issues can have an exponential effect because they can affect multiple datasets on the capacity.
The final section of this chapter identifies specific areas in Power BI where you can achieve the same result with different design patterns. The choices you make here can affect performance.
Which choices affect performance?
While there are many aspects of each individual Power BI component that can be optimized for performance, the following list is a good summary that can serve as a checklist for every solution:
- Inappropriate use of DirectQuery/Import: Decisions here balance model size and refresh time with data freshness and report interactivity.
- Power Query design: Decisions here may fail to leverage the data source's native capabilities and therefore also fail to avoid additional work in the mashup engine.
- Data modeling: Decisions here may make the data model unnecessarily large, waste memory, consume more computing resources, and affect usability.
- Inefficient DAX calculations: Decisions here may fail to leverage the highly efficient internal VertiPaq Storage Engine and force operations in the Formula Engine.
- Complex or inefficient row-level security: Decisions here may create intensive calculations to resolve which rows the user can see.
- Poorly designed reports: Decisions here can put too much load on the user's device.
- Data source or network latency: Decisions here may place the data far away from the user.
Now that you have learned about the high-level areas of a solution that we need to consider to fully optimize performance, let's summarize the key learnings from this chapter.
Summary
As we have seen in this chapter, interacting with analytical reports is very similar to other web applications, so the user's level of engagement and satisfaction can be measured in similar ways. Studies of user interfaces and web browsing suggest that a report that is generated in less than 4 seconds is ideal. They also suggest that reports completing in 10-12-second durations or higher should be considered carefully as this is the point of user frustration.
You should set performance targets and be prepared for outliers by measuring against the 90th percentile (P90). Success may still require setting the right expectations by having different targets if you have highly complex reports.
It is important to remember that each component of Power BI and even the network itself can contribute to performance issues. Therefore, performance issues cannot be solved in isolation (for example, by only adjusting reports). This may require coordination with multiple teams and external vendors, particularly in large organizations.
In the next chapter, we will focus on the internal VertiPaq Storage Engine in Power BI to learn how to we can get it to optimize storage for us. We will also look at gateway optimization and general architectural advice to make sure the environment does not become a bottleneck.

