


The ability to draw graphics in the web browser is important in today's online landscape. While the need to effectively represent information has long existed in the empirical sciences, mathematics, and print media, it has taken on a new lease of life since the advent of the Web. With the colossal volumes of data that we now generate and the existence of a plethora of devices by which we can communicate with users, there has been a raise in both the desire and ability to visualize data online. In addition, the browser has grown from being a convenient entry point into a world of information to a truly interactive media outlet.
There are a number of technologies that have emerged to enable the process of browser-based drawing including, but not limited to VML and SVG, HTML5 Canvas, and WebGL. Each is generally suited to a particular purpose—2D vector drawing in the case of VML and SVG, bitmap drawing in the case of HTML5 Canvas, and 3D graphics rendering in the case of WebGL.
This book covers 2D vector drawing using Raphaël, a lightweight, open source, JavaScript library that uses SVG and VML to draw vector graphics in the browser. It provides a number of convenient methods for path drawing, vector transformations, interactivity via the DOM and path animation, and supports bitmap image embedding and text drawing. The library greatly simplifies drawing through these methods, acting as an adapter to the underlying (SVG and VML) specifications.
While an appreciation of the SVG specification will be sought throughout this book insofar as it will help us harness the full power of the library, an intimate understanding of the workings of SVG is not required and VML is not covered at all. Raphaël takes care of outputting graphics at the SVG/VML specification level, which means that we only need to concern ourselves with utilizing the library itself.
The library's creator and JavaScript virtuoso, Dmitry Baranovskiy, has done a great job documenting Raphaël at http://raphaeljs.com/ and we will make extensive reference to the documentation throughout the course of this book in order to concoct quality bespoke vector graphics in the browser.
In this chapter we will:
Discuss vector drawing on the Web
Talk more about Raphaël and the SVG specification
Look at some of the potential applications of Raphaël
Download the Raphaël library
Vector graphics are composed of a number of primitive geometric objects such as points, lines, shapes, and polygons. Each individual object is represented by a mathematical expression rather than some fixed physical point. Scaling vector graphics means changing the mathematical properties of the constituent objects and not the objects themselves and quality is not lost as a result. Fixed point, or bitmap, graphics are constrained to a particular resolution meaning that when they are scaled up the quality is lost:
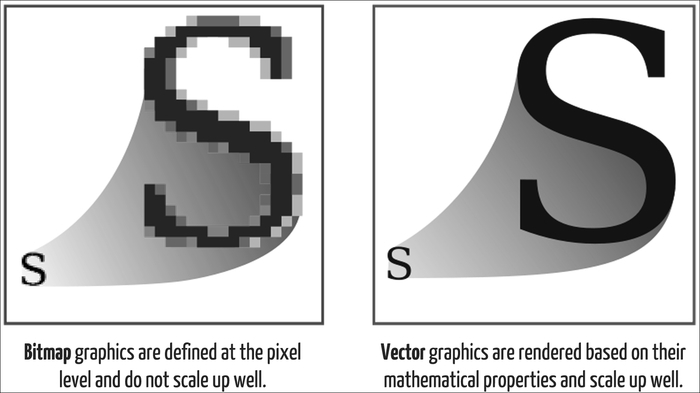
Source: Wikimedia Commons (http://en.wikipedia.org/wiki/File:Bitmap_VS_SVG.svg)
All graphics are ultimately rendered at the fixed point, or pixel, level. Your display is, after all, the sum of many millions of these points. The difference between bitmap and vector graphics is that in the case of vector graphics, the rendering is done at the very last moment. Scaling up a bitmap means creating new pixels based on the existing ones whereas with vector graphics, pixels are created at the resolution at which the final graphic is rendered based on the abstract mathematical definition of the object.
Vector drawing on the Web has predominantly taken shape in the following two forms:
Vector Markup Language (VML) devised by Microsoft and submitted to the W3C in 1998, describes a file format based on XML by which vector graphics can be created in Internet Explorer Versions 5 to 9
Scalable Vector Graphics (SVG) put forward by the W3C themselves in 2001, describes an XML-based file format that has been adopted by all major modern browsers including Firefox, Google Chrome, Safari, and Opera
Indeed, Versions 9 and 10 of Internet Explorer offer native support for SVG and VML has been deprecated in favor of SVG.
There are a number of JavaScript libraries available for drawing vector graphics. In addition to Raphaël, two popular libraries are Paper.js (http://paperjs.org) and D3.js (http://d3js.org). Each library is best suited to different tasks and the one that you use will depend upon what you're trying to achieve.
The following tables summarizes the Raphaël, Paper.js, and D3.js libraries:
|
Library |
IE 6, 7, 8 support |
Out-of-the-box (generic) visualizations |
Low-level (bespoke) visualizations |
|---|---|---|---|
|
Raphaël |
Yes |
No |
Yes |
|
D3.js |
No |
Yes |
No |
|
Paper.js |
No |
No |
No |
Raphaël is particularly well suited to creating bespoke vector graphics since it provides a low-level API to the SVG specification. It is very adept at working with primitive vector graphics and offers scope for working with existing SVG images. D3.js makes creating data visualizations straightforward owing to its API being very much oriented to mathematical operations and data manipulation but does not offer the same level of flexibility as Raphaël when dealing with vector graphics at the lower levels. Paper.js uses the HTML5 Canvas for vector graphics drawing and so offers less in the way of manipulating vectors but does, however, have very good facilities for manipulating images and working with paths.
Raphaël is the only framework that supports the VML specification and falls back on using VML in browsers (IE 6, 7, and 8) that do not have native SVG support (technically Paper.js can work on older browsers but the project does not support them). Despite the best efforts of the developer community at large, supporting older browsers is still a requirement for many companies.
SVG is the most widespread form of vector graphics specification implemented on the Web today. All modern browsers boast comprehensive support for the format and the latest mobile browsers offer at least basic support for SVG (including Safari 3.2 and higher, the Blackberry browser, and Chrome for Android).
SVG specifies an XML-based file format for creating vector graphics. For example, a basic path defining a black, solid line of width 1 from a point at x=50, y=50 in some arbitrary coordinate system to x=10, y=10 is described by the following code:
<path d="M50 50 L10 10" stroke-width="1" stroke="#000" />
In addition to paths, SVG supports shape drawing, text, fills and gradients, animation, and interaction whereby SVG images can respond to events triggered by a user. You can see some examples of SVG at http://raphaeljsvectorgraphics.com/the-graphical-web/raw-svg/.
Raphaël uses the XML-based language extensively and throughout this book you will become familiar with some of the syntax of SVG, especially in relation to path drawing.
Browser support aside, one good reason for using Raphaël over writing raw SVG is that it makes vector drawing easier. Take for example, drawing a rectangle and animating its width from 50 pixels to 100 pixels using raw SVG:
    <rect x="10" y="10" width="50" height="30">
        <animate attributeType="XML"
            attributeName="width"
            to="100"
            fill="freeze"
            dur="1s" />
    </rect>
Here we draw a rectangle at (10, 10) with a width of 50 and a height of 30 using the <rect> element. The nested
<animate> element then defines an animation over one second on the rectangle's width to a total width of 100, where fill="freeze" is used to retain the state of the rectangle after the animation is complete (otherwise its width would be reset to 50). This is fairly verbose given that what we are looking to achieve is quite straightforward. The equivalent animation in Raphaël is achieved by the following code:
var rect = paper.rect(10, 10, 50, 30);
rect.animate({
    width: 100
}, 1000);
Here, the animate and rect methods are more concise.
Raphaël also integrates well with other libraries, for example, jQuery, owing to being compact and appropriately namespaced (it creates just one global variable named Raphael).
Raphaël has been used in a variety of projects ranging from map visualization during the Town Hall @ the White House event (http://askobama.twitter.com/) to online games such as Ebocs (http://www.dejapong.com/ebocs/). The former usage demonstrates a popular application of the library, namely in cartography, while the latter is a less common but a viable application of the library for creating games with a low sprite (bitmap image) count.
Raphaël is particularly well suited to cartography as the library affords us the ability to add interactivity to DOM elements and to scale graphics up and down without the loss of quality. A nice example of this can be found at http://raphaeljs.com/australia.html, where an interactive choropleth map of Australia is demoed (we will look at creating choropleth maps in Chapter 6, Working with Existing SVGs, of this book).
There are other, more subtle, applications of the library. While CSS3 is becoming increasingly prevalent, many properties have not yet been unified across all browsers and there is little or no support in older browsers. In some situations, utilizing Raphaël to achieve effects to the same end might be more suitable for the project that you are working on. A demo that looks at transforming images can be found at http://raphaeljsvectorgraphics.com/the-graphical-web/css3-raphael-transforms/.
Throughout this book we will work with Version 2.1.0 of Raphaël, which is the latest version of the library at the time of writing. The latest version of library can be downloaded from http://raphaeljs.com. The project is hosted on GitHub at https://github.com/DmitryBaranovskiy/raphael/ and older versions of the library are tagged at https://github.com/DmitryBaranovskiy/raphael/tags should you ever require them.
It is recommended that you download both the compressed and uncompressed versions of the library when beginning a new project. During development you should use the uncompressed version of Raphaël: you may want to refer to specific methods in the source code, and debug messages will make more sense in the uncompressed version. For production purposes, you should always use the compressed version. The compressed version is significantly smaller in file size and using it will reduce the load on your server and the response time of your pages.
You can reduce the size of Raphaël further by gzipping it. Your web server is usually responsible for gzipping static content. Apache's mod_gzip, for example, can compress HTML, text, CSS, and JavaScript files (for more information you should consult your web server's documentation).
The most important aspect of learning how to utilize a new technology is understanding the concepts driving it. Code samples will be used where appropriate throughout this book but reams of unnecessary code will be omitted in favor of concentrating on the core aspects of the task at hand. Where appropriate, you should refer to the source code and website (http://raphaeljsvectorgraphics.com) accompanying this book.
The projects in this book will be fairly self-contained and so the project structure will be kept quite simple. As your own projects grow, you should pay careful attention to project structure.
You should also consider merging and compressing your CSS and JavaScript files when pushing your work into production. This will have the effect of increasing the responsiveness of your site or application and reducing load on your web server. Useful tools for achieving this are minify (http://code.google.com/p/minify/) and Google's Closure Tools (https://developers.google.com/closure/).
It is often remarked that vector drawing in the browser is an under-utilized technology. Developers are often impressed by demonstrations of the technology but are not always sure to what extend it may be used. Hopefully after reading this chapter you will have a better understanding of what Raphaël does and the types of problems it is able to solve.
In the next chapter, we will look at basic drawing with Raphaël and creating our first vector drawings in the browser.