


Gathering Your Cartography Toolbox
Welcome to the world of cartography with D3. In this chapter, you will be given all the tools you need to create a map using D3. These tools exist freely and openly, thanks to the wonderful world of open source. Given that we are going to be speaking in terms of the web, our languages will be HTML, CSS, and JavaScript. After reading this book, you will be able to use all three languages effectively in order to create maps on your own.
In this chapter, we will cover the following topics:
- Quick bootstrap
- Step-by-step bootstrap
- Installing key libraries and tools
- Using the web browser as a development tool
When creating maps in D3, your toolbox is extraordinarily light. The goal is to focus on creating data visualizations and remove the burden of heavy IDEs and map-making software.
Quick bootstrap
The following instructions assume that Node.js , npm, and git are already installed on your system. If not, feel free to follow the Step-by-Step bootstrap section.
Type the following in the command line to install a light webserver::
npm install -g http-server
Install TopoJSON:
npm install -g topojson
Clone the sample code with included libraries:
git clone --depth=1 https://github.com/PacktPublishing/Learning-D3js-4-Mapping-Second-Edition.git
Go to the root project:
cd d3jsMaps
To start the server type the following:
http-server
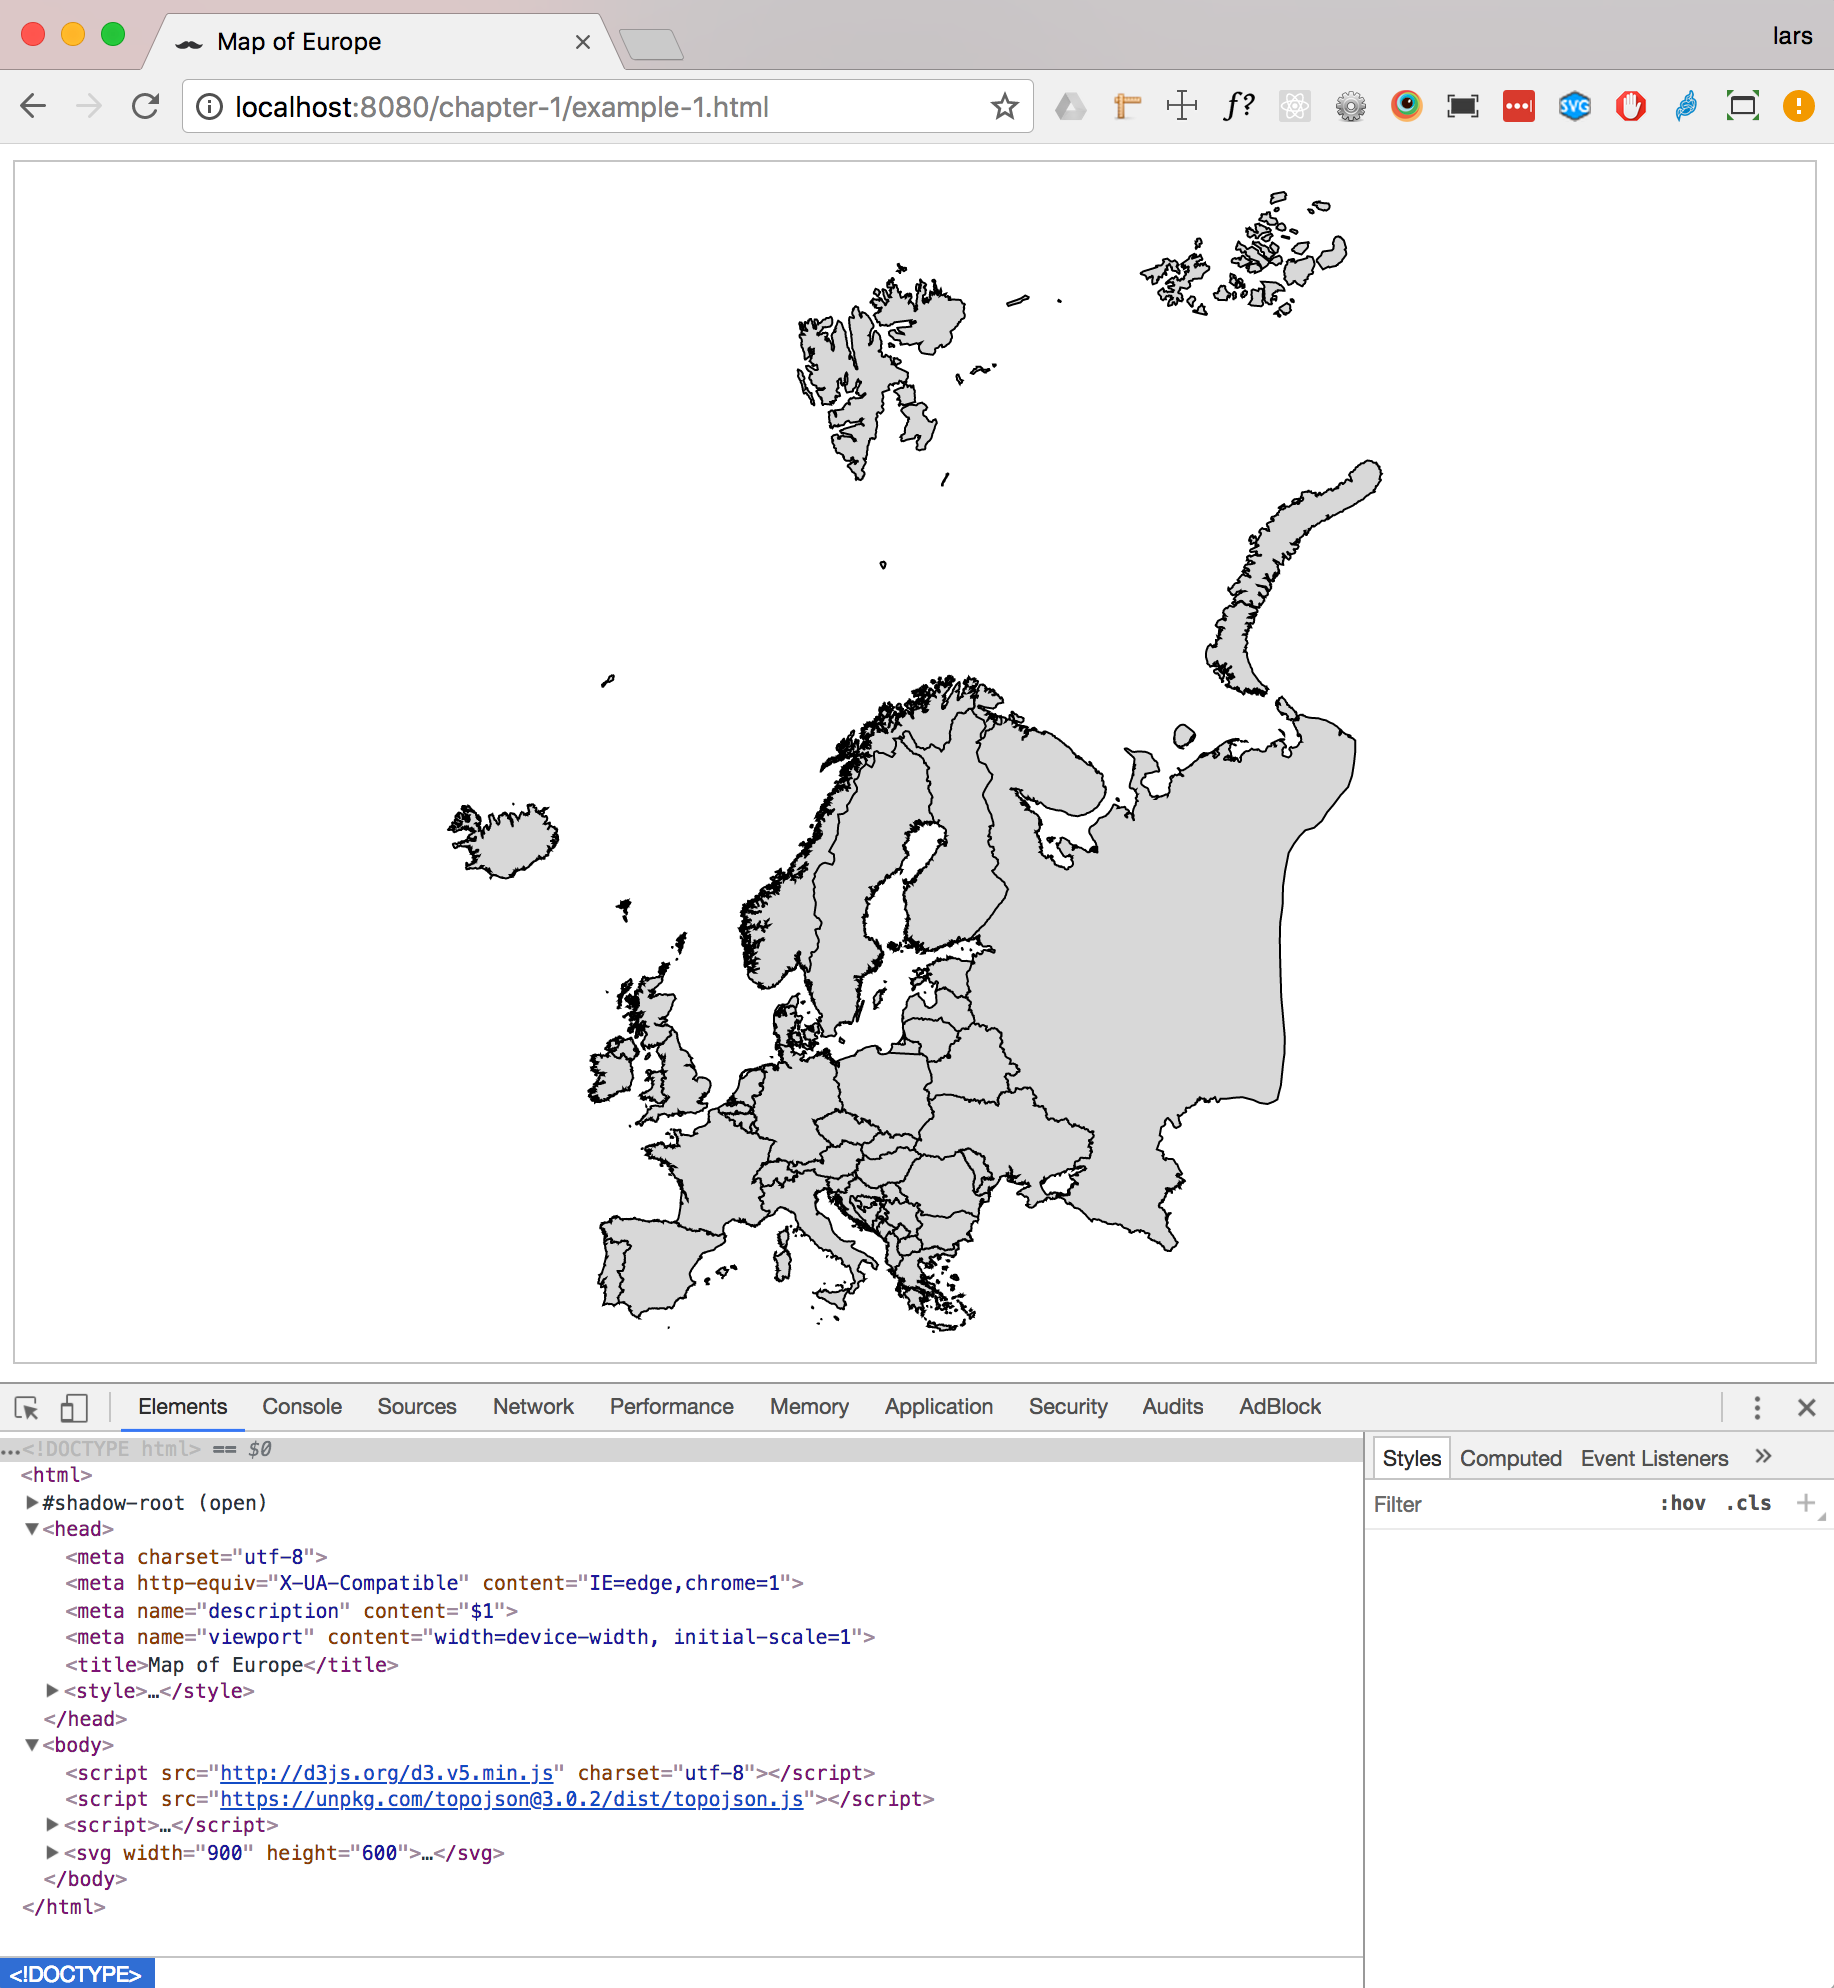
Now, open your web browser to http://localhost:8080/chapter-1/example-1.html, and you should see the following map:

Step-by-step bootstrap
The next section covers detailed instructions to set up your development environment if you do not have any of the required packages. By the end of the chapter, you will have a working environment for the rest of the book (an example of a running map and an initial look at tools used to create visualizations).
A lightweight web server
Technically, most of the content we will craft can render directly in the browser without the use of a web server. However, we highly recommend you do not go ahead with this approach. Running a web server in your local development environment is extremely easy and provides several benefits:
- Geographic information, statistical data, and visualization code can be clearly separated into isolated files
- API calls can be stubbed and simulated, allowing easy integration into a full-stack application in the future
- It will prevent common mistakes when making Fetch calls to fetch geographic and statistical data (for example, the same-origin policy)
For our choice of web server and other tools in our toolbox, we will rely on a Node.js package named http-server. Node.js is a platform built on Chrome's JavaScript runtime, which is used to build fast, scalable network applications. The platform includes Node Package Manager (npm), which was created by other members of the vibrant Node.js community and allows the developer to quickly install packages of pre-built software.
To install Node.js, simply perform the following steps:
- Go to the website http://nodejs.org.
- Click on the INSTALL button.
- Open the downloaded package and follow the defaults.
To test the installation, type the following in the command line:
node -v
Something similar should return:
v0.10.26
This means we have installed the given version of Node.js.
TopoJSON is a command-line utility used to create files in the TopoJSON-serialized format. The TopoJSON format will be discussed in detail in Chapter 6, Finding and Working with Geographic Data. The TopoJSON utility is also installed via npm.
We have already installed Node.js and npm, so enter the following on the command line:
npm install -g topojson
npm install –g shapefile
Once the installation is complete, you should check the version of TopoJSON installed on your machine just as we did with Node.js:
geo2topo --version
If you see version 3.x, it means you have successfully installed TopoJSON.
If you're using Windows, the basic steps to get TopoJSON working are as follows:
- Install Python 2.x (3.x not supported at the time of writing this book).
- Install Microsoft Visual Studio C++ 2012 for Desktop (Express).
Using the web browser as a development tool
Although any modern browser supports Scalable Vector Graphics (SVG) and has some kind of console, we strongly recommend you use Google Chrome for these examples. It comes bundled with developer tools that will allow you to very easily open, explore, and modify the code. If you are not using Google Chrome, please go to http://www.google.com/chrome and install Google Chrome.
Installing the sample code
Go to https://github.com/climboid/d3jsMaps and either clone the repo, if you are familiar with Git cloning, or simply download the zipped version. Once it is downloaded, make sure to extract the file if you have it zipped.
Use the command prompt or terminal to go to the directory where you downloaded your file. For instance, if you downloaded the file to your desktop, type in the following:
cd ~/Desktop/d3jsMaps
To start the server type the following:
http-server
The last command will launch the simple server we installed previously for the supplied sample code. This means that, if you open your browser and go to http://localhost:8080/chapter-1/example-1.html, you should see a map
of Europe, similar to the one shown earlier.
Working with the developer tools
It's time to open the developer tools. In the top-right corner of the browser, you will see the icon as shown in the following screenshot:
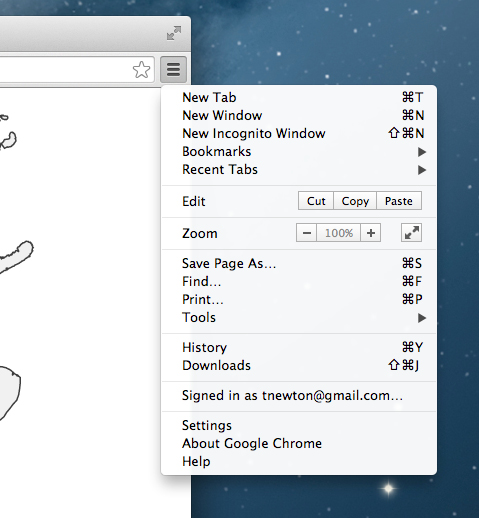
This icon opens a submenu. Click on More Tools, then click on Developer tools.
A panel will open at the bottom of the browser, containing all the developer tools at your disposal.
Within developer tools, you have a series of tabs (Elements, Network, Sources, and so on). These tools are extremely valuable and will allow you to inspect different aspects of your code. For more information on the Chrome developer tools, please go to this link: https://developer.chrome.com/devtools/docs/authoring-development-workflow.
Since we are going to focus on the Elements tab, click on it if it is not already selected.
You should see something similar to the preceding screenshot; it will have the following code statement:
<svg width="812" height="584">
If you click on the SVG item, you should see it expand and display the path tag. The path tag will have several numbers and characters tied to a d attribute. These numbers are control points that draw the path. We will cover how the path is drawn in the next chapter and how path tags are used to create maps in Chapter 4, Creating a Map and Chapter 5, Click-Click Boom! Applying Interactivity to Your Map.
We also want to draw your attention to how the HTML5 application loads the D3 library. Again, in the Elements tag, after the SVG tag, you should see the <script> tag pointing to D3.js and TopoJSON:
<script src="http://d3js.org/d3.v5.min.js" charset="utf-8"></script>
<script src="https://unpkg.com/topojson@3.0.2/dist/topojson.js"></script>
If you click on the path located inside the SVG tag, you will see a new panel called the CSS inspector or the styles inspector. It shows and controls all the styles that are applied to a selected element, in this case, the path element.
These three components create a D3 visualization:
- HTML5 (the SVG and path elements)
- JavaScript (the D3.js library and map code)
- CSS (the styling of the HTML5 elements)
Creating maps and visualizations using these three components will be discussed and analyzed throughout the book.
Summary
This chapter reveals a quick glimpse of the steps for basic setup in order to have a well-organized codebase to create maps with D3. You should become familiar with this setup because we will be using this convention throughout the book.
The remaining chapters will focus on creating detailed maps and achieving realistic visualizations through HTML, JavaScript, and CSS.
Let's go!