


In this chapter, you will learn:
Downloading, installing, and running JasperReports and iReport
Creating your first "Hello World" report
Creating and sizing the title for your report
Using dynamic titles, which can change during report processing
Inserting company logo in the title of your report
Adding a simple header to your report
Setting margins of your report and aligning the report header relative to report margins
This chapter is about the titles and headers of your reports.
Imagine you are looking for a particular recipe in a cookbook. Perhaps the quickest way of doing this is to go through the table of contents, which is just a list of the titles of all the recipes contained in this cookbook. So it is important that each title says what the recipe teaches.
Similarly, the title of your report will help identify the report among other reports. The title perhaps decides the objective of designing a report.
A title normally appears on just the first page of your report. The header appears on every page. While a title helps to identify the report among other reports, a header distinguishes the report among other copies of the same report. You can understand this with an example.
Consider you are designing a report showing the data for all invoices issued for a particular customer during a specific month. "Monthly Customer Invoices" can be an appropriate title for this report. Once you have designed the monthly customer invoices report, you will periodically generate copies of this report for a specific customer and for a specific month (that is, each copy of the report will be specific for these two parameters). Therefore, it is a good idea to include these two parameters in the header of your report.
This means that a report header represents the data on which a report is generated.
iReport is a powerful visual tool for JasperReports to graphically design reports. It is much easier to generate JASPER code using the graphical features of iReport as compared to writing the JASPER code by hand.
In order to create reports using JasperReports, you will only need to download iReport from the iReport project website hosted at SourceForge.net ( http://sourceforge.net/projects/ireport ).
As the JasperReports library comes bundled with iReport, you don't need to separately download and install JasperReports.
This recipe just shows you how to download, install, and run iReport.
1. Visit the iReport project website at http://sourceforge.net/projects/ireport. The iReport project homepage at SourceForge.net will open.
2. Click on the View all files button, and a list of all available versions of iReport will appear. I used version 3.6.0 of iReport, which is the latest at the time of writing these recipes. Therefore, expand iReport-3.6.0, by clicking on it. It will show all the files related to iReport-3.6.0. Download the file named
iReport-nb-3.6.0-windows-installer.exe. This is an executable file.3. Double-click the Windows executable file. A setup wizard will run, which will show you the installation steps and ask you for the folder where you want to install iReport. Just provide the destination folder and the installation will finish.
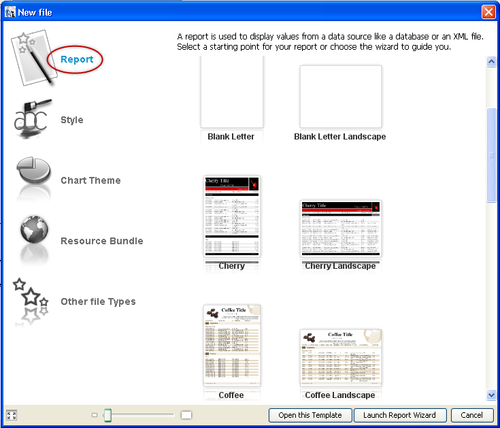
4. After the installation is finished, iReport will run and show a welcome window. Click on File and select New from the File menu. A New file dialog will appear containing several icons such as Report, Style, Chart Theme, and so on. Each icon represents a type of file you can create. The Report icon comes pre-selected, which means iReport allows you to create reports by default.
5. Now your iReport is up and running and you are ready to try the recipes of this cookbook.
The five steps given above show you how to download and install iReport for Microsoft Windows. iReport also supports other operating systems such as Linux, Mac OS X, and Solaris. The following is a short guideline to download and install iReport for these operating systems.
You can download iReport for Linux, Mac OS X, or Solaris by following the steps listed below:
1. Visit the sourceforget.net website at http://sourceforge.net/projects/ireport. The iReport project homepage at SourceForge.net will open.
2. Click the View all files button, to the right of the Download Now! button. A page will open containing the latest downloads for all operating systems in the Newest Files section of the download page. You will find that separate downloads of iReport are available for Linux and Solaris as
tar.gzfiles and for Mac OS X as DMG files. Download iReport for your operating system.3. For Linux and Solaris, you just need to unzip the
iReport-nb-XX.tar.gzfiles to your required folder. If you are using Linux, open the Linux Terminal and type the following command in the terminal:tar -zxf iReport-nb-xx.tar.gzNote
Visit http://www.linuxhelp.net/newbies/#unzip to learn more about unzipping
tar.gzfiles.uncompress iReport-nb-xx.tar.gz4. After you finish extracting the archive, run the
ireport.exefile from theiReport/binfolder.
If you need to download an older version of iReport, click on the View all files button to the right of the Download Now! button on the iReport project home page. A page containing a list of available versions will open. You will find the latest downloads for all operating systems in the Newest Files section and older versions in the All Files section of the download page.
Note that I have used iReport version 3.6.0 in this cookbook. iReport versions dated before 2008 are referred to as iReport classic, which might behave differently from the recipes of this cookbook.
This recipe is a quick starter for someone who is using iReport for the first time. It shows you what views of your report the tool offers and what type of report components are available. This recipe also teaches you how to quickly make a simple "Hello World" report.
The following ten steps will show you how to make your first "Hello World" report.
1. Run iReport. Click on File and select New from the File menu. A New file dialog will appear, which contains several icons such as Report, Style, Chart Theme, and so on. Each icon represents a type of file you can create. The Report icon comes pre-selected, which means iReport allows you to create reports by default.
2. Click on the Report icon on the top-left corner of the New file dialog. You will see a number of report templates available to start building your report.
3. Select the Blank A4 report template and click the Open this Template button at the bottom. Blank A4 is the simplest of all templates and, therefore, is a good starting point to learn iReport.
4. Next, you will be prompted to enter a filename for your report. Specify a name of your choice. I call my first report ASimpleBlankA4Report, as shown next. Click the Next button.

5. The Finish dialog will appear saying that you have successfully created your new report. Click on Finish to dismiss it.
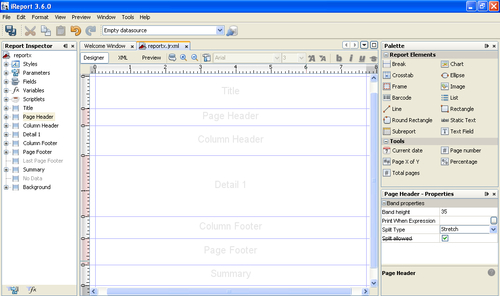
6. iReport will open your blank report in its default view, which shows three tabs: Designer, XML, and Preview. The Designer tab shows the various sections of your report such as Title, Page Header, Column Header, and so on, as shown in the following screenshot:
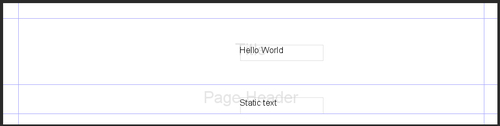
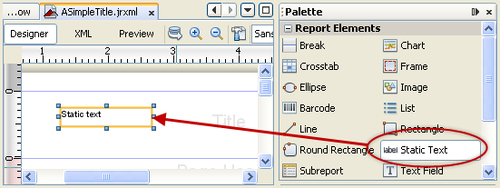
7. You will see a Palette of alphabetically arranged components (for example, a break, a chart, a static text, or a text field component) on the right of the main iReport window, as shown next. Drag a Static Text component from the Palette and drop it into the Title section of your report. Similarly drag-and-drop another Static Text component into the Page Header section of your report.

8. Double-click on the Static Text component of the Title section and type Hello World in it as shown:
9. Click on the XML tab, which shows the JasperReports XML (JRXML) code that iReport authors in response to your designer actions in the Designer tab. You will see that XML code for JasperReports changes every time you drag-and-drop a component from the palette into the designer view of your report.
10. Finally, switch to the Preview tab, which shows what your "Hello World" report will actually look like:

JasperReports has defined its own XML-based markup language called JasperReports XML, or JRXML for short. JRXML code contains all the information that is required to specify everything about your report. Therefore, designing a report using JasperReports means you have to perform the following steps:
1. Write JRXML code manually according to the requirements of your report.
2. Parse and compile the JRXML code to generate a JASPER file for your report.
3. Combine your JASPER files with application data to generate your report view. This process is called filling.
4. Export your report view to a popular format such as PDF or XLS.
You normally need to write Java code to compile, fill, and export your JasperReport.
iReport is a JRXML authoring, compiling, filling, and exporting tool. This means that if you can author JRXML manually and write Java code to perform these tasks (compiling, filling, and exporting), you don't need iReport.
However, it is really troublesome trying to write JRXML manually. The graphical tools and components in iReport make it very easy and quick to author the JRXML according to the design requirements of your reports. iReport performs the following tasks for you to help you generate your report:
1. As a visual authoring tool, it helps you to generate JRXML by just dragging-and-dropping of components. It actually translates your visual actions to JRXML code.
2. It compiles the JRXML to generate a JASPER report file.
3. It also combines JASPER files with application data to generate a print preview for your screen and printer.
4. Then it may export this report preview to a popular format such as PDF or XLS.
iReport provides three integrated views to make your work easier: the designer view (where you design your report graphically), the preview view (where you can see the effects of your design), and the XML view (where you can view and edit the actual XML of a JRXML file).
To see the XML view of iReport, switch to the XML tab and you will find the following JRXML code for the Blank A4 report:
<?xml version="1.0" encoding="UTF-8"?>
<jasperReport>
<background><band splitType="Stretch"/></background>
<title>
<band height="79" splitType="Stretch"/>
</title>
<pageHeader>
<band height="35" splitType="Stretch"/>
</pageHeader>
<columnHeader>
<band height="61" splitType="Stretch"/>
</columnHeader>
<detail>
<band height="125" splitType="Stretch"/>
</detail>
<columnFooter>
<band height="45" splitType="Stretch"/>
</columnFooter>
<pageFooter>
<band height="54" splitType="Stretch"/>
</pageFooter>
<summary>
<band height="42" splitType="Stretch"/>
</summary>
</jasperReport>
You can see from this code that there is a JRXML tag for every section of your report. For example, there is a<title> tag which wraps the title of your report. Similarly, you can see a<pageHeader> tag, which wraps the header.
Each JRXML tag for a section has a<band> child, which specifies two things about the section: the height of the section through a height attribute and the splitting behavior of the section.
In steps 8, 9, and 10 of this recipe, you played a little with the Designer, XML, and Preview tabs, respectively. You will need these tabs in almost every report you prepare using iReport.
The Designer tab is perhaps where you will work most of the time. It shows a window in which you will design your report by using different components such as static text, text field, and so on. These components are available in a palette of components on the right of your main iReport window.
In step 7 of this recipe, you played with the palette of components to quickly have an idea of how components are used in your report. The Palette window is split into two sections named Report Elements and Tools. The former contains several graphical components (for example, Static Text, Text Field, Frame, and so on), whereas the latter contains tools such as Current date and Page number. You will learn how to use these tools in Chapter 2,Working with the Body and Footer of your Report.
A self-explanatory title for your report helps identify the report among other reports. A popular style of designing self-explanatory titles is to have a main title and a subtitle. The main title is normally brief and the subtitle is a more elaborate form of the main title.
In this recipe, you will learn how to provide a main title and a subtitle for your business report. We are going to create, size, position, and color the title.
There is no database connection required in this recipe.
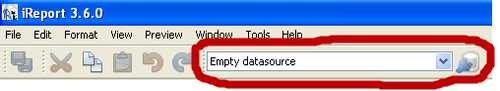
If you have not made any database connection so far in your iReport installation, you will see an Empty datasource selected in a drop-down list just below the main iReport menu. This is the requirement to run this recipe. If any other option (for example, some database connection) is previously selected, then change it to Empty datasource from the drop-down list, as follows:

the following steps are very simple, and demonstrate how you can design a basic title for your report:
1. Open the
ASimpleTitle.jrxmlfile from theTask3folder of the source code for this chapter. The Designer tab of iReport will show a blank report in the Designer tab of its main window. You can see various sections of your report. The first section at the top of the report is Title, which is a placeholder for the title of your report.2. Now you will insert a title into your report. A palette of components is available on the right of the main iReport window. Select the Static Text component from the palette and drag it into the Title section in the Designer tab.
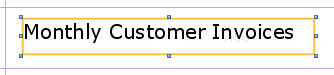
3. Double-click and edit the Static Text component to provide a title for your report (for example "Monthly Customer Invoices").

4. You will see that some of the title text will disappear from view. This is because your title is bigger than the standard rectangular boundary of the static text component, which contains the title. So, enlarge the rectangle boundary of this component by dragging one of its corners.
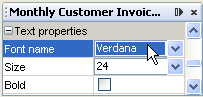
5. Now you will give your title a prominent look by increasing its font size. Select the title; the properties of the title field will appear in the Properties window just below the palette of components. Find the Size property among the Text properties and set it to 24.
6. Similarly, find the Font property and set it to Verdana, as shown next:
7. Your report title will get a bold prominent look, as shown here:
8. You can see from the previous image that the title is not well positioned within the Title section. In order to position the title, right-click on the main title, and a pop-up menu will appear; select Position, and another pop up will appear; select Center Horizontally. This will center your title horizontally in the Title section.
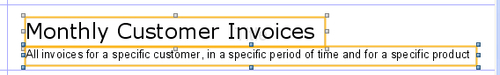
9. Next, you insert a subtitle for your report by dragging another static text component from the palette into the Title section of your report and repeating steps 2, 3, and 4. I have provided a self-explanatory subtitle "All invoices for a specific customer, in a specific period of time and for a specific product."
10. Now, repeat step 5 for the subtitle and choose 13 as the font size.
11. Switch to the Preview tab, which shows what your report looks like.

12. You have successfully designed the title of your report. Save it by selecting Save from the File menu.
Switch to the XML tab and you will see the following JRXML code:
<?xml version="1.0" encoding="UTF-8"?>
<jasperReport>
<!-- other JasperReports XML tags -->
<title>
<band height="79" splitType="Stretch">
<staticText>
<reportElement x="107" y="10" width="340" height="33"/>
<textElement>
<font fontName="Verdana" size="24"/>
</textElement>
<text><![CDATA[Monthly Customer Invoices]]></text>
</staticText>
<staticText>
<reportElement x="24" y="48" width="512" height="21"/>
<textElement>
<font size="13"/>
</textElement>
<text>
<![CDATA[All invoices for a specific customer, in a specific period of time and for a specific product]]>
</text>
</staticText>
</band>
</title>
<!-- other JasperReports XML tags -->
</jasperReport>
I have shown only the<title> tag in the code and omitted other JRXML tags that are not relevant to this discussion.
The<title> tag is a wrapper for both of the static text components you dropped into the Title section of your report. Each static text component is represented by a<staticText> child tag of the<title> tag. The first child of the<staticText> tag is named<reportElement>. A<reportElement> tag describes the position (using x and y attributes) and dimensions (using height and width attributes) of the static text component.
The x and y attributes control the position of a component. Both of these represent the positioning of the component with respect to the top-left corner of the Title section. You can play around by changing the value of the x and y attributes of the first<reportElement> tag to 0 in the JRXML code. The Designer tab will show that the main title of your report will move to the top-left corner of the Title section.
When you centered your main title horizontally in step 8 of this recipe, iReport calculated the values of these x and y attributes for you. This just shows the usefulness of iReport as a graphical report editor.
The height and width attributes control the size of a component. You can also play with these attributes to change the size of your title and subtitle.
The second child,<textElement>, of the<staticText> tag contains a<font> tag, which carries the text formatting information (for example, the name and size of font). You will notice that the<font> tag in the second<textElement> does not have the fontName attribute. That is because you did not change the font property of your subtitle. This means that the subtitle uses the default font, which is SansSerif.
You can see that the title (Monthly Customer Invoices) and subtitle (All invoices for a specific customer, in a specific period of time and for a specific product) of your report are wrapped inside two<text> tags, which go inside<staticText> tags. This means that whenever you drop a static text into the Title section of your report, iReport simply inserts a<staticText> child tag in the<title> tag of your report. Later, when you type the actual title, iReport simply wraps it in the<text> child tag of the<staticText> tag.
You can try editing the title directly from your JRXML. You will see that manual edits in the JRXML are reflected in the designer view of your report.
You can also play with the x, y, height, and width attributes from the Designer tab by changing the properties of your main title and subtitle. The x attribute appears as the Left property shown in the Properties window just below the palette of components. Similarly, the y attribute appears as the Top property. The height and width attributes appear as properties with the same name.
iReport also allows you to align two or more JasperReports components with respect to each other in your report. For example, you may like aligning the subtitle parallel to the main title. In order to do this, you simply follow the following steps:
1. Open the
ASimpleTitle_Final.jrxmlfile from theTask2folder of the source code for this cookbook. The Designer tab of the iReport shows that the report contains a title and a subtitle.2. Hold down the Ctrl key of your keyboard. First, click on the subtitle, which is a reference for you to set alignment of the target component (that is the main title).
3. Secondly, click on the main title and release the Ctrl key. You will see that now both components are viewed as selected.
4. Right-click on any of the components, and a pop-up menu will appear; select Align, and another pop up will appear; select Align Left. This will align the main title with the subtitle, as shown next:
A report title can be static or dynamic. A static title is fixed at design time, that is while designing the report. It remains unchanged and, therefore, every time you generate the report, it will have the same title.
An example of a fixed title would be "Monthly Customer Invoices" for a report that shows all invoices for a specific customer in a month.
In many cases, you may need every copy of your report to have some copy-specific words in its title. For example, if you are generating a copy of the "Monthly Customer Invoices" report, you may like to display the name of the customer in the title. This will make your title dynamic.
In this recipe, I will show you how to generate dynamic titles, which have some words that are not fixed while you are designing the report. JasperReports will decide these copy-specific words every time you generate a copy of your report.
In order to work with this recipe, you need to have a relational database installed on your computer. I prefer a simple and easy-to-use open source database, which makes a small footprint on your PC. That's because I am providing sample data with this recipe, so I would like to make it as easy and quick as possible for readers to import the sample data into their databases before executing the steps of this recipe.
I have used the PostgreSQL database, which fulfills these criteria. You can visit the web site (http://www.postgresql.org/) and get all the information to install and start using PostgreSQL. You may also refer to the installPostgreSQL.txt file included in the source code download for this chapter, which shows how you will install and run PostgreSQL. Make sure that PostgreSQL is up and running before you proceed.
The source code for this chapter also includes a copySampleDataIntoPGS.txt file, which will help you create a table named CustomerInvoices with five columns ( InvoiceID, CustomerName, InvoicePeriod, ProductName, and InvoiceValue) and copy sample data for all the recipes of this chapter into the table.
After inserting the required data, you will connect iReport to your database hosted on PostgreSQL using the steps described in the Creating a report from relational data recipe later in Chapter 4.
1. Open the
DynamicTitle.jrxmlfile from theTask4folder in the source code for this chapter. The Designer tab of iReport shows an empty report with a simple main title (Monthly Customer Invoices) as shown here: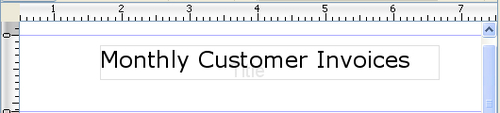
2. You are about to insert a dynamic subtitle into your report. Drag a new
Text Fieldfrom the palette of components available on the right of the main iReport window and drop it into the Title section of your report, just below the main title.3. Right-click on the Parameters node in the Report Inspector window on the left of the Designer tab. Choose
Add Parameterfrom the pop-up menu.4. The Parameters node will expand to show all the parameters including the newly added parameter named
parameter1, which appears at the end of the list of parameters. Selectparameter1from the expanded view. You will see the properties of this parameter in the Properties window on the right of the Designer tab just below the palette of components.5. Click on the
Nameproperty of the parameter and typeCustomerNameas its value. This setsCustomerNameas the name of this parameter. Similarly, click on the Default Value Expression property of the parameter and type""(two double quotes) as its value. Leave the rest of the properties at their default values.6. Link the text field you dragged-and-dropped in step 2 earlier with the
CustomerNameparameter. For this purpose, right-click on the text field and select the Edit expression option from the pop-up menu. An Expression editor window will open as shown below:
7. Delete the default expression
($F{field})from the Expression editor window.8. Click on Parameters in the first column of the lower half of the Expression editor window. This will list all the parameters in the adjacent second column. Scroll down the list of parameters in the second column to find the
CustomerNameparameter. Double-click on it. This will set$P{CustomerName}in the expression editor, as shown below: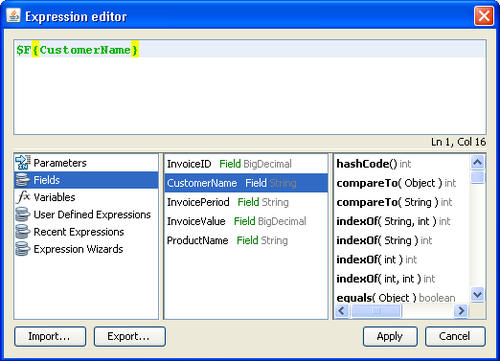
9. Click the Apply button. This will attach the
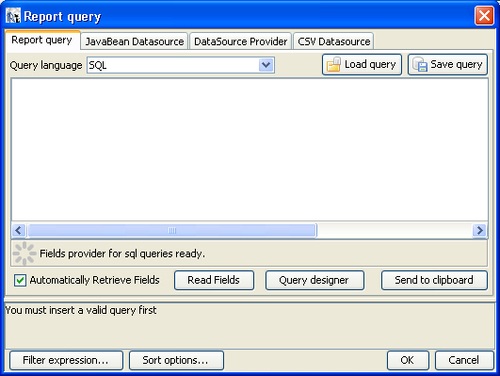
CustomerNameparameter with your text field of step 2.10. Now open the Report query window by clicking the Report query button to the right of the Preview tab. Unfortunately, it is a bit difficult to find this button in iReport 3.6.0, as it shows no tool tip when you move your mouse over it. Its icon is similar in shape to a standard database icon and looks like A Report query window will appear, as follows:
11. Enter the following SQL query into the Report query window:
SELECT * FROM "public"."CustomerInvoices" WHERE "public"."CustomerInvoices"."CustomerName" = $P{CustomerName}12. The Report query window will automatically fetch all the columns of the
CustomerInvoicestable (that is,InvoiceID, CustomerName, InvoicePeriod, ProductName, andInvoiceValue)and show them in the lower part of the Report query window, as shown next:
13. Click the OK button at the bottom of the Report query window.
14. Your text field of step 2 is now fully dynamic. Switch to the Preview tab to see your dynamic title. As soon as you switch to the Preview tab, the Parameter prompt dialog will appear. This dialog will ask you for the name of the customer, as shown n the following screenshot:

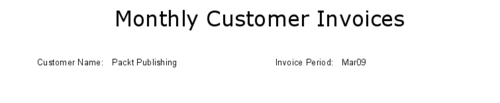
15. Type
Packt Publishingas the name of the customer and click OK. You will see a dynamic title, as shown next.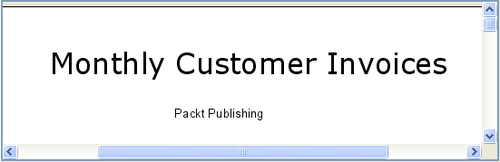
Open the XML tab of your report and you will see the following JRXML code:
<?xml version="1.0" encoding="UTF-8"?>
<jasperReport>
<parameter name="CustomerName" class="java.lang.String">
</parameter>
<queryString>
<![CDATA[SELECT * from "public"."CustomerInvoices"
WHERE "public"."CustomerInvoices"."CustomerName" =
$P{CustomerName}]]>
</queryString>
<!-- other JasperReports XML tags -->
<title>
<band height="79" splitType="Stretch">
<staticText>
<!-- other JasperReports XML tags -->
<text><![CDATA[Monthly Customer Invoices]]></text>
</staticText>
<textField>
<reportElement x="113" y="49" width="128" height="20"/>
<textElement/>
 <textFieldExpression class="java.lang.String">
<![CDATA[$P{CustomerName}]]>
</textFieldExpression>
</textField>
<!-- other static text and text field XML tags -->
</band>
</title>
<!-- other JasperReports XML tags -->
</jasperReport>
You can see that this JRXML contains<parameter>, <queryString>, and<title> tags in expanded view, whereas all other tags that are not relevant to the present discussion of the recipe are omitted.
iReport has generated the<parameter> tag (shown highlighted in the code) in response to steps 3 and 4 of the recipe. In these steps, you configured the CustomerName parameter. The<parameter> tag wraps the name of the parameter (CustomerName) and the type of data (that is, a Java string) through its name and class attributes, respectively.
Now look at the<queryString> tag (shown highlighted in the code), which wraps the SQL query you authored in step 11 of the recipe to fetch table data from your database.
Also notice from the SQL query that it contains a string $P{CustomerName} on the right of the = sign in the Where clause. This $P is not SQL syntax. This $P will be internally processed by the JasperReports engine, which resolves it to the CustomerName parameter before executing the query.
This way, the SQL query becomes part of your JRXML code and the JasperReports engine will process and execute this query to fetch the customer name from your database. JasperReports will also copy the name of the customer into the CustomerName parameter while processing your report.
Now look at the<staticText> tag whose<textFieldExpression> child is shown highlighted in the code. This<textFieldExpression> tag specifies the parameter (CustomerName) that contains the name of the customer fetched from the database. Therefore, when JasperReports processes this<staticText> tag, it will show the name of the customer in the title of your report.
Note
Use the overflow attribute. At runtime, if the title width exceeds the given width, it won't appear.
Also, it is better to externalize the static text into PROPERTIES files so that it will be easy to support multilingual support down the line. Also, it will be easy to fix spelling mistakes or modifications, without touching the report.
JasperReports allows you to place your company logo anywhere in your report. You may even use your logo as a background image or a watermark in a report.
This recipe shows you how you can place, position, and size your company logo within the title of a business report.
There is no database connection required in this recipe.
If you have not made any database connection so far in your iReport installation, you will see an Empty datasource selected in a drop-down list just below the main iReport menu. This is the requirement to run this recipe. If any other option (for example, some database connection) is previously selected, then change it to Empty datasource from the drop-down list, as shown in the following screenshot:
1. Open the
ASimpleTitleWithLogo.jrxmlfile from theTask5folder of the source code for this chapter. The Designer tab of iReport shows an empty report with a title (Packt Publishing) as shown in the following screenshot: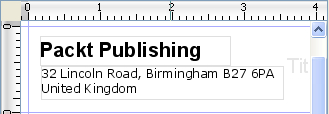
2. Use the palette of components available on the right of your iReport main window to drag an Image component into the Title section of your report. Now you can browse to your image file that contains your company logo. JasperReports supports the rendering of all popular image formats such as JPG, GIF, BMP, PNG, and so on.
3. Once you have selected the image file, click on Open. Your image will be placed in the Title section of your report, as follows:

4. The logo shown here does not fit and looks a bit too big. You need to adjust the size of the image. Click on the logo; its properties will appear in the Properties window just below the Palette of components. Look for the Width property and change its value to
180. Similarly, look for the height property and change it to80. Now it looks quite normal, but still its placement in the Title section looks inappropriate, as shown in the following screenshot:
5. Click on the logo and then use the mouse or arrow keys to place it in the top-right corner of the Title section, as shown in the following screenshot:
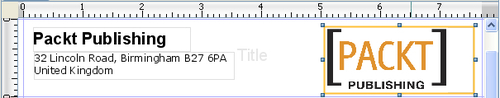
6. Switch to the Preview tab; you will see the preview of your report as shown here:

Switch to the XML tab and you will see the following JRXML code:
<jasperReport
<title>
<band height="94" splitType="Stretch">
<!-- other JasperReports XML tags -->
 <image>
<reportElement x="365" y="10" width="180" height="80"/>
<imageExpression class="java.lang.String">
<![CDATA["X:\\Images\\packt.png"]]>
</imageExpression>
</image>
</band>
</title>
<!-- other JasperReports XML tags -->
</jasperReport>
Notice the<image> tag, shown highlighted in the preceding code. This<image> tag represents the logo you inserted into the Title section.
The<image> tag has a child named<imageExpression>, which specifies the<image> that you want to insert. The<imageExpression> tag provides two important bits of information:
The
classattribute of the<imageExpression>tag specifies what type of image you want to use. In this case, you just want to provide the URL of the image. So it is a Java string. Another possibility can be that you want to pass a Java file object to JasperReports. In that case, the value of theclassattribute will bejava.io.File.The content of the
<imageExpression>tag specifies the actual URL.
A header normally appears on every page of your report. The header of your report contains the data that was used to generate the report. For example, if you generate a "Monthly Customer Invoices" report, the header will tell you the name of the customer and the month for which you generated a particular copy of the report.
The header consists of a number of name-value pairs, in which the name is actually the label of a field (for example, the label can be "Customer Name" when the header shows the name of a customer) and is normally simple text. On the other hand, the value in the name-value pair is actually some application data (for example, actual name of a customer) that comes from a data source such as a relational database.In this recipe, you will learn how to place a header just below the title of your report. As an example, I am going to generate the header of a report containing list of invoices issued to a particular customer in a specific month.
In order to work with this recipe, you will need the PostgreSQL database. Refer to the installPostgreSQL.txt file included in the source code download for this chapter, which shows how you can install and run PostgreSQL. Note that your installation of PostgreSQL should be up and running before you proceed.
The source code for this chapter also includes a file named copySampleDataIntoPGS.txt. The copySampleDataIntoPGS.txt file will help you to create a database named jasperdb1, a table named CustomerInvoices with five columns (InvoiceID,CustomerName, InvoicePeriod, ProductName, and InvoiceValue), and copy sample data for this recipe into the table.
After inserting the required data, you will connect iReport to your database hosted on PostgreSQL using the steps described in the Creating a report from relational data recipe later in Chapter 4.
1. Open the
ASimpleHeader.jrxmlfile from theTask6folder of the source code for this chapter. The Designer tab of iReport shows an empty report with just a title (Monthly Customer Invoices).2. You are about to enhance the report by adding a header. You can start by placing the label for your first name-value pair. Use the palette of components on the right of the main iReport window and drag a static text component into the Page Header section in the Designer tab of your report.
3. Double-click the static text and enter a label for your component (for example, "Customer Name"). Now use the mouse or keyboard arrow keys to place the static text appropriately, as shown in the following screenshot:

4. Now you will add a value field for your name-value pair. Drag a text field from the palette of components into the Page Header section and place it to the right of the Static Text labeled "Customer Name." A text field is just like static text except that it is attached to some data source at the backend through a database query or an XPath expression.
5. Open the Report query window by clicking the report query button to the right of the Preview tab. Unfortunately, it is a bit difficult to find this button in iReport 3.6.0, as it shows no tool tip when you move your mouse over it. Its icon is similar in shape to a standard database icon and looks like A Report query window will appear, as shown in the following screenshot:

6. Enter the following SQL query into the Report query window:
SELECT * from "public"."CustomerInvoices" WHERE "public"."CustomerInvoices"."CustomerName" = 'Packt Publishing' AND "public"."CustomerInvoices"."InvoicePeriod" = 'Mar09'
7. The Report query window will automatically fetch all columns of the
CustomerInvoicestable according to the condition given in the SQL query. You will see that all the columns of theCustomerInvoicestable (that isCustomerName, CustomerPhone, InvoicePeriod, ProductName, andTotalValue)will be displayed in the lower part of the Report query window, as shown next. Click the OK button and exit the Report query window.8. Now you have to link the
CustomerNamecolumn of theCustomerInvoicestable with the text field you placed into your Page Header section in step 5. Right-click the text field and select the Edit Expression option from the pop-up window, as shown here: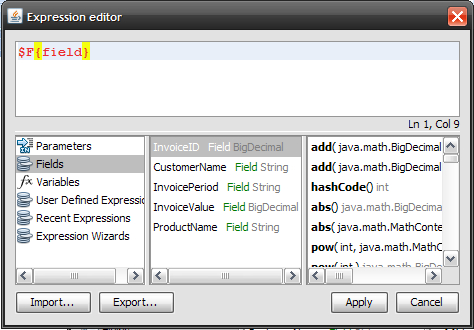
9. An Expression editor window will open. Delete the existing text
($F(field))from the Field Expression window and then double-click theCustomerNamefield in the second column of the lower half of the Field Expression window and click Apply. This will attach theCustomerNamecolumn of theCustomerInvoicestable with the text field.10. Now drag another static text and text field components as per steps 2, 3, and 4 for your second name-value pair (that is, Invoice Period = "invoicing month") as shown next. This time the static text will get
Invoice Periodas its label and the text field will link to theInvoicePeriodcolumn of theCustomerInvoicestable.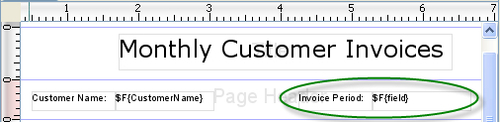
11. Repeat steps 8 and 9 to attach the
InvoicePeriodcolumn with theInvoice Periodtext field of your Page Header section. Eventually, your header will look like the following: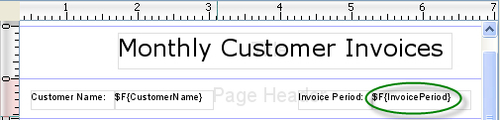
12. Switch to the Preview tab; you will see the preview of your report as shown here:
Open the XML tab of your report and you will see the following XML:
<?xml version="1.0" encoding="UTF-8"?>
<jasperReport>
<!-- other tags of JasperReports XML -->
<queryString>
<![CDATA[SELECT * from CustomerInvoices WHERE CustomerName = 'Packt Publishing' AND
ProductName = 'Offset Paper' AND
InvoicePeriod = 'Mar09']]>
</queryString>
 <pageHeader>
<band height="39" splitType="Stretch">
<staticText>
<reportElement x="120" y="11" width="115" height="22"/>
<textElement textAlignment="Left">
<font size="12"/>
</textElement>
<text><![CDATA[Customer Name]]></text>
</staticText>
<textField>
<reportElement x="128" y="12" width="100" height="20"/>
<textElement/>
<textFieldExpression class="java.lang.String">
  <![CDATA[$F{CustomerName}]]>
 </textFieldExpression>
</textField>
<!-- other static text and text field tags -->
</band>
</pageHeader>
<!-- other tags of JasperReports XML -->
</jasperReport>
Notice the<queryString> tag that I have shown highlighted in the preceding JRXML code. The<queryString> tag wraps the SQL query that you authored in step 6 of this recipe. This query brings all the five columns of the customer invoice table, each of which can be attached to a text field.
You can also see a<pageHeader> tag in this JRXML code. The<pageHeader> tag represents the header of your report, which you just authored in this recipe. The<band> child of the<pageHeader> tag contains two pairs of<staticText> and<textField> tags. I have shown only one pair for clarity. You can guess that each pair corresponds to a name-value pair you dragged-and-dropped in the Page Header section of your report. Notice that the<textField> tag has a child named<textFieldExpression>. The<textFieldExpression> has an expression ($F{CustomerName}) as its content. $F{CustomerName} refers to the name of a column in the CustomerInvoices table you linked with the text field in steps 8 and 9 of this recipe.
Changing this expression in the XML tab will affect the report in the Designer and Preview tabs as well. For example, if you delete the $F{CustomerName} expression in the XML tab, you will see that there is no content shown as the value of that text field in the Designer tab.
If you look at the SQL query that you entered into the Report query window, you will see that the name of the customer and the invoicing month have been hardcoded in the query. This data normally comes from the user who generates the report.
In order to allow the user to provide these values, you will need to declare a parameter and link it to your text fields (that is, the customer name and invoicing month) according to steps 3 to 9 of the Using dynamic titles that can change during report processing recipe of this chapter.
In this case, you also need to have a dynamic query, which will use the parameters that you have linked to your text fields. So the fixed SQL query of step 6 of this recipe will change to the following dynamic query:
SELECT * from "public"."CustomerInvoices" WHERE "public"."CustomerInvoices"."CustomerName" = $P{CustomerName} AND "public"."CustomerInvoices"."InvoicePeriod" = $P{InvoiceMonth}
Now when you switch to the Preview tab, iReport will not show you the preview immediately. It will first ask you to provide a customer name and invoicing month. Enter Packt Publishing as the customer name and Mar09, as invoicing month; iReport will now display the preview.
Also note that, once entered, iReport remembers parameter values, so it will not ask you to re-enter parameter values each time you generate the preview. It will ask you for new parameter values only when you close and reopen your report in iReport or make any change in the design view.
You will often need to set margins for your report as well as its individual sections such as the report title, header, body, and footer.
This recipe shows you how you can set the margins for your report and also how to align the different components of your header with respect to each other as well as the report margin.
In order to work with this recipe, you will need the PostgreSQL database. Refer to the installPostgreSQL.txt file included in the source code download for this chapter, which shows how you can install and run PostgreSQL. Note that your installation of PostgreSQL should be up and running before you proceed.
The source code for this chapter also includes a file named copySampleDataIntoPGS.txt. The copySampleDataIntoPGS.txt file will help you create a database named jasperdb1, a table named CustomerInvoices with five columns (InvoiceID, CustomerName, InvoicePeriod, ProductName, and InvoiceValue) and copy sample data for this recipe into the table.
After inserting the required data, you will connect iReport to your database hosted on PostgreSQL using the steps described in the Creating a report from relational data recipe later in Chapter 4.
1. Open the
HeaderMarginAndAlignmentSample.jrxmlfile from theTask7folder of the source code for this chapter. This will display a report with a title and a multi-line header containing three name-value pairs of components, as shown next. Each name-value pair contains a static text and a text field component. For example, the first name-value pair shown contains a static text component (that is,Customer Name:)and a text field component (that is,$F{CustomerName}).
2. Click on the Format menu and then choose the Page format item from the drop-down menu, as shown here:
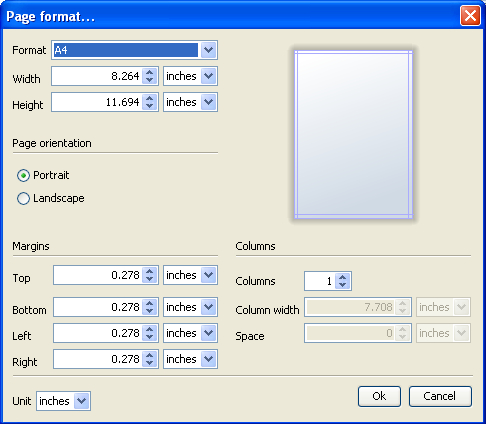
3. From the Page format window you may choose the format, report dimensions, margins, and page orientation of your report. This recipe focuses on margins. Other features will be covered in later recipes. Choose 0.5 inches as the left margin (a bit more then the default value) because most reports need some binding on the left side. Leave all other margins (that is right, top, and bottom) at their default values.
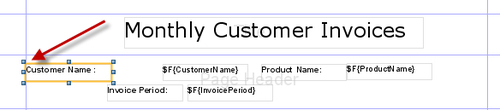
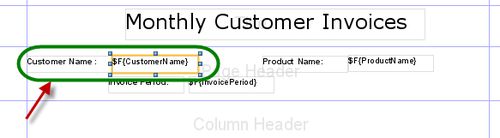
4. You will notice that the name-value pairs of the multi-line header are not properly aligned. You can align first two pairs in two columns and center-align the third. Right-click on the Static Text component (Customer Name:) of the first name-value pair. A pop-up window will appear. Select Align from the pop-up menu, then select the Align to Left Margin option from the pop-up menu. You will see that the static text component is shifted to the extreme left side of the report margin, as shown next:
5. Click on the text field component ($F{CustomerName}) of the Customer Name: pair. Use the mouse or arrow keys to drag it to the left till it sits adjacent to the Customer Name static text component.
6. Right-click on the text field component of the second name-value pair. A pop-up menu will appear; select Align from the pop-up menu, and then choose the Align to Right Margin option from the menu. This will shift the text field component to the extreme right of the report margin, as follows:
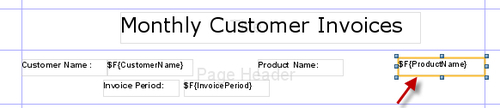
7. Now click on the static text component of the second name-value pair (Invoice Period:). Use the mouse or arrow keys to drag it to right till it sits adjacent to the accompanying text field component you right-aligned in step 6, as shown below.
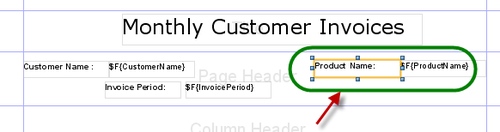
8. Now look at the third name-value pair, which is on the second line of the header. You want to centre-align this name-value pair. Unfortunately, there is no way to accurately center-align this name-value pair using iReport. You will have to do it manually. For this purpose, hold down the Ctrl key and select the static text component (that is Product Name:). While holding the Ctrl key down, select the Text Field component of this name-value pair. This will select both components simultaneously, as shown next:

9. Right-click on the selected name-value pair; a pop-up menu will appear. Select the Position option from the pop-up menu. A submenu will pop up; choose the Center Horizontally option from the submenu. This will center-align the selection, making the two components overlap each other, as shown in the following screenshot:

10. Left-click on the name-value pair, which is now overlapped and center-aligned. This will select the text field component of the name-value pair. Press the right key 48 times to move the component to the right. Now left-click on the static text component and press the left-arrow key 48 times to move the static text component to the left. Now this name-value pair is approximately center-aligned, as shown here:
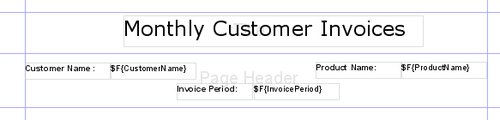
11. Save your report by selecting Save from the File menu and switch to the Preview tab. You will get a preview as shown here:

Switch to XML tab to see the following JRXML code:
<?xml version="1.0" encoding="UTF-8"?>
<jasperReport leftMargin="36" rightMargin="20" topMargin="20" bottomMargin="20">
<!-- other tags of JasperReports XML -->
<pageHeader>
<band height="63" splitType="Stretch">
<staticText>
<reportElement x="0" y="11" width="100" height="20"/>
<textElement>
<font isBold="true"/>
</textElement>
<text><![CDATA[Customer Name :]]></text>
</staticText>
<textField>
<reportElement x="100" y="11" width="100" height="20"/>
<textElement/>
<textFieldExpression class="java.lang.String">
<![CDATA[$F{field}]]>
</textFieldExpression>
</textField>
<!-- other tags of JasperReports XML -->
</band>
</pageHeader>
<!-- other tags of JasperReports XML -->
</jasperReport>
In this JRXML, you can see from the<jasperReport> tag that its attribute named leftMargin is highlighted. Notice that you set the leftMargin attribute to 0.5 inches in step 3 of this recipe. iReport automatically translates the value 0.5 inches into a corresponding value of the leftMargin attribute.
The<band> tag of<pageHeader> contains three pairs of<staticText> and<textField> tags. I have shown only one name-value pair for the sake of clarity. The<staticText> and<textField> tags contain a<reportElement> child. Look at the x and y attributes of the<reportElement> tag that I have shown highlighted. The y attributes of both<reportElement> tags have the same values. The x attributes are different and their difference is equal to the width of the first component (the width attribute of the first<reportElement> tag).