We will now perform an installation of Citrix EdgeSight Server 5.4 and also discuss its prerequisites. If possible, you should install the server components on separate servers but they can all be installed together on a single server.
Install the following roles and features using the server manager before proceeding with the installation of the EdgeSight Server in Windows Server 2008:
Microsoft .NET Framework 3.5 SP1
Microsoft Message Queuing (MSMQ); install common components only
IIS 7.0 (also install the following web server roles)
Static Content
Default Document
ASP.NET
ISAPI Extensions
ISAPI Filters
Windows Authentication
Request Filtering
The following management tools:
IIS 6 Management Compatibility
IIS 6 Metabase Compatibility
IIS 6 WMI Compatibility
IIS 6 Scripting
IIS 6 Management Console
For your database server you can use SQL Server 2008 R2, SQL Server 2008 SP2, or SQL Server 2005 SP4. SQL Server 2012 is the supported database server. Citrix has a database matrix; you can check the article Citrix Document ID CTX114501 at the following link:
In this recipe we are going to perform the required operations for installing the EdgeSight Server:
Insert the Citrix XenApp CD and click on Manually install components.

Click on Server Components and then click on Application Performance Monitoring.
On the Welcome screen, click on EdgeSight Server and then click on Next.
Select Edgesight Server Website and Database; click on Next.
Click on Warning to read the warning message, ignore the SSL certificates warning if not using SSL certificates, and click on OK.

Accept the License Agreement checkbox and select Custom as the setup type.
Enter the name of your database server and click on Test Connect after selecting the appropriate authentication method.

Enter the name of the new database that will be created on the database server.

Enter the credentials that the web server uses when connecting to the database and then click on Validate. After successful validation click on Next.

Accept the default sizes for the File Group Size and Log Files Size options and click on Next.
Accept the default path or modify it if required, click on Next, and then on Install.
Verify that Go to the EdgeSight Server website now. is checked and click on Finish.

Click on Next to continue with the Post Installation Setup Wizard web page to configure initial configuration of the EdgeSight Server.
Enter a name in the company Name field and select the Time Zone and Language values you want to use for this company. Then click on Next.

Create a Superuser account with a valid e-mail address.

Enter the FQDN or IP address of your SMTP server to be used to route the e-mails generated by the EdgeSight Server.

Select the type of agents from the drop-down menu for which uploads are supported according to your licenses.

Review your choices and click on Finish; this will open the EdgeSight Server login web page.
The EdgeSight Server is managed through a web-based console and can be accessed from any desktop with Internet Explorer 7.0 or greater with JavaScript enabled. Other software components that are needed on the system from which users access the EdgeSight Server web console include:
Adobe Flash
Adobe Reader
Microsoft Excel
Tip
To update the Excel spreadsheets, EdgeSight requires full write permissions; therefore you should use the Microsoft Excel that comes with Microsoft Office 2003 or 2007 and not Excel Viewer. Also make sure that you confirm to your Microsoft Office license agreements.
As of this date, Microsoft Excel 2010 is not supported.
It is nice to know some EdgeSight terminology; refer to the following table:
|
Term |
Description |
|---|---|
|
Company |
Primary organizational unit, a single server can support multiple companies. |
|
Department |
Companies are broken into departments and create a hierarchical tree. |
|
Devices |
Any system with the EdgeSight agent installed. |
|
Custom Groups |
A user-defined collection of devices. |
|
Users |
Users who can log in and display reports and perform other administrative tasks. |
|
Superuser |
Has access to all companies hosted on the server and can create other users. |
A single EdgeSight Server can support multiple companies, each company with its own time zone, SMTP settings, license server, and Superuser account.
The Superuser credential information should be stored and saved for future reference. The Superuser account cannot be deleted.
EdgeSight 5.4 also requires a Citrix License Server 11.6 or above. Without configuring the Citrix License Server, the EdgeSight agents will not upload data to the EdgeSight Server. To monitor your Citrix licensing server, the version of the licensing server should be at least 11.9.
If you plan to install License Administration Console and EdgeSight Server on the same machine then install EdgeSight Server first.
Only Enterprise and Platinum licenses are supported to be used by EdgeSight 5.4.
The EdgeSight agent needs to be installed on each XenApp server that we need to monitor. After the agent has been installed, the agent attempts to contact the EdgeSight Server to download its configuration. The installation of the agent requires a reboot of the server and may take up to 10 minutes before the XenApp server appears in the EdgeSight Console.
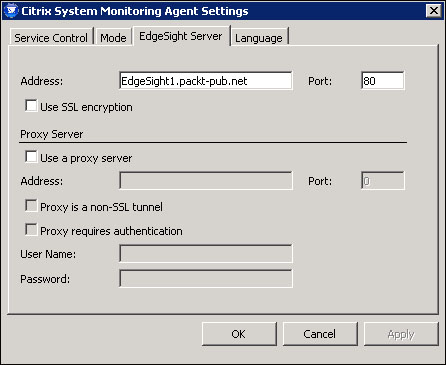
If you have to use a proxy server, remember that, for the communication to happen between the EdgeSight agent and the server, you must configure a proxy to route the EdgeSight traffic to the EdgeSight Server. You can do this by reconfiguring the EdgeSight agent network settings of the Citrix System Monitoring Agent with these new proxy values.
The following screenshot shows the EdgeSight agent settings screen where you need to provide the proxy settings:
You must also configure antivirus software running on your EdgeSight Server and all XenApp servers with EdgeSight agent to exclude specific processes and files.
Ensure that these agent services are not subject to script blocking on both the EdgeSight Server and the XenApp server.
|
EdgeSight Server |
XenApp Server |
|---|---|
|
|
|
|
|
These files are located in the following folders:
The
RSshApp.exeandRSshSvc.exefiles are located at%CommonProgramFiles%\Citrix\System Monitoring\Server\RSSH\The
RScorsvc.exefile is located at%ProgramFiles%\Citrix\System Monitoring\Agent\Core\
Also exclude the following folders from script blocking:
|
EdgeSight Server |
XenApp Server |
|---|---|
|
|
|
|
| |
|
|
For XenApp servers with Windows Server 2003 the %ALLUSERSPROFILE%\Citrix\System Monitoring\Data folder can be found at %ALLUSERSPROFILE%\Application Data\Citrix\System Monitoring\Data\
The EdgeSight agent can be installed during the XenApp installation or after the XenApp installation. If you want to install the EdgeSight agent with the installation of the XenApp server, during the installation of the XenApp server, when selecting the roles to be installed, make sure you select the EdgeSight Agent option:

The EdgeSight agent can also be installed after the installation of XenApp or on an existing XenApp server. The XenApp 6.5 CD image contains two agent installer files, as shown in the following screenshot:

The
EdgeSightXA6Agentx64.msiinstaller file is used to install EdgeSight agent Version 5.4, whileEdgeSightXAAgentx64.msiis used to install EdgeSight agent Version 5.3.The installation of the agent is straightforward; the only thing one should keep in mind is that the company name should match the name specified during the EdgeSight Server setup.
The agent can also be installed via the command-line interface. A typical command line to install the agent would be:
Msiexec /i EdgeSightXA6Agentx64.msi /l logfile.log /q SERVER_NAME=ServerName COMPANY=CompanyName DEPARTMENT=DeptName REBOOT=ReallySuppress
The agent runs as a service and collects the data from a number of sources including Windows Management Instrumentation (WMI) and Windows Performance Counters.
The XenApp agent collects performance data every 15 seconds and periodically consolidates this data into five-minute samples. The data uploaded to the EdgeSight Server is consolidated into an hourly granularity. By default, this data is uploaded to the EdgeSight Server once a day.
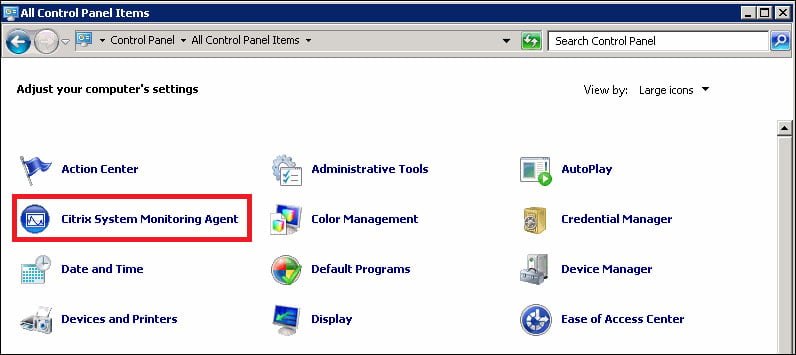
If you ever need to modify the agent configuration after installation, you can use the Citrix System Monitoring Agent control panel applet on the XenApp server.
The EdgeSight agent operates in either the basic mode or the advanced mode. The agents in advanced mode collect more detailed metrics. For more details on the differences, refer to the Citrix Document ID CTX124427 documentation at http://support.citrix.com/article/CTX124427.
|
XenApp Edition |
Default Agent Mode |
Mode Tab Availability |
|---|---|---|
|
Platinum |
Advanced |
No |
|
Enterprise |
Basic |
Yes |
To configure the agent mode when installing the agent using the command line, add the FUNCTIONALITY_MODE argument. It can have two values Advanced and Basic.
Now that the installation and the post-installation wizards have completed successfully, we still need to complete a few tasks such as configuring the Reporting Services, creating departments, and groups.
Reporting Services is a component of Microsoft SQL Server and is required as part of a Citrix EdgeSight installation to provide a robust and flexible reporting environment. Reporting Services provides a central location for report storage and management. They can be installed on the database server, web server, or a separate server itself. If you do not have Reporting Services configured, the EdgeSight installation process will not give any warning; the installation will end successfully but no reports will be available on the EdgeSight Console.
You can open a web browser and point the URL to http://<ServerName>/ReportServer to verify the existence of Reporting Services on a server. This URL could be different if the Reporting Services were customized. This is depicted in the following screenshot:
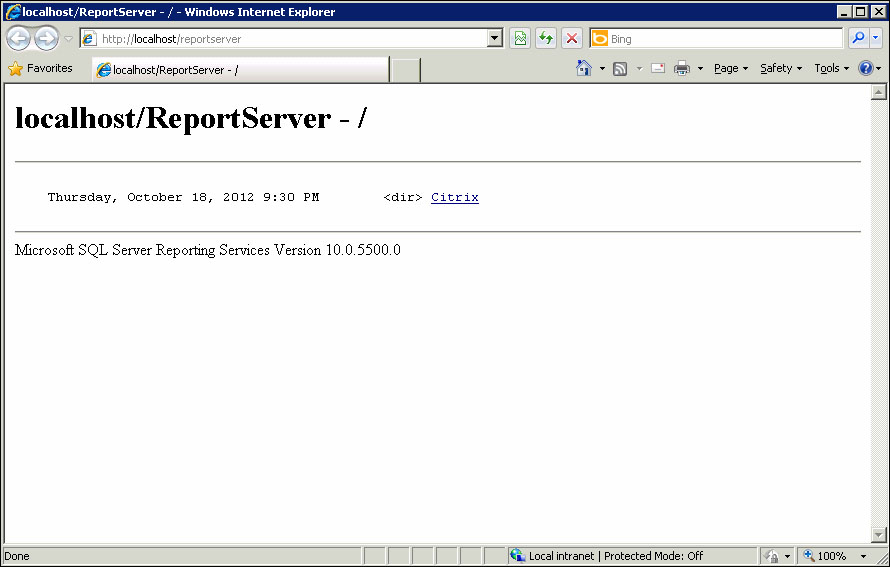
This web page also displays the version of the Reporting Services we have installed.
For more information on how to install and configure Reporting Services to be used by EdgeSight, refer to the Citrix Article ID CTX111313 documentation at the following link:
As soon as you log in for the first time on the EdgeSight web console, you will see a message on the top such as Reporting Services is not configured or is configured incorrectly. In the Report Server URL field, enter the URL of your reporting server and the credentials for the Reporting Server. Click on the Save Changes button.

The Reporting Services Configuration Status – Webpage Dialog window pops up. Wait a few minutes for the pop-up window to configure the Reporting Services. Once the Reporting Services have been configured, click on the Close button.
Tip
A department is a logical grouping of agent devices within a company that have the same configurations and alerts applied. We can map one or multiple alert rules, alert actions, worker configurations, and agent configurations to devices in the department.

If the Reporting Services Configuration Status – Webpage Dialog window does not appear and times out after 20 minutes, there is a delay in communication from the EdgeSight web server with SQL Server Reporting Services. If this happens then ensure that the SQL Server Agent service is in started state. This is required for publishing the schedules.
Verify that the default departments were created successfully by navigating to Configure | Company Configuration | Device Management | Departments.

The All root department and the XenApp Farms subdepartments are created by default during the EdgeSight installation and are usually referred as the default departments. The default departments cannot be renamed, moved, or deleted but we can modify their worker and agent properties.
The subdepartments override configuration settings inherited from parent departments. If you have two alerts mapped to the All department and three are mapped to a subdepartment, then that means that a total of five alert rules will be applied to this subdepartment.
After installing the EdgeSight agent and rebooting the XenApp server you will receive an e-mail from the EdgeSight Server that a new instance has been discovered. Verify that you start getting those e-mails. The following screenshot displays the e-mail received from the EdgeSight Server after a new device gets registered with it:

Navigate to Configure | Company Configuration | Device Management | Devices to verify that the XenApp servers on which the agent has been installed start to appear in the EdgeSight console.

Verify the EdgeSight Server's license status by navigating to Configure | Server Configuration | EdgeSight Licensing.
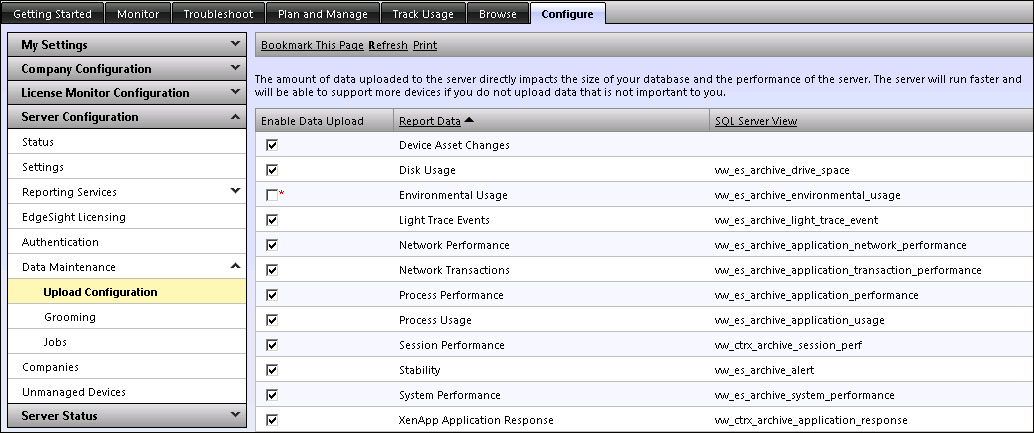
Verify that you only upload the data from the agents to the EdgeSight database that is important to you. Navigate to Configure | Server Configuration | Data Maintenance | Upload Configuration to make your selection according to your requirements.
Note
An important message is displayed at the top of the page, informing the administrator that the amount of data uploaded to the server directly impacts the size of your database and the performance of the server. The server will run faster and will be able to support more devices if you do not upload data that is not important to you.
A single server can support multiple companies. Companies are broken down into departments.
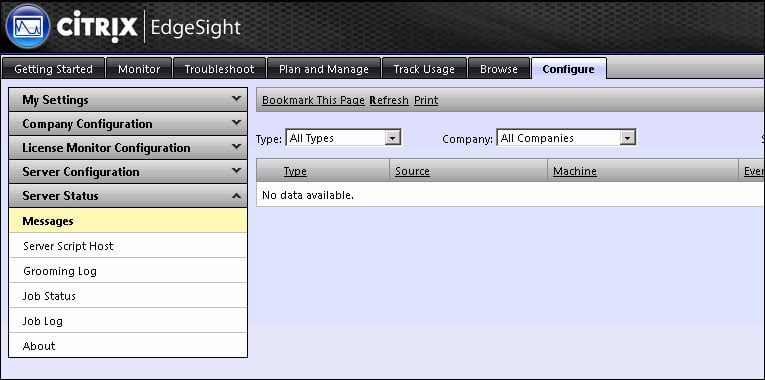
To display the most recent messages related to server maintenance jobs, events, or the registration of new agents, browse to Server Status | Messages.
You must provide a valid SMTP server name or IP address as the EdgeSight Server uses e-mail for alerts and error event notifications.
In case you ever need to go back and modify the e-mail notification settings for a company in EdgeSight, navigate to Configure | Server Configuration | Settings | Notifications.
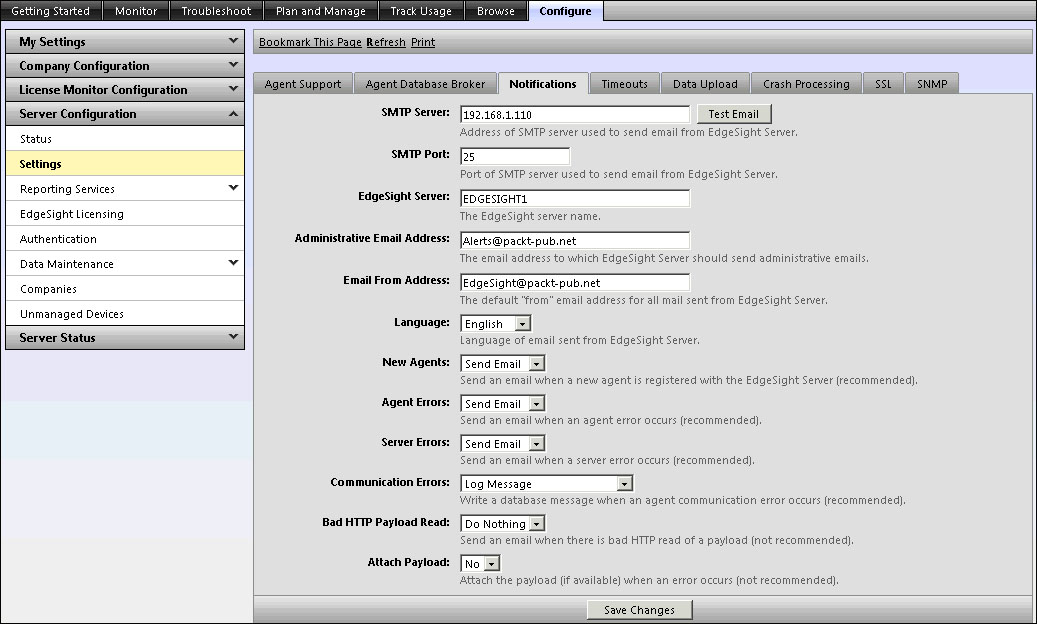
Before saving your changes you must also test the communication with your messaging server by clicking on the Test Email button.
After you've completed the EdgeSight Server installation and configured the server setting, it is time to create users, assign groups, and configure an authentication provider. In this recipe we will use Active Directory as the authentication provider.
Before creating a new Active Directory as the authentication provider we need to get the LDAP path. The LDAP path is formulated as LDAP://DomainName.com.
To configure an authentication provider, browse to Configure | Server Configuration | Authentication and click on the New Provider button.

Select Active Directory from the list of authentication provider and click on Next.
Enter a name and description to identify the provider. If you want to configure this as the default authentication provider then also select Make this the default authentication provider. Also enter the LDAP path with the appropriate user credentials and then click on the Test button. After the message The test completed successfully, click on the Finish button.

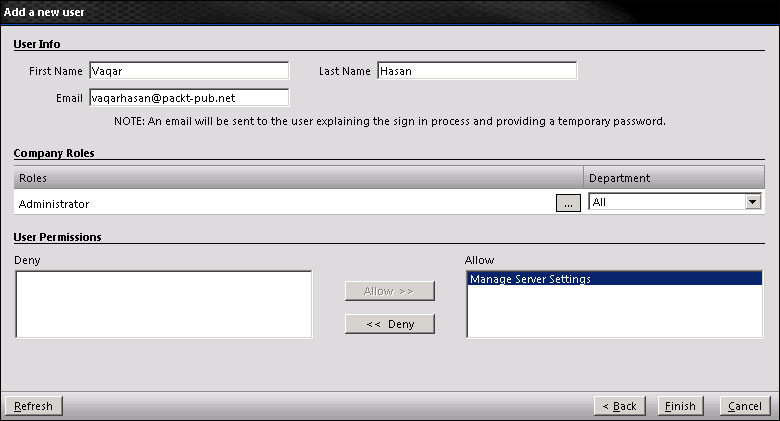
Now we will create a new user in EdgeSight using the Active Directory User Picker and select a user from our Active Directory domain. To do this navigate to Configure | Company Configuration | Security | Users and then click on the New User button.

Select Active Directory as the authentication provider and click on Next.
Click on the Browse button to select User or Group from the Active Directory User Picker window.
Select the appropriate type as Users, Groups, or Users and Groups from the Type drop-down menu and click on the Go button to populate the list from Active Directory. Select the User or Group value you want to assign the permissions to and click on OK. Here we have selected the Domain Admins group.

-
Click on the Save
 button to select the role from the Role Picker pop-up window.

Select the role you want to make this new user a member of and click on OK. You will be then returned to the Add a new user web page.

Select user permissions to be granted to the user from the Deny list box and click on Allow to grant the permission.
Click on Finish and verify that the new user you created now appears in the list.

Let us now see how to manage groups.
The User Groups page enables you to create collections of users by directly selecting users by username, IP address, IP range, or by running a query against the EdgeSight database. The examples of groups include common operating systems and common hardware:
To create a group, browse to Configure | Company Configuration | Device Management | Groups and then click on the New Group button.

The groups in the previous screenshot were created automatically during the installation of the EdgeSight Server.
Enter a name for the group and click on the Create a Group button.

The expiration period is the time after which this newly created group will automatically be deleted. This feature facilitates the management of groups created for short-term projects with a set duration, such as the evaluation of software. Groups can also be set to never expire.
The refresh period refreshes the device cache. This refresh rate generally provides you with sufficient currency of data without performing unnecessary cache refreshes.
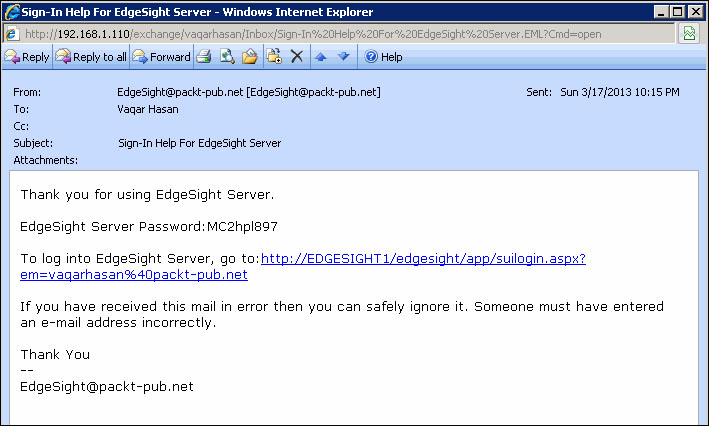
If you do not create the Active Directory authentication provider, you can still use the default authentication provider (Email) that is installed with the installation of the EdgeSight Server. The default authentication provider uses an e-mail address as the username:
When you create a new user, you will have to provide the e-mail address for that user. Then an e-mail is send to the user explaining the first-time login process and also providing a temporary password. When the user first logs in, they are requested to change their password.
Citrix EdgeSight alert is a powerful rules- and actions-based system that instructs the EdgeSight agents to send an alert in real time when a predefined situation has occurred on a monitored object. Alerts are defined by rules.
The action can be configured to send either an e-mail alert or SNMP trap. The generated alerts are also listed and organized within the EdgeSight web console.
After an alert rule has been created, it should be mapped to a department.
To create an alert, navigate to Configure | Company Configuration | Alerts | Rules | New Alert Rule.

We will create an alert rule based on an application, so select the Application Alerts radio button and click on Next.
Select Application Performance as the alert type and click on Next.
Give the alert rule a name, the name of the process we want to monitor, and the CPU time in percent. Click on Next.

Select departments to assign this alert rule to and click on Next.
Select the department you wish to edit alert actions in and click on Next.

We now need to assign an action to this alert rule; we will create a new action. So select the Create New Alert Action radio button and click on Next.
We will send an e-mail notification as the alert action so select Send an email notification radio button and click on Next.
Enter a name, subject, and one or more recipient e-mail addresses for this e-mail action. You can click the Test Action button to test whether EdgeSight was able to successfully queue the message or not. Click on Finish.

Creating too many real-time alerts can affect the XenApp server performance as each rule that is created requires more work to be performed by the agent.
We should only create alerts for those critical situations that require immediate action. If the situation is not critical, the delivery of alerts based on the normal upload cycle will probably be sufficient.
By default, the alert data and other statistics are uploaded to the server daily.
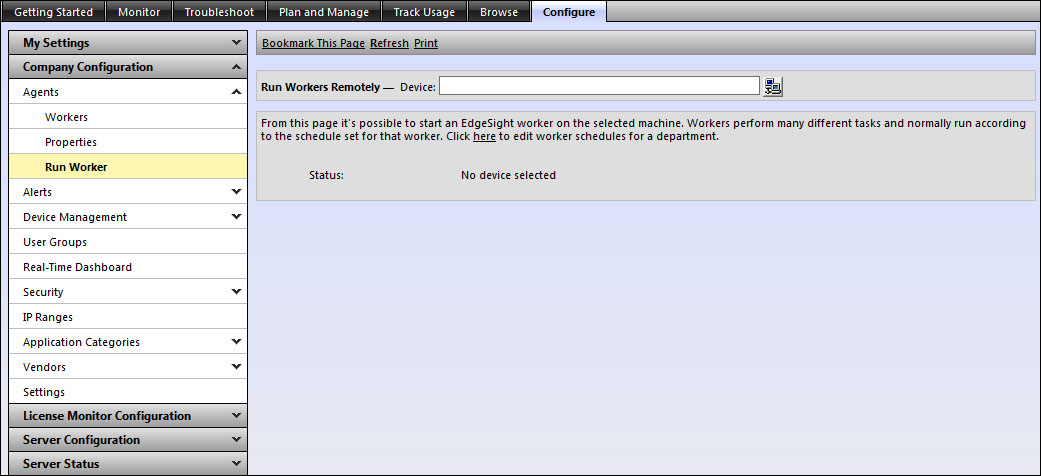
When a new alert rule is created or any existing rule is modified, this change is applied to all the devices in the department when those devices next upload data to the EdgeSight Server; alternatively, you can manually upload the alert rule data by clicking on Run Remotely.
Administrators can also force certain agent devices to perform a configuration check within the EdgeSight web console by navigating to Configure | Company Configuration | Agents and then selecting the device from the device picker.
We can also temporarily prevent certain types of alert that match a criterion from being displayed on the console using Alert Suppression.
To suppress an alert, navigate to Monitor | Alert List, click on the down arrow  , and then select Suppress Alert.
To clear an alert navigate to Configure | Company Configuration | Alerts | Suppressions.
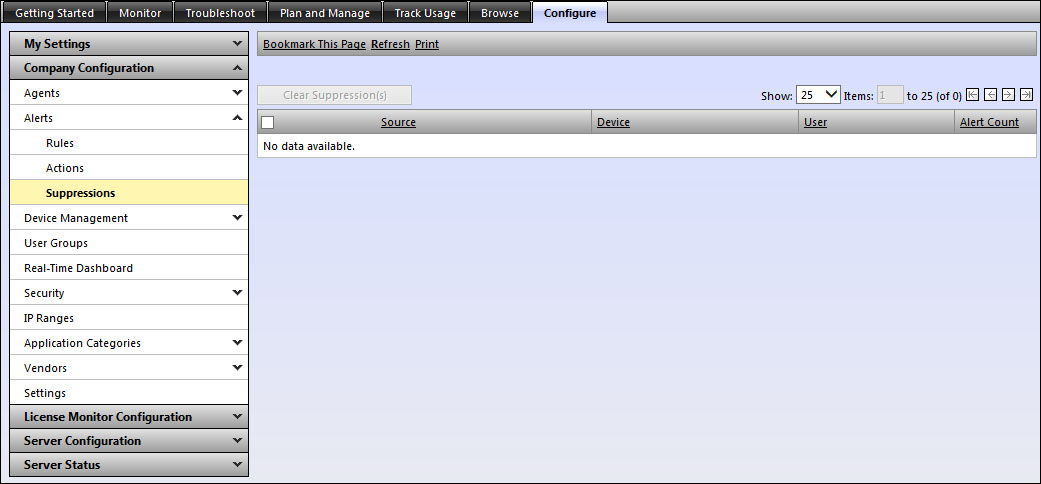
This is per user basis and other EdgeSight administrators will still see those alerts suppressed by you.
The EdgeSight dashboard provides a comprehensive view of the XenApp server's health state in real time. The dashboard queries the agent databases for counter values based on the configuration created by the EdgeSight administrator.
To populate the dashboard, we first need to create a new real-time configuration. Each configuration defines what counters will be displayed in the dashboard. We can create multiple configurations and each configuration will have its own devices. A device can be a member of multiple configurations.
Log on to the EdgeSight website, navigate to Configure | Company Configuration | Real-Time Dashboard, and then click on the New Real Time Configuration button.

Enter a name for the configuration, verify that Take me to the Add Devices and Counter wizard is checked, and then click on the Create the Configuration button.

This takes us to the Edit Devices screen. To populate the list, click on Go button and then double-click on the device name to add it to the Configuration Members list. Click on Next.

Checkmark the counter that you want to monitor and enter the threshold value for that counter. Click on Next and then click on Finish.

Click on the name of the configuration you just created. In this case it is Office2010Servers.
Click on Start Updating. To stop querying the devices, click on Stop Updating.


EdgeSight reports are based on the data stored in the agent database as well as the server database. The reports can be historical as well as real-time. In case of real-time reports, the data is pulled directly from the agent database.
In this recipe we will subscribe to a report and configure it to be delivered via an e-mail.
EdgeSight comes with a wide range of built-in reports. We can download these reports and/or export them to a variety of different formats. We can also add our own custom reports to the report server. One great feature that EdgeSight also offers is the automatic delivery of the report of our choice to run at a custom schedule; the report is sent to a specific folder or e-mail addresses.
First we need to verify that the e-mail settings for the Reporting Services are configured properly. Log on to the server hosting your reporting services, open the Reporting Services Configuration Manager, and then select Email Settings. By default the Sender Address and SMTP Server fields are not populated automatically. After entering the appropriate information click on Apply.
Tip
The Sender Address field should be a valid e-mail address and appears as the address of origin in the e-mail.

Open the EdgeSight website, navigate to Configure | Server Configuration | Reporting Services | Schedules, and then click on the New Schedule button.

Specify a name for the schedule and specify other details as per your requirement. Click on the Add Schedule button.

Click on the Browse tab and the Subscriptions link of the report you want to subscribe to.

Click on the New Subscription button to create a new subscription.
The default delivery is through e-mail; in case you want to save the report to a specified folder, you can click on the Delivered by drop-down menu and select File Share. To select the schedule, click on the Schedule drop-down menu and select the schedule you want the report to be processed at; click on the Create Subscription button.

The built-in reports provided by EdgeSight can be modified to meet the business requirements more closely. To modify a report, click on the Download link and save the file with the default extension of .RDL (Report Definition Language). Then use your favorite XML Editor to open the .RDL file and change the SQL query within the <CommandText> tag. You might also need to modify the field names <Field Name> and the data fields <DataField> tags. Once done save the file, navigate to Configure | My Settings | Custom Reports, and then click on the Upload button.
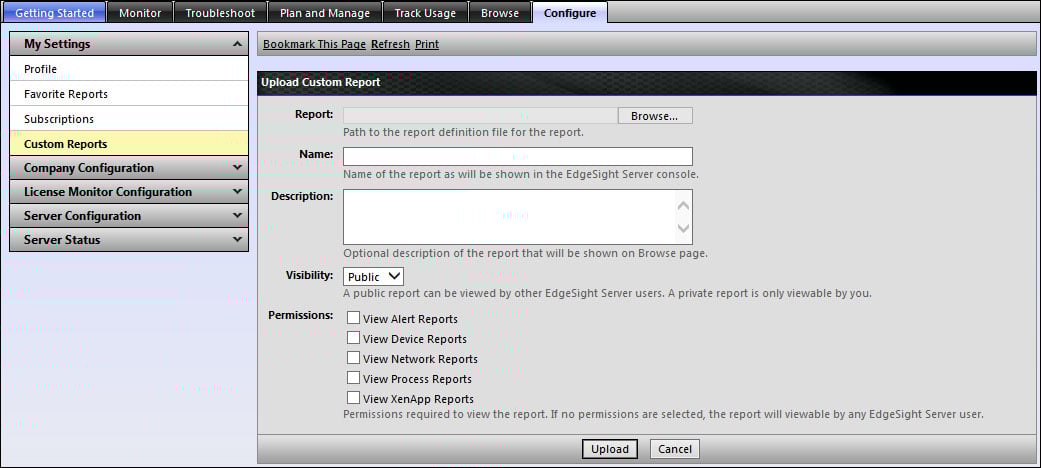
If you set the visibility to Private, then only the user uploading the report can view it.
EdgeSight can report the usage reported by the Citrix License Server for all types of Citrix licenses used in the organization.
In addition to Citrix licensing, EdgeSight can also display published application usage and session durations with both summary and detailed information. These reports are also available from the Browse tab.
To monitor your Citrix licensing server, the version of the licensing server should be at least 11.9.
We must first specify at least one Citrix License Server by navigating to Configure | License Monitor Configuration | License Servers and then clicking on the New License Server button. For the license server name we can specify either the IP address or the FQDN of the license server.

To configure the polling interval between two pools, navigate to Configure | License Monitor Configuration | Settings.

Setting the polling interval to 15 minutes means that a polling cycle will be initiated 15 minutes from the time that the last polling cycle completed.
For usage information about the published application, make sure that the EdgeSight for XenApp Support feature is configured as On - Basic and Advanced Agents by navigating to Configure | Server Configuration | Settings | Agent Support.

To track the usage of Citrix licenses, applications, and session durations, click on the Track Usage tab.

Once the license server has been configured for monitoring, EdgeSight Server directly polls the license server for information on license usage.
License server monitoring does not require an EdgeSight agent on the Citrix License Server.
To view the license server poller logfile, navigate to Configure | Server Status | Server Script Host. Locate the core_lsm_license_poller script, then click on the drop-down menu, and select View Log.
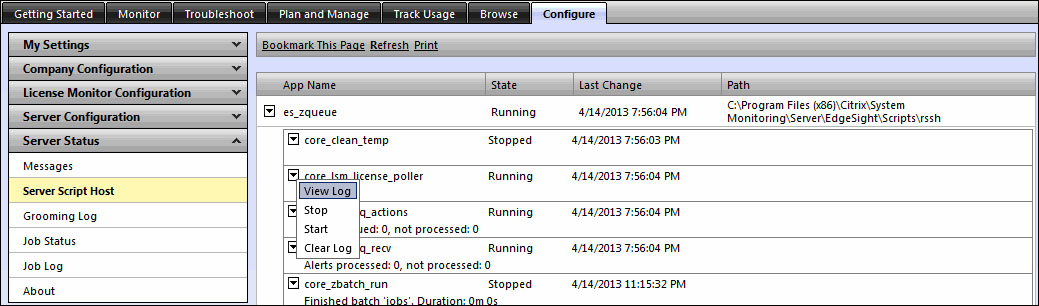
If there is any error in the polling, the logfile will display the error code and the reason for the failure and an e-mail are also sent to the EdgeSight administrator. If the license server poller is not able to connect to the Citrix License Server then an error code of -96 is written to the logfile.
You can also disable polling on any particular license server for maintenance or any other reason. If you disable polling, the previously collected license information from disabled servers will still appear in the License Usage Trending report, but no new license information is displayed for the disabled server in the License Usage Summary report until polling is enabled back.
You can also remove a license server configuration from the EdgeSight database by deleting it. If you delete a license server configuration, all license usage data associated with that license server is deleted from the EdgeSight database. After deletion, no data from the license server is displayed in the license usage reports.
EdgeSight provides a centralized console to investigate problems related to sessions, applications, systems, and networks without requiring us to somehow log in or connect to the device having the problem.
The important thing here is that the end device you are troubleshooting should have the EdgeSight agent installed.
To get the real-time performance data of a device, navigate to Troubleshoot | Device Troubleshooter.
Either enter the IP address or the name of the device you are troubleshooting in the Search field or browse in the department tree.
You can also use the slider to change the time frame for the data you want to be displayed.
Click on the Go button.

Click on the System Summary tab and look for important counters here such as Committed Bytes In Use, which displays the usage of the system memory.

Click on the counter you want to have a much deeper look at and EdgeSight will display more detailed information in a pop-up window. You can also click on a point on the pop-up chart to display point-in-time data for the counter.

In cases where the device is a XenApp server running a basic-level agent, data will not be displayed in some of the tabs; instead, a message is displayed in each affected tab.
Similar to Device Troubleshooter, the User Troubleshooter page can be used to display detailed performance data for sessions across a farm for any specified user. You will need to provide the username, and optionally the name of the server hosting the session, and then click on Find Sessions.
Several steps are involved from the time a user clicks on the icon of a published application to launch and use the application till the time the application finally launches. EdgeSight for XenApp can be used to diagnose those slow logins or slow sessions problems reported by the users; it lets you examine the steps involved and the time required to complete each step.
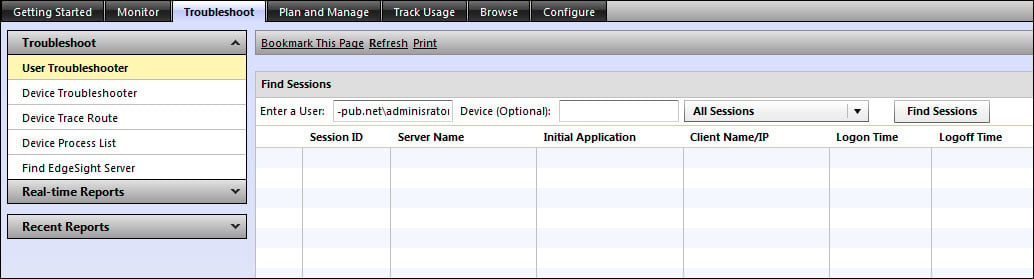
If no default credentials were specified for the farm before, then you can click on the browse button  and provide the credentials in the Find a XenApp Session – Webpage Dialog window.
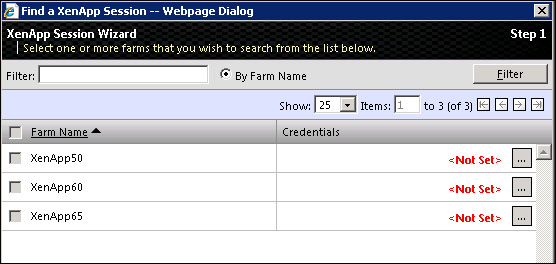
You can specify unique credentials for each XenApp farm in your environment.
You can also use the Device Process List page to display detailed information about processes that are currently running on the selected device.
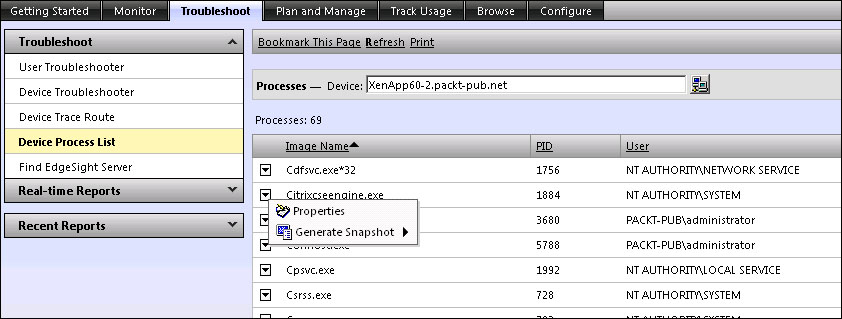
You can also generate a diagnostic snapshot (Normal or Full), which allows us to remotely analyze the current state of the selected device and investigate whether a particular process is the cause of the problem you are investigating. The snapshot generates a dump file on the selected device and is also uploaded to the server as an alert.
One other very useful troubleshooting tool here is the Device Trace Route tool.
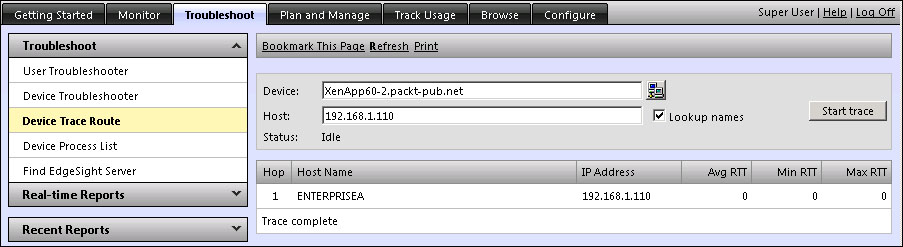
The Device Trace Route tool can be used to identify and route problems you may have; it allows you to execute a trace route from the selected remote device to a specified network host.
Due to the large amount of data collected by EdgeSight, it is recommended that good housekeeping should be completed by the EdgeSight administrator for EdgeSight to provide optimal results.
Similar problems can also be noticed if there is not enough disk space on the drive or other problems with the database. As a result of any of these problems, grooming errors might occur and those will also be displayed in the console.
In EdgeSight the primary database management mechanism is called grooming and is defined as the process of removing older data from a database at regular intervals to make room for new data.
There are eight data files in the EdgeSight database; the default location of these files is at C:\Program Files\Microsoft SQL Server\MSSQL10.MSSQLSERVER\MSSQL\DATA\.
We first need to find the data files that are larger in size than other data files. We can run the following query to extract this information:
SELECT Name, (size*8)/1024 Size
FROM sys.master_files
WHERE DB_NAME(database_id) = 'Edgesight'
The following table is the output I received after executing the query. Your output (size) will be different:
Name
Size
Edgesight2,500
Edgesight_log45,052
Edgesight_FG1_Data12,820
Edgesight_FG2_Data25,350
Edgesight_FG3_Data7,322
Edgesight_FG4_Data46,623
Edgesight_FG5_Data8,250
Edgesight_FG6_Data245,020
Edgesight_FG7_Data12,500
From the previous results we can see that in our case the database
Edgesight_FG6_Datais the largest in size. The size is in MBs.The next step is to determine the names of the tables that are hosted by that particular file group. We can determine those names by running the following query:
SELECT  DISTINCT object_name(sys.sysindexes.id) as 'Table Name' ,sys.filegroups.name as 'File Group Name'
FROM sys.sysindexes, sys.filegroups
WHERE objectproperty(sys.sysindexes.id,'IsUserTable') = 1
AND sys.filegroups.data_space_id = sys.sysindexes.groupid
ORDER BY sys.filegroups.name
The output from this query in my case was as follows:

The next step now would be to find out the number of rows in each table. Run the following query in SQL Server Management Studio to find the number of rows in both the
core_net_transandcore_net_stattables:SELECT sysobjects.Name, sysindexes.Rows FROM sysobjects INNER JOIN sysindexes ON sysobjects.id = sysindexes.id WHERE sysindexes.IndId < 2 AND sysobjects.Name IN('core_net_stat', 'core_net_trans')
The output from this query in my case was as follows:
Name
Rows
core_net_stat250475223
core_net_trans2457843
These results clearly tell us that the table named
core_net_transhas more rows thancore_net_statand hencecore_net_transwould also be much larger in size compared tocore_net_stat.The next step would be to find out the number of records that for some reason could not be deleted after the number of Groom Days has passed. The default Groom Days value for both the
core_net_transandcore_net_stattables is10days. To verify the Groom Days you can navigate to Configure | Server Configuration | Data Maintenance | Grooming.
We can use the following query to determine the number of records (if any) that could not be deleted:
SELECT COUNT(*) FROM CORE_NET_TRANS
WHERE dtperiod < GETUTCDATE() – 10
Note
If rows are returned from the preceding query that were older than 11 days, then that would mean that grooming failed. If no rows are returned older than the 10 days, further investigation needs to be performed and you might start from taking a look at what, and how much, data is stored inside the particular table.
Now we can run this query to delete rows by increments of 100,000:
Declare @row int; cf1 declare @date datetime; cf1 set @date = GETUTCDATE() - 10
Set @row = (select COUNT(*) from core_net_trans where dtperiod < @date);
While @row <> 0
Begin
Delete top(100000) from core_net_trans where dtperiod < @date
Set @row = (select COUNT(*) from core_net_trans where dtperiod < @date);
End;
We also need to reclaim the disk space after removing the unwanted rows. To do that, open SQL Server Management Studio and right-click on your EdgeSight database name. Here I have used
EdgeSightas the name; hence, click on EdgeSight | Tasks | Shrink | Files.
Select FG6 as the Filegroup value and click on OK.

You can also limit data uploads from the agents to the EdgeSight Server database by deselecting the type of performance data you are not interested in gathering. To configure these settings, navigate to Configure | Server Configuration | Data Maintenance | Upload Configuration.
This also optimizes the EdgeSight Server performance.