


In this chapter, we will cover the following:
Summary filters and detail filters
Sorting grouped values
Aggregation and rollup aggregation
Implementing if-then-else in filters
Formatting data – dates, numbers, and percentages
Creating sections
Hiding columns in crosstabs
Prompts – display value versus use value
In this chapter, we will cover some fundamental techniques that will be used in your day-to-day life as a Report Studio author. In each recipe, we will take a real-life example and see how it can be accomplished. At the end of the chapter, you will learn several concepts and ideas which you can mix-and-match to build complex reports. Though this chapter is called Report Authoring Basic Concepts, it is not a beginner's guide or a manual. It expects the following:
You are familiar with the Report Studio environment, components, and terminologies
You know how to add items on the report page and open various explorers and panes
You can locate the properties window and know how to test run the report
Based on my personal experience, I will recommend this chapter to new developers with two days to two months of experience. If you have more experience with Report Studio, you might want to jump to the next chapter.
In the most raw terminology, a report is a bunch of rows and columns. The aim is to extract the right rows and columns from the database and present them to the users. The selection of columns drive what information is shown in the report, and the selection of rows narrow the report to a specific purpose and makes it meaningful. The selection of rows is controlled by filters. Report Studio provides three types of filtering: detail, summary, and slicer. Slicers are used with dimensional models and will be covered in a later chapter (Chapter 7, Working with Dimensional Models). In the first recipe of this chapter, we will cover when and why to use the detail and summary filters.
Once we get the correct set of rows by applying the filters, the next step is to present the rows in the most business-friendly manner. Grouping and ordering plays an important role in this. The second recipe will introduce you to the sorting technique for grouped reports.
With grouped reports, we often need to produce subtotals and totals. There are various types of aggregation possible. For example, average, total, count, and so on. Sometimes, the nature of business demands complex aggregation as well. In the third recipe, you will learn how to introduce aggregation without increasing the length of the query. You will also learn how to achieve different aggregation for subtotals and totals.
The fourth recipe will build upon the filtering concept you have learnt earlier. It will talk about implementing the if-then-else logic in filters. Then we will see some techniques on data formatting, creating sections in a report, and hiding a column in a crosstab.
Finally, the eighth and last recipe of this chapter will show you how to use prompt's Use Value and Display Value properties to achieve better performing queries.
The examples used in all the recipes are based on the GO Data Warehouse (query) package that is supplied with IBM Cognos 10.1.1 installation. These recipe samples can be downloaded from the Packt Publishing website. They use the relational schema from the Sales and Marketing (query) / Sales (query) namespace.
The screenshots used throughout this book are taken from Cognos Version 10.1.1 and 10.2.
Business owners need to see the sales quantity of their product lines to plan their strategy. They want to concentrate only on the highest selling product for each product line. They would also like the facility to select only those orders that are shipped in a particular month for this analysis.
In this recipe, we will create a list report with product line, product name, and quantity as columns. We will also create an optional filter on the Shipment Month Key. Also, we will apply correct filtering to bring up only the top selling product per product line.
Create a new list report based on the GO Data Warehouse (query) package. From the Sales (query) namespace, bring up Products / Product line, Products/Product, and Sales fact / Quantity as columns, the way it is shown in the following screenshot:

Here we want to create a list report that shows product line, product name, and quantity, and we want to create an optional filter on Shipment Month. The report should also bring up only the top selling product per product line. In order to achieve this, perform the following steps:
We will start by adding the optional filter on Shipment Month. To do that, click anywhere on the list report on the Report page. Then, click on Filters from the toolbar.
In the Filters dialog box, add a new detail filter. In the Create Filter screen, select Advanced and then click on OK as shown in the following screenshot:

By selecting Advanced, we will be able to filter the data based on the fields that are not part of our list table like the Month Key in our example as you will see in the next step.
Define the filter as follows:
[Sales (query)].[Time (ship date)].[Month key (ship date)] = ?ShipMonth?
Validate the filter and then click on OK.
Set the usage to Optional as shown in the following screenshot:

Now we will add a filter to bring only the highest sold product per product line. To achieve this, select Product line and Product (press Ctrl and select the columns) and click on the group button from the toolbar. This will create a grouping as shown in the following screenshot:

Now select the list and click on the filter button again and select Edit Filters. This time go to the Summary Filters tab and add a new filter. In the Create Filter screen, select Advanced and then click on OK.
Define the filter as follows:
[Quantity] = maximum([Quantity] for [Product line]).
Set usage to Required and set the scope to Product as shown in the following screenshot:

Now run the report to test the functionality. You can enter
200401as the Month Key as that has data in the Cognos supplied sample.
Report Studio allows you to define two types of filters. Both work at different levels of granularity and hence have different applications.
The detail filter works at the lowest level of granularity in a selected cluster of objects. In our example, this grain is the Sales entries stored in Sales fact. By putting a detail filter on Shipment Month, we are making sure that only those sales entries which fall within the selected month are pulled out.
In order to achieve the highest sold product per product line, we need to consider the aggregated sales quantity for the products.
If we put a detail filter on quantity, it will work at sales entry level. You can try putting a detail filter of [Quantity] = maximum([Quantity] for [Product line]) and you will see that it gives incorrect results.
So, we need to put a summary filter here. In order to let the query engine know that we are interested in filtering sales aggregated at product level, we need to set the SCOPE to Product. This makes the query engine calculate [Quantity] at product level and then allows only those products where the value matches maximum([Quantity] for [Product line]).
When you define multiple levels of grouping, you can easily change the scope of summary filters to decide the grain of filtering.
For example, if you need to show only those products whose sales are more than 1000 and only those product lines whose sales are more than 25000, you can quickly put two summary filters for code with the correct Scope setting.
The detail filter can also be set to apply after aggregation (by changing the application property). However, I think this kills the logic of the detail filter. Also, there is no control on the grain at which the filter will apply. Hence, Cognos sets it to before aggregation by default, which is the most natural usage of the detail filter.
The output of the previous recipe brings the right information back on the screen. It filters the rows correctly and shows the highest selling product per product line for the selected shipment month.
For better representation and to highlight the best-selling product lines, we need to sort the product lines in descending order of quantity.
Open the report created in the previous recipe in Cognos Report Studio for further amendments.
In the report created in the previous recipe, we managed to show data filtered by the shipment month. To improve the reports look and feel, we will sort the output to highlight the best-selling products. To start this, perform the following steps:
Open the report in Cognos Report Studio.
Select the Quantity column.
Click on the Sort button from the toolbar and choose Sort Descending.
Run the report to check if sorting is working. You will notice that sorting is not working.
Now go back to Report Studio, select Quantity, and click on the Sort button again. This time choose Edit Layout Sorting under the Other Sort Options header.
Expand the tree for Product line. Drag Quantity from Detail Sort List to Sort List under Product line as shown in the following screenshot:

Click on the OK button and test the report. This time the rows are sorted in descending order of Quantity as required.
The sort option by default works at the detailed level. This means the non-grouped items are sorted by the specified criteria within their own groups.
Here we want to sort the product lines that are grouped (not the detailed items). In order to sort the groups, we need to define a more advanced sorting using the Edit Layout Sorting options shown in this recipe.
You can also define sorting for the whole list report from the Edit Layout Sorting dialog box. You can use different items and ordering for different groups and details.
You can also choose to sort certain groups by the data items that are not shown in the report. You need to bring only those items from source (model) to the query, and you will be able to pick it in the sorting dialog.
Business owners want to see the unit cost of every product. They also want the entries to be grouped by product line and see the highest unit cost for each product line. At the end of the report, they want to see the average unit cost for the whole range.
Create a simple list report with Products / Product line, Products/Product, and Sales fact / Unit cost as columns.
In this recipe, we want to examine how to aggregate the data and what is meant by rollup aggregation. Using the new report that you have created, this is how we are going to start this recipe:
We will start by examining the Unit cost column. Click on this column and check the Aggregate Function property.
Set this property to Average.
Add grouping for Product line and Product by selecting those columns and then clicking on the GROUP button from the toolbar.
Click on the Unit cost column and then click on the Summarize button from the toolbar. Select the Total option from the list.
Now, again click on the Summarize button and choose the Average option as shown in the following screenshot:

The previous step will create footers as shown in the following screenshot:

Now delete the line with the <Average (Unit cost)> measure from Product line. Similarly, delete the line with the <Unit cost> measure from Summary. The report should look like the following screenshot:

Click on the Unit cost column and change its Rollup Aggregate Function property to Maximum.
Run the report to test it.
In this recipe, we have seen two properties of the data items related to aggregation of the values.
We first examined the aggregation property of unit cost and ensured that it was set to average. Remember that the unit cost here comes from the sales table. The grain of this table is sales entries or orders. This means there will be many entries for each product and their unit cost will repeat.
We want to show only one entry for each product and the unit cost needs to be rolled up correctly. The aggregation property determines what value is shown for unit cost when calculated at product level. If it is set to Total, it will wrongly add up the unit costs for each sales entry. Hence, we are setting it to Average. It can be set to Minimum or Maximum depending on business requirements.
In order to show the maximum unit cost for product type, we create an aggregate type of footer in step 4 and set the Rollup Aggregation to Maximum in step 8.
Note
Here we could have directly selected Maximum from the Summarize drop-down toolbox. But that creates a new data item called Maximum (Unit Cost). Instead, we ask Cognos to aggregate the number in the footer and drive the type by rollup aggregation property. This will reduce one data item in query subject and native SQL.
We also need to show the overall average at the bottom. For this we have to create a new data item. Hence, we select unit cost and create an Average type of aggregation in step 5. This calculates the Average (Unit Cost) and places it on the product line and in the overall footer.
We then deleted the aggregations that are not required in step 7.
The rollup aggregation of any item is important only when you create the aggregation of Aggregate type. When it is set to automatic, Cognos will decide the function based on the data type, which is not preferred.
It is good practice to always set the aggregation and rollup aggregation to a meaningful function rather than leaving them as automatic.
Business owners want to see the sales quantity by order methods. However, for the Sales Visit type of order method, they want a facility to select the retailer.
Therefore, the report should show quantity by order methods. For the order methods other than Sales Visit, the report should consider all the retailers. For Sales Visit orders, it should filter on the selected retailer.
Create a simple list report with Order method / Order method type and Sales fact / Quantity as columns. Group by Order method to get one row per method and set the Aggregation for quantity to Total.
In this recipe, we need to create a filter that will be used to select the retailer if the Order method is Sales Visit. We will check what will happen if we use the if then else construction inside the filter and how to overcome any problems with the following steps:
Here we need to apply the retailer filter only if Order method is Sales Visit. So, we start by adding a new detail filter.
Define the filter as follows:
if ([Order method type]='Sales visit') then ([Sales (query)].[Retailers].[Retailer name] = ?SalesVisitRetailer?).
Validate the report. You will find multiple error messages.
Now change the filter definition to:
(([Order method type]='Sales visit') and ([Sales (query)].[Retailers].[Retailer name] = ?SalesVisitRetailer?)) or ([Order method type]<>'Sales visit').
Validate the report and it should be successful.
Run the report and test the data.
The if else construct works fine when it is used in data expression. However, when we use it in a filter, Cognos often doesn't like it. It is strange because the filter is parsed and validated fine in the expression window and if else is a valid construct.
The workaround for this problem is to use and...or clauses as shown in this recipe. The if condition and corresponding action item are joined with the and clause. The else part is taken care of by the or operations with the reverse condition (in our example, Order Method <> 'Sales Visit').
You need not use both and and or clauses all the time. The filtering in this example can also be achieved by this expression:
-([Sales (query)].[Retailers].[Retailer name] = ?SalesVisitRetailer?)
or
([Order method]<>'Sales visit')
Depending on the requirement, you need to use only or, only and, or the combination of and...or.
Virtually all reports involve displaying numerical information. It is very important to correctly format the numbers. In this recipe, we will create a report which formats dates, numbers, and percentages.
Date transformation and formatting are important in business reports. We will see two ways of displaying MONTH-YEAR from the Shipment Date Key. We will apply some formatting to a numeric column and will also configure a ratio to be displayed as a percentage.
Create a simple list report with Products / Product line, Products / Product type, and Time (ship date) / Date (ship date) as columns from the Sales (query) namespace.
Also, add Quantity , Unit price, and Unit cost from the Sales fact Query Subject.
Create a grouping on Product line and Product type.
In this recipe, we will check how to apply different formats on the data items.
We will start by formatting the date column we have (check in Cognos 8).
Select the Time (ship date) / Date (ship date) column and open Data Format from the Properties pane. Open the Data Format dialog box by clicking on the Browse button next to the Data Format property.
Choose the format type Date, set Date Style to Medium, and set Display Days to No, as shown in the following screenshot:

Now select the Quantity column in the report. Choose Data Format from property and open the dialog box again.
This time select Number as the type and set the different properties as required. In our example recipe, we will set the Number of Decimal Points to 2 and use brackets () as a Negative Sign Symbol.
Finally, we will add the ratio calculation to the report. For that, add a new query calculation and define it as follows:
[Unit price]/[Unit cost]
Select this column and from the Data Format property dialog box, set it as Percent. Choose % as the Percentage Symbol and set the Number of Decimal Places to 2. Also, set the Divide by Zero Characters to N/A.
Run the report to test it.
In this recipe, we are trying multiple techniques. We are checking how dates can be formatted to hide certain details (for example, days) and how to change the separator. Also, we have tested formatting options for numbers and the percentage.
Here, we started by setting the data format for the Month Year column as date for display purposes. We have set the display days to No as we only want to display MONTH-YEAR.
Please note that ideally the warehouse stores a calendar table with a Date type of field; this is made available through the Framework model. Also, we are assuming here that you need to see the shipment month. So, you want to see the MONTH-YEAR format only and we are hiding the days.
Using the data format options, you can do a lot of things. Assume that you don't have a date field in your data source but instead you have just a date key and you want to display the year and month as we did in our recipe. For that, create a new query calculation and use the following expression:
[Sales (query)].[Time (ship date)].[Day key (ship date)]/10000
Now set the Data Format to Number with the following options:
Set the No of decimal places field to 2
Set the Decimal separator to -
Set Use thousand separator to No
Run the report to examine the output. You will see that we have gotten rid of the last two digits from the day key and the year part is separated from the month part by a hyphen. This is not truly converted to MONTH-YEAR, but conveys the information as shown in the following screenshot:

The advantage here is that the numerical operation is faster than converting the numerical key to DATE. We can use similar techniques to cosmetically achieve the required result.
Users want to see the details of orders. They would like to see the order number and then a small table showing the details (product name, promotion, quantity, and unit sell price) within each order.
Create a simple list report with Sales order / Order number, Products / Product, Sales fact / Quantity, and Sales fact / Unit sale price as columns.
Creating sections in a report is helpful to show a data item as the heading of a section. When you run the report, separate sections appear for each value. There is a way to reconstruct the report, and this is how to do it:
Click on the Order number column. Hit the Section button on the toolbar as shown in the following screenshot:

You will see that Report Studio automatically creates a header for Order number and moves it out of the list.
Notice that the Order number field is now grouped as shown in the following screenshot:

Run the report to test it.
The information we are trying to show in this report can also be achieved by normal grouping on order number. That will bring all the related records together. We can also set an appropriate group/level span and sorting for better appearance.
However, in this recipe, I want to introduce another feature of Report Studio called section.
When you create a section on a column, Report Studio automatically does the following:
It creates a new list object and moves the current report object (in our case, the existing list) inside that. This is report nesting. Both the inner and outer objects use the same query.
It creates grouping on the column selected for section, which is Order number in this case. It also creates a group header for that item and removes it from the inner list.
It formats the outer list appropriately. For example, hiding the column title.
Some of the advantages of creating sections are as follows:
As mentioned earlier, Report Studio does a lot of the work for you and gives you a report that looks more presentable. It makes the information more readable by clearly differentiating different entities; in our case, different orders. You will see mini-lists or tables, one for each Order number, as shown in the following screenshot:

As the outer and inner queries are the same, there is no maintenance overhead.
The Creating a nested report – defining the master-detail relationship recipe in Chapter 2, Advanced Report Authoring
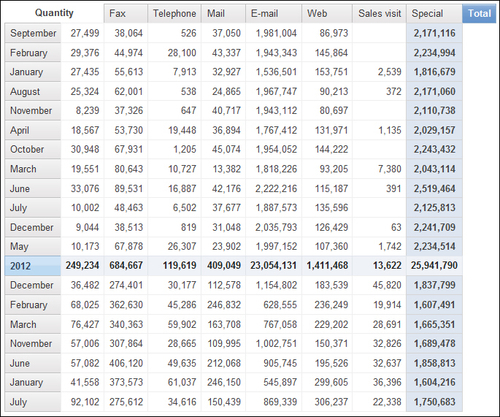
Users want to see sales figures by periods and order method. We need to show monthly sales and the yearly total sales. The year should be shown in the Year total row and not as a separate column.
Create a crosstab report with Sales fact / Quantity as a measure. Drag Time/Year and Month on rows, Order method / Order method type on column as shown in the following screenshot, and create aggregation on measure:
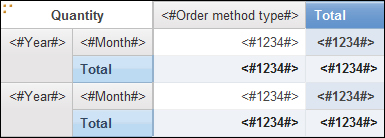
Add a total for the Month and Order method type then define appropriate sorting if required.
In this recipe, we want to hide the year from the crosstab and show it only in the report as a year total. To do this, perform the following steps:
First, let's identify the issue. If you run the report as it is, you will notice that the year is shown to the left of the months. This consumes one extra column. Also, the yearly total doesn't have a user friendly title as shown in the following screenshot:

We will start by updating the title for the yearly total row. Select the <Total(Month)> crosstab node. Change its Source Type to Data Item Value instead of Data Item Label and choose Year as the Data Item Value.
Run the report and check that the yearly total is shown with the appropriate year as shown in the following screenshot:

Now we need to get rid of the year column on the left edge. For that, click on the Unlock button in the Report Studio toolbar. The icon should change to an open lock (unlocked).
Now select the <#Year#> text item (not the whole cell) and delete it.
Select the empty crosstab node left after deleting the text. Change its Padding to 0 pixels in all directions.
Run the report and you will see the following screenshot:

As you can see the year column on the left is now successfully hidden.
When we want to hide an object in Report Studio, we often set its Box Type property to None. However, in this case, that was not possible.
Try setting the Box Type of the year column to None and run the report. It will look like the following screenshot:
As you can see, the cells have shifted to the left leaving the titles out of sync. This is most often the problem when Report Studio creates some merged cells (in our case, for the aggregations).
The solution to this is to format the column in such a way that it is hidden in the report as we have seen in this recipe.
This solution works best in HTML output. The Excel output still has a column on the left with no data in it.
You might need to define the background color and bordering as well so as to blend the empty column with either the page background on the left or the month column on the right.
In order to achieve the best performance with our queries, we need to perform filtering on the numerical key columns. However, the display values in the prompts need to be textual and user friendly.
In this recipe, we will create a filter that displays the product line list (textual values) but actually filters on the numerical codes (Product_Line_Code).
In this recipe, we will create a prompt and examine the differences between using the display value and the use value.
Open Page Explorer and click on the Prompt Pages folder. Drag a new page from Toolbox under Prompt Pages.
Double-click on the newly created prompt page to open it for editing.
From the toolbox, drag Value Prompt to the prompt page. This will open a wizard.
Set the prompt name to
ProductLineand then click on Next as shown in the following screenshot:
Keep the Create a parameterized filter option checked. For Package item, choose Sales (query) / Products / Product line code. Click on Next as shown in the following screenshot:

Keep the Create new query option checked. Give the query name as
promptProductLine.Under Value to display, select Sales (query) / Products / Product line.

Click on the Finish button. Run the report to test it.
When you drag a prompt object from Toolbox, Report Studio launches the prompt wizard.
In the first step, you choose the parameter to be connected to the prompt. It might be an existing parameter (defined in the query filter or framework model) or a new one. In this recipe, we chose to create a new one.
Then, you are asked whether you want to create a filter. If there is already a filter defined, you can uncheck this option. In our example, we are choosing this option and creating a filter on Product line code. Please note that we have chosen the numerical key column here. Filtering on a numerical key column is a standard practice in data warehousing as it improves the performance of the query and uses the index.
In the next step, Report Studio asks where you want to create a new query for the prompt. This is the query that will be fired on the database to retrieve prompt values. Here we have the option to choose a different column for the display value.
In our recipe, we chose Product line as the display value. Product line is the textual or descriptive column that is user friendly. It has one-to-one mapping with the Product line code. For example, Camping Equipment has a product line code of 991.
Hence, when we run the report, we see that the prompt is populated by Product line names, which makes sense to the users. Whereas if you examine the actual query fired on the database, you will see that filtering happens on the key column; that is, Product line code.
You can also check the generated SQL from Report Studio.
In order to do that, navigate to the Tools | Show Generated SQL/MDX option from the menu as shown in the following screenshot:
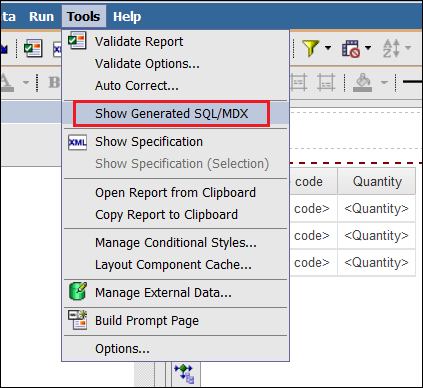
It will prompt you to enter a value for the product line code (which is proof that it will be filtering on the code).
Enter any dummy number and examine the query generated for the report. You will see that the Product line code (key column) is being filtered for the value you entered.
So, now you know how the prompt display values and use values work.
If you ever need to capture the prompt value selected by the user in expressions (which you will often need for conditional styling or drill-throughs), you can use the following two functions:
ParamDisplayValue (parameter name): This function returns the textual value which represents the display value of the prompt. In our example, it will be the product line that was selected by the user.
ParamValue (parameter name): This function returns the numeric value which represents the use value of the prompt. In our example, it will be the Product line code for the product line selected by the user.