


 Download code from GitHub
Bringing Visibility and Allocating Cost
With so many things to look at, often, the FinOps team does not know where to start, what to look for, and how to establish a successful FinOps practice for the organization. In this chapter, we will start by bringing visibility to your existing IT environment using two powerful tools. First is the Microsoft Well-Architected Framework (WAF) Cost Optimization assessment questionnaire. This will help you understand the people side of things and what practices engineers, DevOps, product owners, and solution architects follow to build and deploy their workloads in Azure. At the end of the self-assessment, you will be provided with a baseline score. This score is your starting point to keep track of your improvements over a quarter or year. As you make small adjustments, this score will improve over time. The second tool we will explore is Microsoft’s Cost Management + Billing to show your current cloud costs and the drivers behind them.
Once you have this visibility, we will move on to understanding cost allocation. We will use accounts, management groups, subscriptions, and tags to allocate the cost proposed by the finance team.
In this chapter, we’re going to cover the following main topics:
- Tools used in this book for implementing FinOps for Microsoft Azure
- What is the Microsoft Azure Well-Architected Framework?
- Creating a baseline using WAF – the Cost Optimization assessment
- Cost allocation from an accounting point of view
- Cost allocation in Azure for FinOps
- Exploring cost analysis in the Azure portal
Let’s get started!
Technical requirements
We will be using the Azure Well-Architected Review from Microsoft Assessments to accomplish the tasks in this chapter, which is available at https://docs.microsoft.com/en-us/assessments. It is an online self-assessment that takes about 30-60 minutes to complete.
When using this tool, be sure to sign in using your organization ID. In the next section, we will look at the tools that need to be installed to complete the tasks throughout this book.
Tools used in this book for implementing FinOps for Microsoft Azure
Your organization uses Microsoft Azure. You will be using Microsoft Azure’s native capabilities to fulfill the requests by the FinOps team. Please follow the instructions provided to set up the tools and verify your access in Microsoft’s Azure portal.
Azure CLI
We will be using Microsoft Azure’s command-line interface to run ad hoc scripts. Follow these steps to download and install the az command-line interface:
- Open the Microsoft Edge browser.
- Navigate to https://aka.ms/installazurecliwindows.
- Once the download is complete, navigate to the
Downloadsfolder. - Run the MSI installer.
- Once complete, open Command Prompt and run the following command:
az login
This command will open a pop-up window where you can sign in to your Azure subscription. You will see the subscription details in Command Prompt after successful authentication.
Power BI Desktop
Power BI Desktop is Microsoft’s tool for providing rich interactive reports and visual analytics. This tool is free to use and provides built-in connectors for Azure Cost Analysis. Follow these steps to download and install Power BI Desktop:
- Open the Microsoft Edge browser.
- Navigate to https://aka.ms/pbidesktopstore. This link will open the Windows Store.
- Click Install.
- Once the installation is complete, go to the Start menu and open Power BI Desktop.
You will see Power BI Desktop’s welcome screen, which contains Getting started videos and links to the Power BI tutorials.
Azure Cost Management + Billing
Cost Management + Billing is a Microsoft native tool built into the Azure portal that allows you to analyze, manage, and optimize the costs of your application or workload. It currently supports the Microsoft Online Services Program, Enterprise Agreement, and Microsoft Customer Agreement types of billing account. To access Cost Management + Billing, you will need the Reader or Cost Management Reader permission in Azure. Let’s verify that you can access the billing data:
- Open the Microsoft Edge browser.
- Navigate to https://portal.azure.com and sign in with your organization’s account.
- In the top search bar, search for
Cost Management + Billingand select the highlighted service. - Once it opens, you should be able to see the overview page, where you can see the latest billed amount, invoices over time, and subscriptions.
Cost Management + Billing has a tab on the left where you can access a more detailed cost management view. You can also give it a try and make sure you can access the page.
Azure Advisor
Azure Advisor is a personalized service that scans Azure resources proactively periodically and provides actionable recommendations for workload optimization. To access the Advisor recommendations, you will need at least the Reader permission in Azure.
Follow these steps to access Azure Advisor:
- Open the Microsoft Edge browser.
- Navigate to https://portal.azure.com and sign in with your organization’s account.
- In the top search bar, search for
Advisorand select the highlighted service. - Once it opens, you should be able to see the overview page with your Advisor score, score history, and recommendations across five categories – Cost, Security, Reliability, Operational Excellence, and Performance.
You can click All Recommendations on the left navigation bar to view recommendations across all categories.
Azure Monitor
Azure Monitor is a cloud-based monitoring and analytics service by Microsoft. It collects and analyzes telemetry data from various sources, such as applications, infrastructure, and network devices. It helps you identify and troubleshoot issues proactively, optimize performance, and gain insights for better decision-making. At a minimum, you will need the Reader permission in Azure to view the monitoring data and dashboards.
Follow these steps to access Azure Monitor:
- Open the Microsoft Edge browser.
- Navigate to https://portal.azure.com and sign in with your organization’s account.
- In the top search bar, search for
Monitorand select the highlighted service. - Once it has opened, you will be presented with an overview page that displays your monitor’s Insights, Detection, Triage, and Diagnostics details.
On the overview page, you can also use the curated monitoring views for specific Azure resources, such as Application Insights, Container Insights, and VM Insights.
Azure Pricing Calculator
Azure Pricing Calculator is an online tool that you can use to estimate the cost of your workload. Once you know what services you will need, you can select those in Pricing Calculator; you can select SKUs and Instance Configuration to get the monthly price. Here, you can also get estimates for pay-as-you-go, 1-year reservation, and 3-year reservation pricing, which includes a 30-60% discount depending on the service.
To access Azure Pricing Calculator, do the following:
- Open the Microsoft Edge browser.
- Navigate to https://azure.microsoft.com/calculator and log in to Pricing Calculator with your organization’s account.
- Once you’ve logged in, you will be able to create, save, and share the pricing estimates.
Note that, by default, Pricing Calculator shows the street price. Your organization may have a special licensing agreement with Microsoft, for example, Enterprise Agreement. To get your discounted Enterprise Agreement pricing, select your licensing program under the Support section of the page. The pricing will be updated once you select the correct agreement. Next, let’s move on to the Microsoft WAF.
What is the Microsoft Azure Well-Architected Framework?
The Azure WAF is a guiding principle across five pillars of architectural excellence that produces high-quality and efficient architecture for your workload in Azure. These pillars are as follows:
- Reliability
- Security
- Cost Optimization
- Operational Excellence
- Performance Efficiency
Since the FinOps team is focused on managing the cloud costs and maximizing the value delivered to the business, we will focus on the Cost Optimization pillar of WAF. WAF is supported by six elements – Well-Architected Review, Azure Advisor, Documentation, Partner Support and Service Offer, Reference Architectures, and Design Principles. Azure Well-Architected Review examines your workload through the lens of cost management. WAF reviews also help bring visibility to engineering, the product and DevOps teams’ knowledge, and the ability and priorities around considering the cost for every decision they make for the cloud infrastructure. Let’s assemble the team and have them take the WAF Cost Optimization assessment.
Creating a baseline using the WAF Cost Optimization assessment
The scope of the WAF Cost Optimization assessment is per application or workload. First, you must identify the large workload. This assessment is a collaborative effort between FinOps, cloud governance, engineering, DevOps, architecture, and product teams. Ideally, this assessment is completed in a single two-hour meeting. The FinOps lead facilitates the meeting, provides clarification of the questions, and records the final answers. As you go through the questions, you will realize how much knowledge flows through. This is a fantastic opportunity for you to get a good insight into the thinking and decision-making patterns of engineering and DevOps teams. Follow these steps to run through the assessment:
- Open the Microsoft Edge browser.
- Navigate to https://docs.microsoft.com/en-us/assessments.
- Select Azure Well-Architected Review from the Available assessments list:
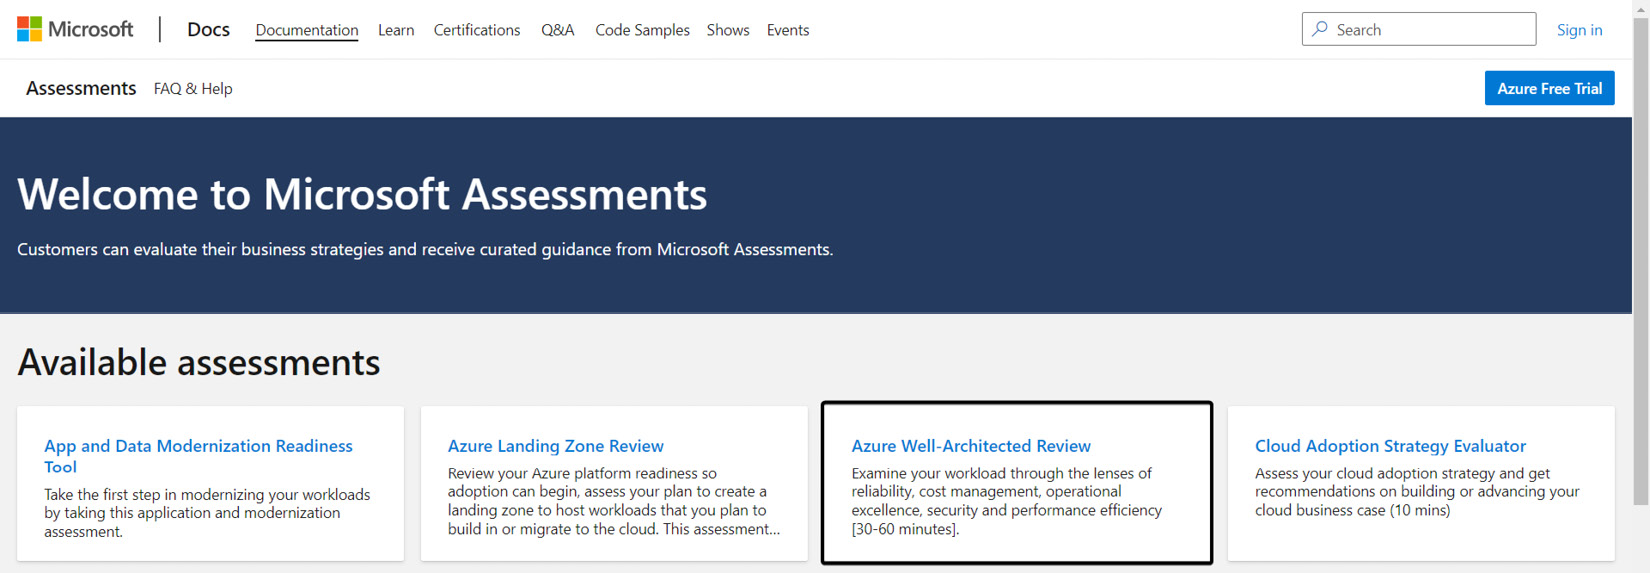
Figure 1.1 – Microsoft Assessments
- To save your progress, you will need to sign in with your organization ID. After that, give your assessment a name and click Import to include Azure Advisor recommendations. When you click Import, the pop-up window will list all your Azure accounts. Select the account that belongs to the workload and then click Continue. On the next screen, select the workload subscription and click Import.
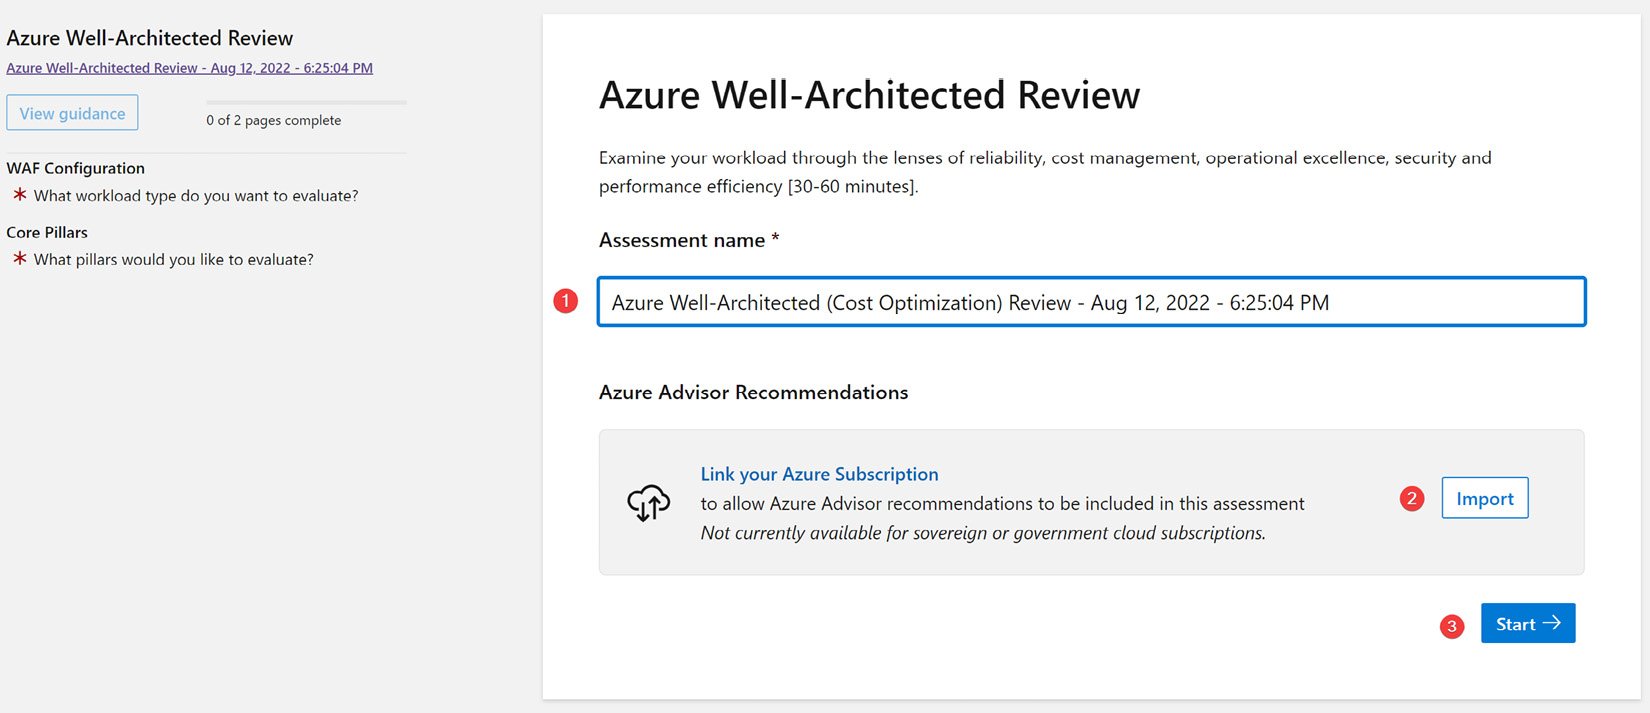
Figure 1.2 – Azure Well-Architected Review
- Once your subscription has been linked, you will see a screen similar to the following. At this point, click Start.
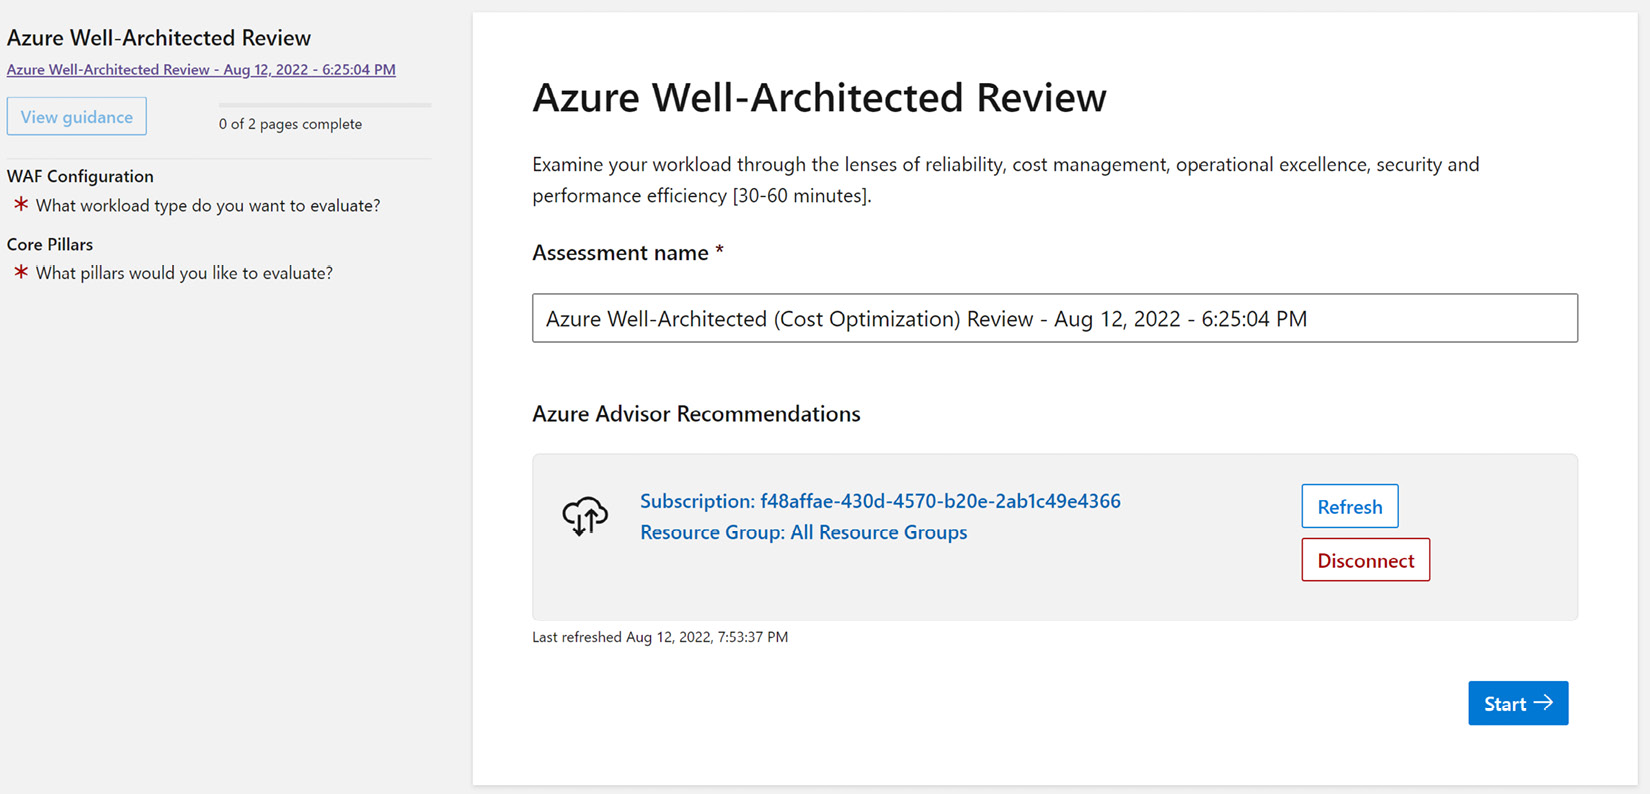
Figure 1.3 – Import Azure Advisor recommendations
- The Cost Optimization pillar falls under Core Well-Architected Review. So, check that option and then click Next.
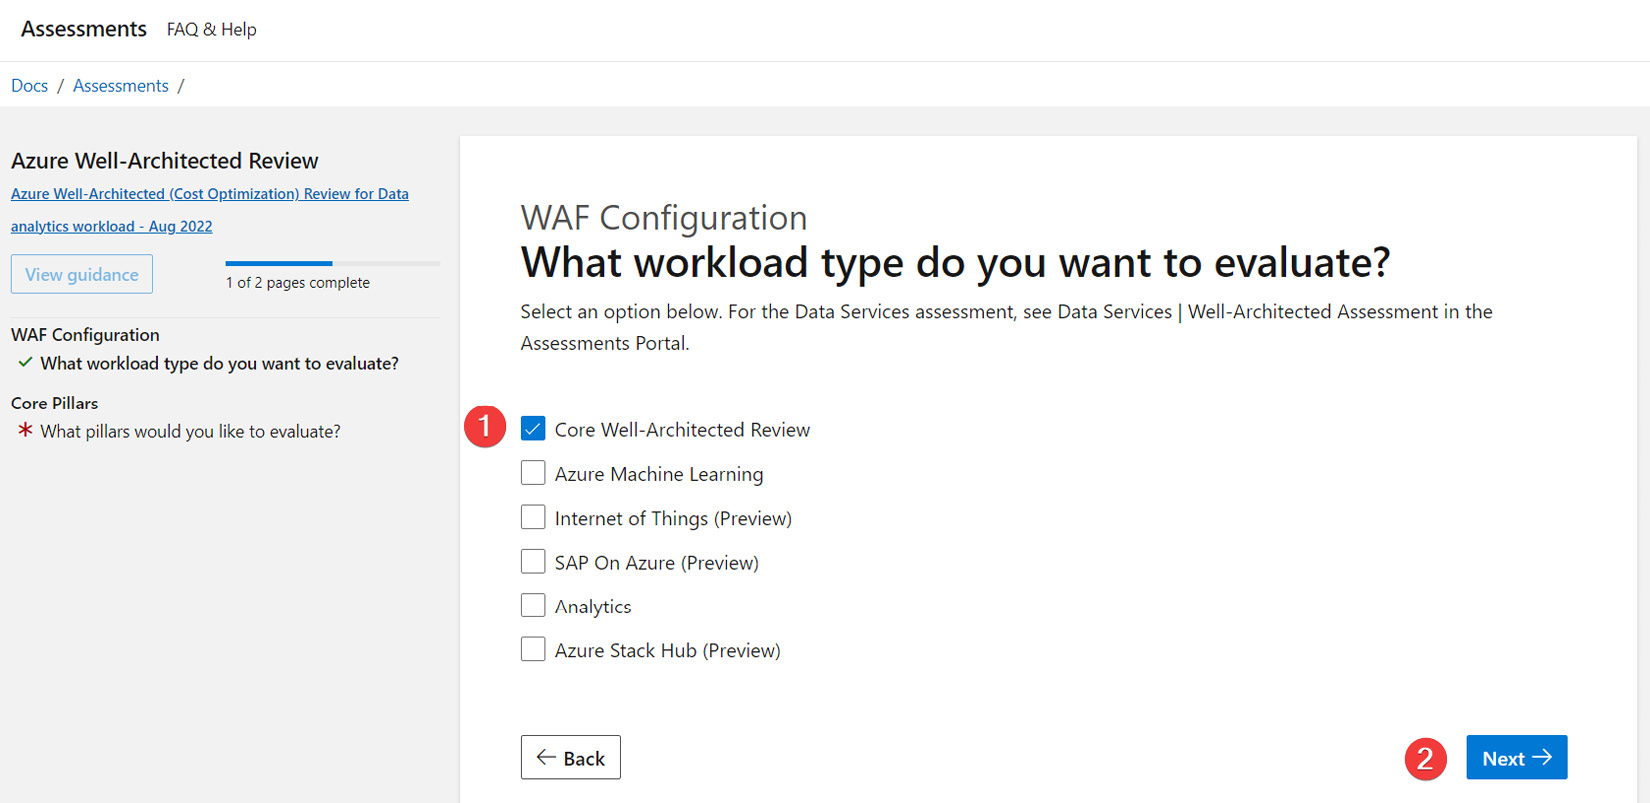
Figure 1.4 – WAF Configuration
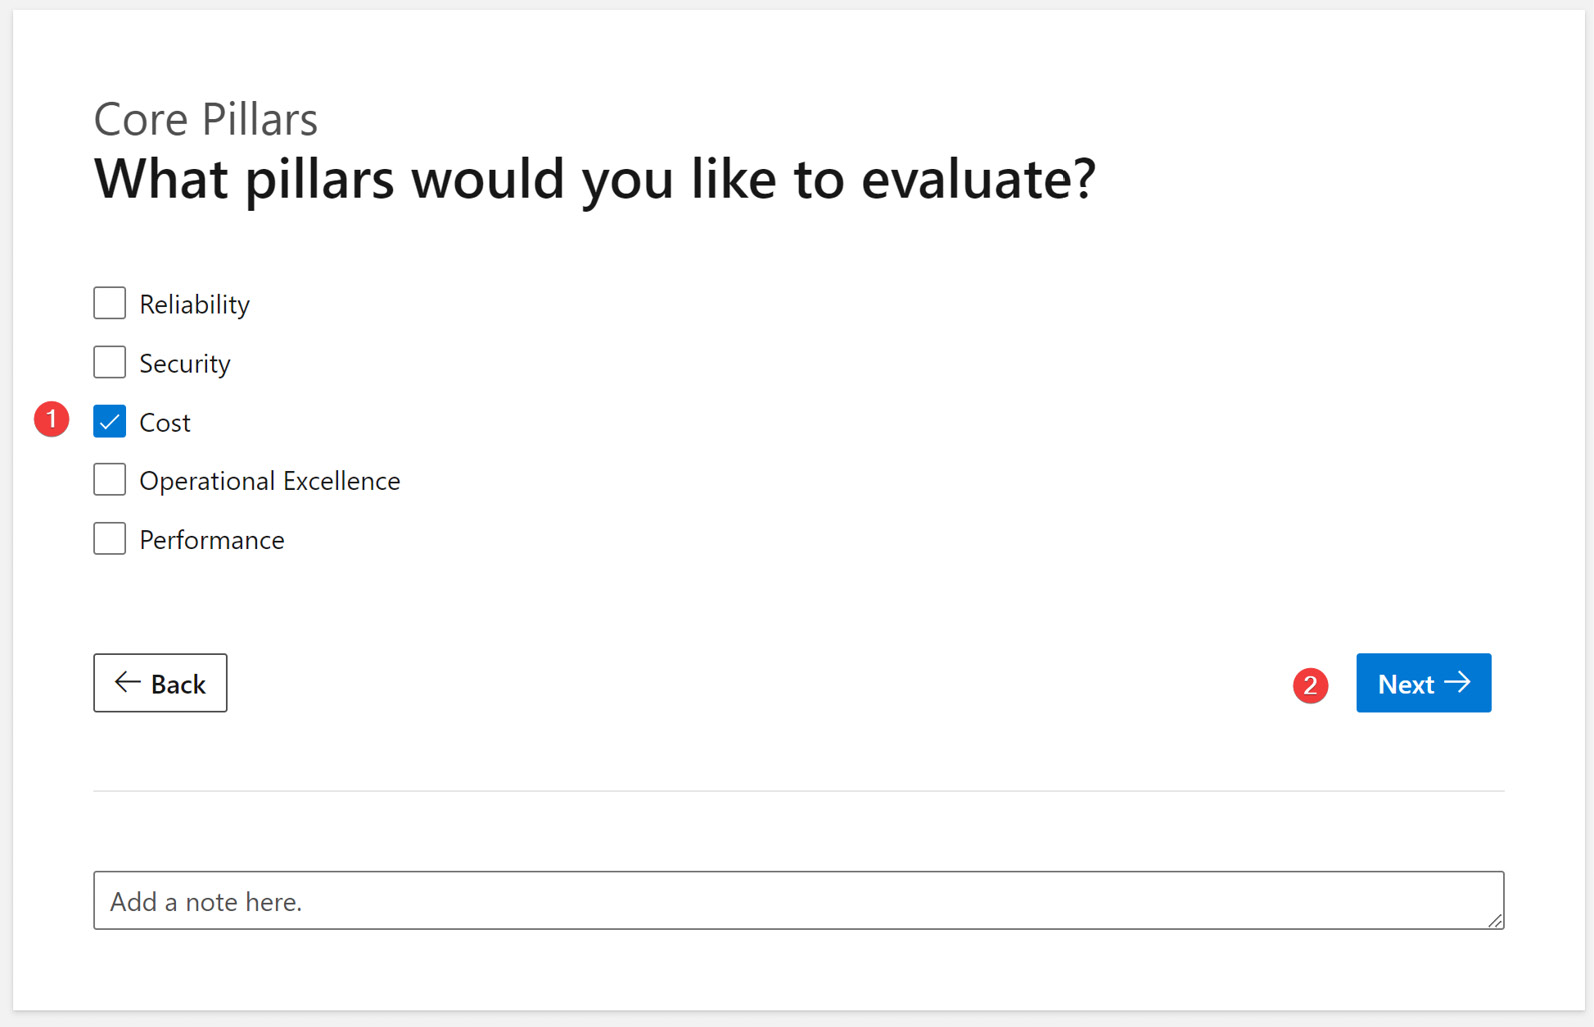
Figure 1.5 – Core pillars of WAF
At this point, the WAF cost assessment questions start. Let’s understand the key parts of the assessment screen. There are nine sections, and each section has a different number of questions that the team will collaboratively answer.
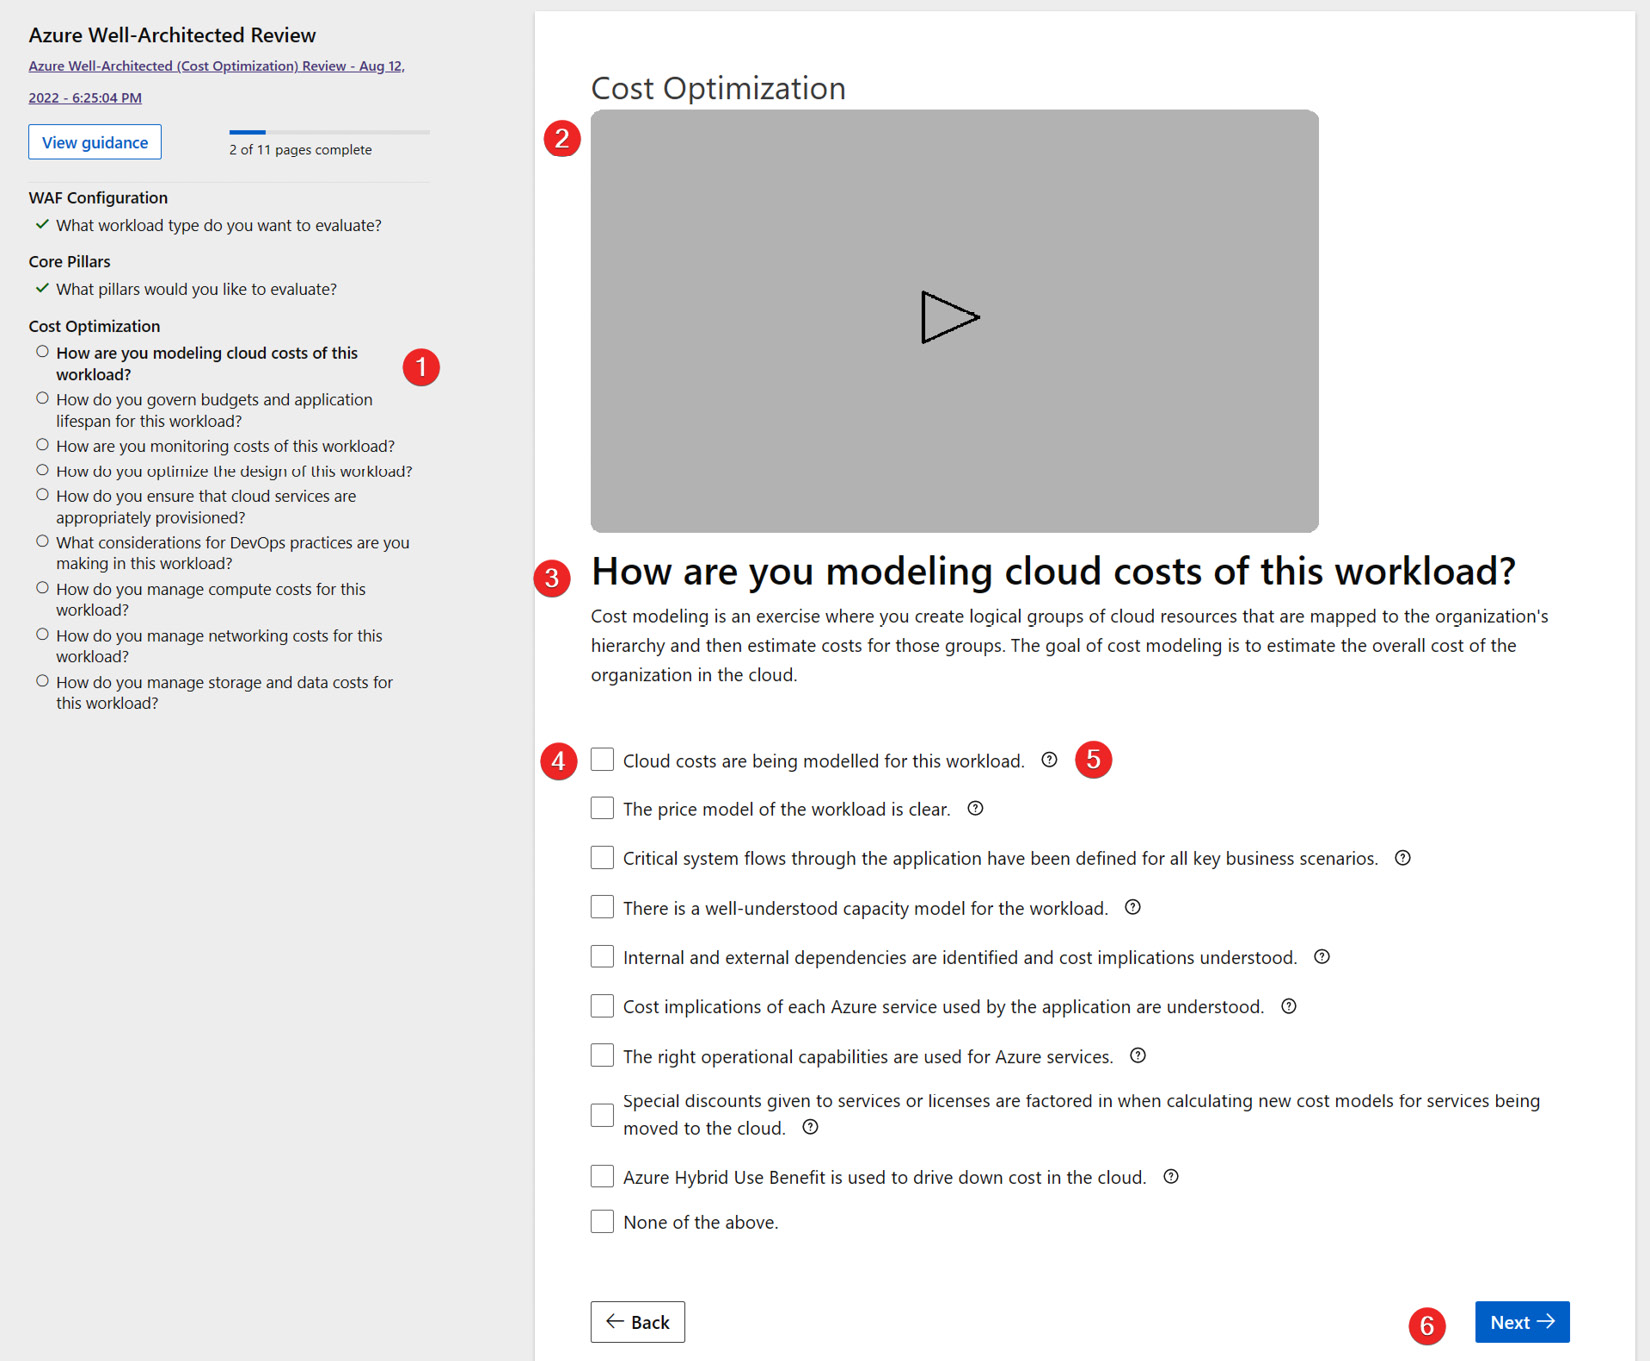
Figure 1.6 – Azure Well-Architected Review
The main parts of the assessment screen are as follows:
- On the left-hand side is the list of Cost Optimization sections.
- At the top of the screen is a short video explaining what each section means.
- Under the video is the title of the current section – for example, How are you modeling cloud costs of this workload?.
- Below is the list of questions, each with a checkbox. You discuss these questions with the team and check the box if applicable. If they are unsure, leave the box unchecked.
- The question marks to the right of each item provide more context to help you understand the option.
- Once you have completed all the questions, click Next to move to the next section.
Once you have completed all the sections, the Your results screen will appear. Let’s understand the results screen. The top part of the screen displays your overall score. As shown in the following screenshot, I received a score of MODERATE, which means a score between 33 and 76. So, my workload is following some cost optimization best practices, but there is lots of room for improvement. You can export the result to a CSV file and use that later to either create your own dashboard to keep track of the progress on each item or import it into Azure DevOps for tracking purposes.
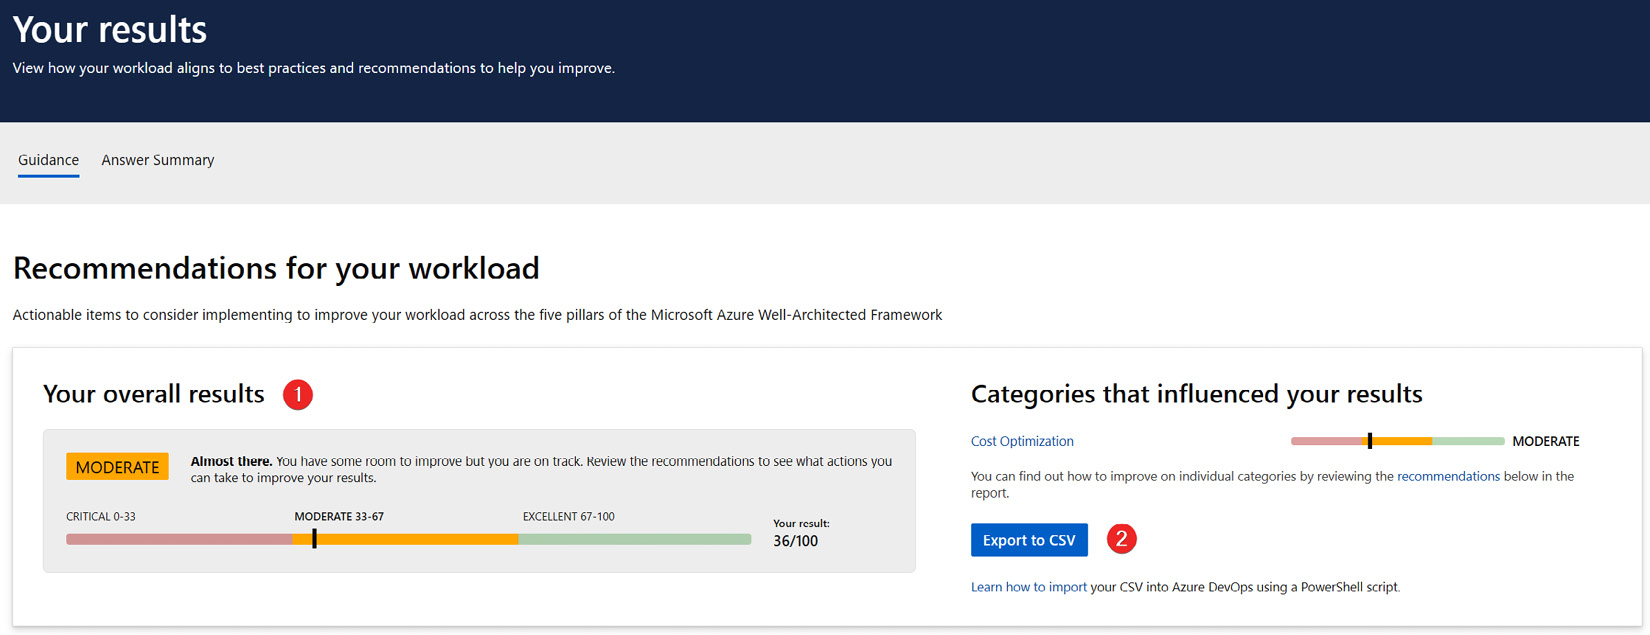
Figure 1.7 – Overall results of the Well-Architected Review assessment
Below the results section, the screen shows a list of all recommendations with a link to the Microsoft documentation, which helps you practice that specific cost optimization area.
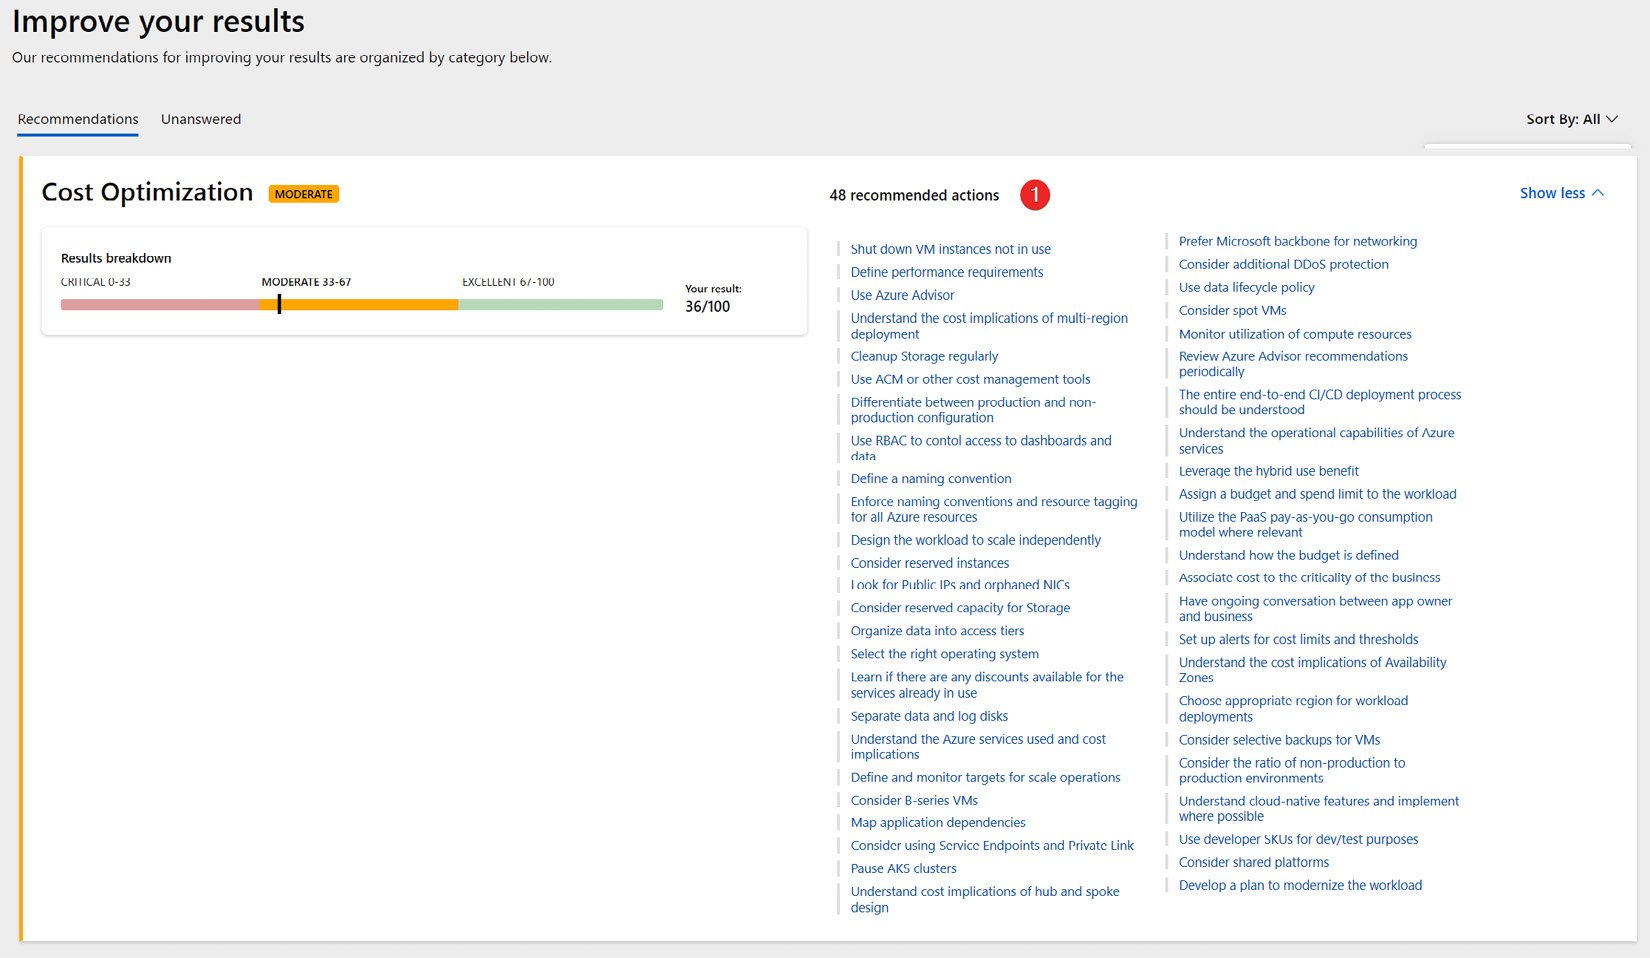
Figure 1.8 – Detailed results of the Well-Architected Review assessment
With that, we have looked at how to create a WAF baseline score. Now that you have the baseline score for your selected workload, let’s understand what cost allocation is and how you can practice it in Azure.
Cost allocation from an accounting point of view
As per the Oxford dictionary definition, cost accounting involves recording all the costs incurred in a business in a way that can be used to improve its management. There are two approaches to cost allocation in cost accounting: traditional and activity-based cost (ABC).
In traditional cost accounting, we have a plant-wide overhead rate. It is calculated using machine hours or labor hours. This will give us one rate that we can allocate throughout the year. Due to this simplicity, traditional costing is easier to implement.
In traditional costing, only the product cost is allocated. It only considers manufacturing overhead. Selling, general, and administrative (SG&A) costs are not considered in traditional costing. Traditional costing can be used to calculate the cost of goods sold and it is an accepted method by auditors. But there are disadvantages to the traditional costing method – for example, it only factors in one rate. Let’s take a scenario where one product is causing issues and requires a lot more customer support hours. In that case, we are understating our cost because we did not allocate the cost to that product line.
Cost accounting is all about making quality decisions, and ABC allocation is the method that will provide us with accurate costs. ABC will compute the rate for each cost pool as that activity occurs. Once we have the accurate cost, we can make the best decision on whether to keep the product line, drop it, or optimize certain processes.
Having covered the advantages of ABC, let’s now look at it in detail.
What is ABC allocation?
ABC in cost accounting is a method of accurately spreading the cost to the relevant business activities so that overhead costs can be calculated in proportion to the rate of the activities.
Let’s understand the key definitions first before we look at an example of ABC allocation:
- Product: This is an item or a service that a business sells to its customers. These products can be physical or virtual. Backpacks, suitcases, furniture, and computers are examples of physical products, while email, credit card processing, and appointment services are examples of virtual products.
- Overhead: This is an expense that a business must pay so that the business can continue operating. Rent, electricity, admin, and customer support are examples of overhead expenses.
- Cost pool: These are business process activities that are grouped into a pool for cost allocation. Each organization defines the most relevant cost pools to their business needs. Assembly, order processing, marketing, and customer support are examples of cost pools.
- Measure: This is a driver for the cost pool. The most common example of a measure is the number of units, number of customers, or number of orders.
- Activity rate: This is calculated by dividing cost by activity. It is the per-unit cost of the activity – for example, the assembly cost of 500,000/20,000 units = $25 per unit activity rate.
To better understand this, here is an example of World Travel Inc., which manufactures travel backpacks and suitcases. World Travel Inc. has an overhead expense of $1,000,000 that needs to be allocated to these product lines. The line manager has identified the following cost pools, measures, and weights:
|
Cost Pool |
Measure |
Weight |
|
Assembly |
# of Units |
50% |
|
Order Processing |
# of Orders |
10% |
|
Customer Support |
# of Customers |
25% |
|
Other |
N/A |
15% |
Now, we can calculate the ABC for the $1,000,000 overhead cost as follows:
|
Cost Pool |
Cost |
Measure |
Activity Rate |
|
Assembly |
$500,000 |
20,000 Units |
$25 per Unit |
|
Order Processing |
$100,000 |
2,000 Orders |
$50 per Order |
|
Customer Support |
$250,000 |
5,000 Customers |
$50 per Customer |
|
Other |
$150,000 |
N/A |
N/A |
We can use the activity rate to calculate the cost of backpacks and suitcases:
|
Backpacks |
Suitcases |
|||
|
Assembly |
10,000 Units |
$250,000 |
10,000 Units |
$250,000 |
|
Order Processing |
700 Orders |
$35,000 |
300 Orders |
$15,000 |
|
Customer Support |
150 Customers |
$7,500 |
50 Customers |
$2,500 |
As you can see in the preceding calculation, for 10,000 units of orders for two different product lines, the order processing and customer support costs are different. This is the exact problem that ABC solves. In conclusion, the main driver for implementing ABC is that it is much more accurate than traditional costing, which takes one plant-wide overhead rate and asserts that overhead is just driven by machine hours or labor hours. ABC is the method that will give an accurate cost for the product. When we have the most accurate cost, we can make the best decision about whether to keep the product line or optimize the operations.
How do we allocate costs in Azure? We’ll explore that in the next section.
Cost allocation in Azure for FinOps
The goal of the FinOps team is to create visibility into cloud spending and enable granular cost allocation to create shared accountability of cloud spending. Proper cost allocation will help teams to see their cloud spending and the impact their action or inaction has on the bill. Spending data must be properly mapped to the organizational hierarchy by cost center, applications, and business units by using the account hierarchy and resource tagging.
Cost allocation using the account, management group, and subscriptions hierarchy
The billing account, department, and account hierarchy for an Enterprise Agreement offer type allows you to organize and allocate your costs at the highest level. In the following example, the organization has created two departments (Marketing and HR) under Billing Account. Invoices are generated at the Billing Account level. The Department part groups the accounts (that contain subscriptions) to organize costs into a logical grouping. The EA admin can configure the spending quota for each department. This is an excellent place to implement a budget. The enterprise administrator and the department administrator will receive notifications once the quota has reached 50%, 75%, 90%, and 100%.
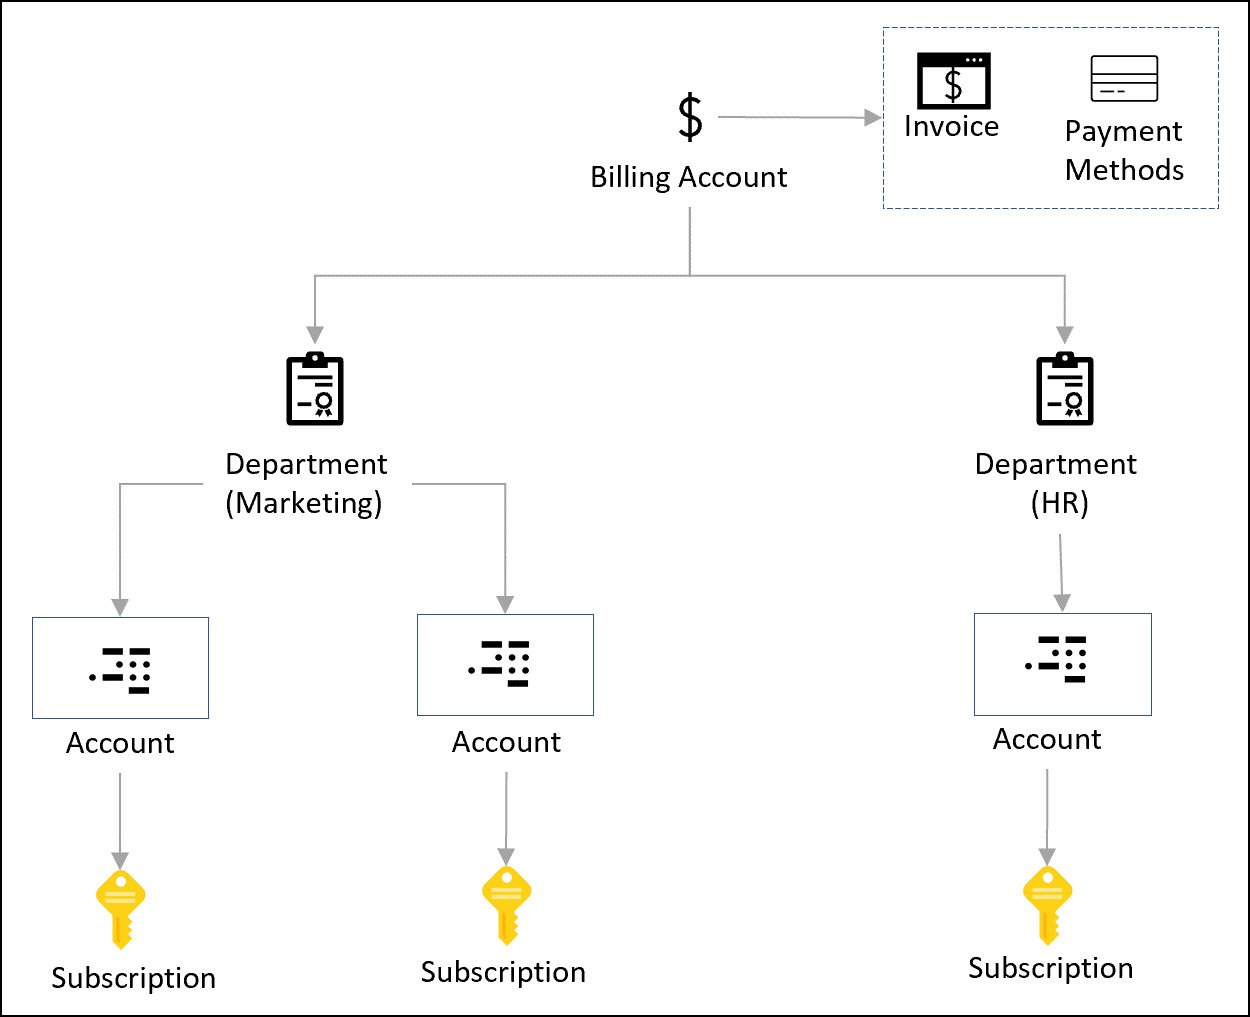
Figure 1.9 – Azure Enterprise Agreement’s department hierarchy
While you can use Enterprise Agreement’s Department hierarchy for cost allocation, in practice, it does not provide the granularity that the FinOps team is looking for.
Note
To learn more about the Microsoft Customer Agreement (MCA) billing hierarchy, please refer to the Microsoft documentation at https://docs.microsoft.com/en-us/azure/cost-management-billing/manage/view-all-accounts.
Here, management groups come into the picture. As you can see in Figure 1.10, we are starting from the top and moving down toward a bit more granularity. Management groups allow efficient access, policy, and compliance for hundreds of subscriptions. While they are not directly related to helping with cost allocation, the latest cost analysis scope object now includes filtering by using management groups. So, now, you can group the cost of all resources under a single management group and report it back to the business. The following is an example of a management group hierarchy that helps with cost allocation:
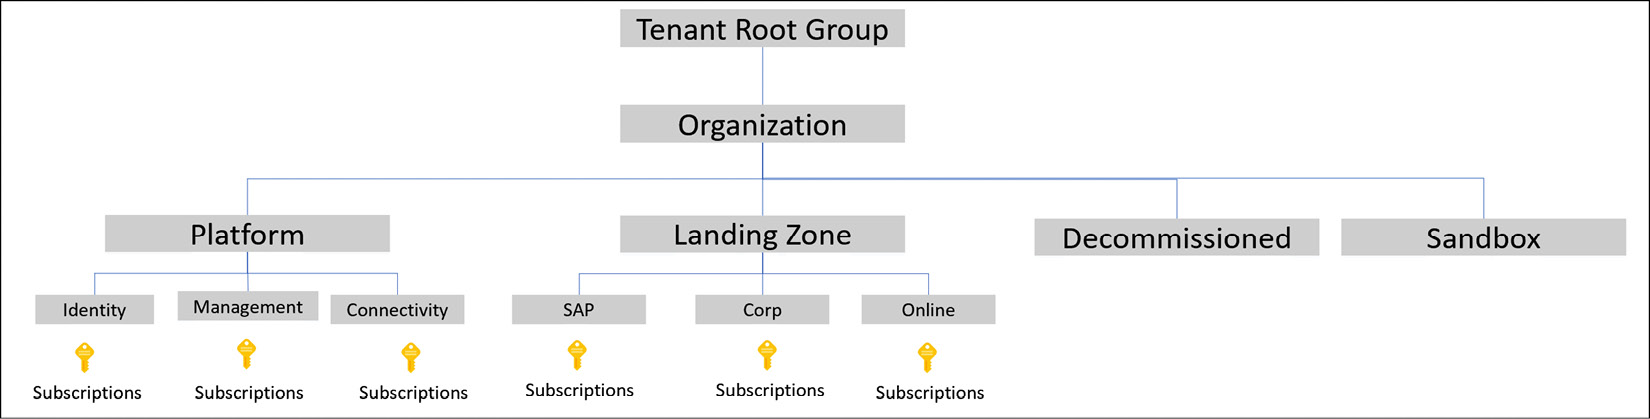
Figure 1.10 – Organizing subscriptions under management groups
In the preceding example, the first level of management group is called the Root management group. Management groups can be six levels deep. Under Root, we have Organization, and under Organization, we have Platform, Landing Zone, Decommissioned, and Sandbox management groups. Under the Platform management group, we have Identity, Management, and Connectivity. Each has a corresponding Subscriptions group.
Using this management group structure, the FinOps team can easily group the cost by a given management group. For example, to know how much the SAP workload costs, you can go to the Cost Analysis dashboard and select the scope of the SAP management group. That will include all the subscriptions under SAP and provide the total cost.
Subscriptions in Azure support tags. To allocate cost at the subscription level, you can assign tags to the subscription and group the cost by the given tag. For example, by using tags on subscriptions, you can easily allocate and get the total cost incurred by a given tag on a subscription.
Cost allocation using resources tags
Tags are essentially metadata that you can apply to Azure resources in the form of key/value pairs. For example, if you want to distinguish the cost of the development environment from the production environment for the marketing application, you can assign the Environment = Development or Environment = Production tag to all the resources in Azure.
It is important to note that each resource, resource group, and subscription can have a maximum of 50 tags. If you need more than 50 tags, you can use a JSON string in the tag value. Also, note that Azure Automation, Azure Content Delivery Network (CDN), and Azure DNS (zone and A records) only support a maximum of 15 tags.
Note
Not all resource types in Azure support tags; these resources are called untaggable. To find out whether a resource supports tags or not, refer to the Microsoft documentation at https://docs.microsoft.com/en-us/azure/azure-resource-manager/management/tag-support. Please see the case study for the strategy to allocate costs for untagged or untaggable resources.
Depending on the FinOps team’s maturity level, the following are the minimum tags that should be applied to the resources. To enforce tag coverage, you can create an Azure policy to audit or deny the resource creation if the required tags are not provided:
|
Tag Name |
Description |
|
|
|
|
|
This represents the application environment, as in the following examples:
|
|
|
This represents the department that owns the application for billing purposes, as in the following example:
|
|
|
This represents the IT owner of the application, as in the following example:
|
|
|
This represents the business owner of the application, as in the following example:
|
|
|
This represents the organization’s cost center code for this application, as in the following example:
|
There are various ways you can apply these tags to Azure resources. The most common and effective way is to embed tags in your infrastructure as code (IaC) solution (Bicep or Terraform). Alternatively, you can use the Azure portal or Azure CLI commands to list, add, update, or delete tags.
To add tags to a Terraform template for a resource group, use the following code:
resource "azurerm_resource_group" "rg-dev" {
  name     = "rg-marketing-website-dev"
  location = "eastus"
  tags = {
    appid = "141788"
    env = "dev"
    department = "marketing"
    costcenter = "10101"
    itowner = "james@corp.com"
    businessowner = "charles@corp.com"
  }
}
To manage tags with PowerShell and Azure CLI commands, please check out the Microsoft documentation at https://docs.microsoft.com/en-us/azure/azure-resource-manager/management/tag-resources.
In the next section, we will look at how to view the allocated cost by tag using Azure’s cost analysis tool.
Exploring cost analysis in the Azure portal
Microsoft Azure has the most advanced, free, in-portal capability to analyze the cost of your workload. Let’s look at the Cost Management + Billing feature in the portal. You will learn how to do the following:
- Identify the offer type for your subscription(s)
- View the accumulated and forecasted cost
- View the cost grouped by service
- View the cost grouped by management group
- View the cost grouped by tag
- View the create, save, and share custom cost analysis views
Let’s look at how to accomplish these tasks using the Azure Cost Management + Billing feature in the portal.
Identifying the offer type for your subscription(s)
When you purchase or create a Microsoft Azure subscription, an Azure offer governs the payment terms and conditions, service rate, exclusions, payment options, cancellation policy, and service agreement between your organization and Microsoft. Here is how you can find out the offer type in the Azure portal:
- Open the Microsoft Edge browser.
- Navigate to https://portal.azure.com/#view/Microsoft_Azure_CostManagement/Menu/~/overview and then click on Cost Analysis.
- Click on Properties, under the Settings section. The Type field indicates your subscription’s offer type. The following screenshot shows that the subscription has an MCA offer type.
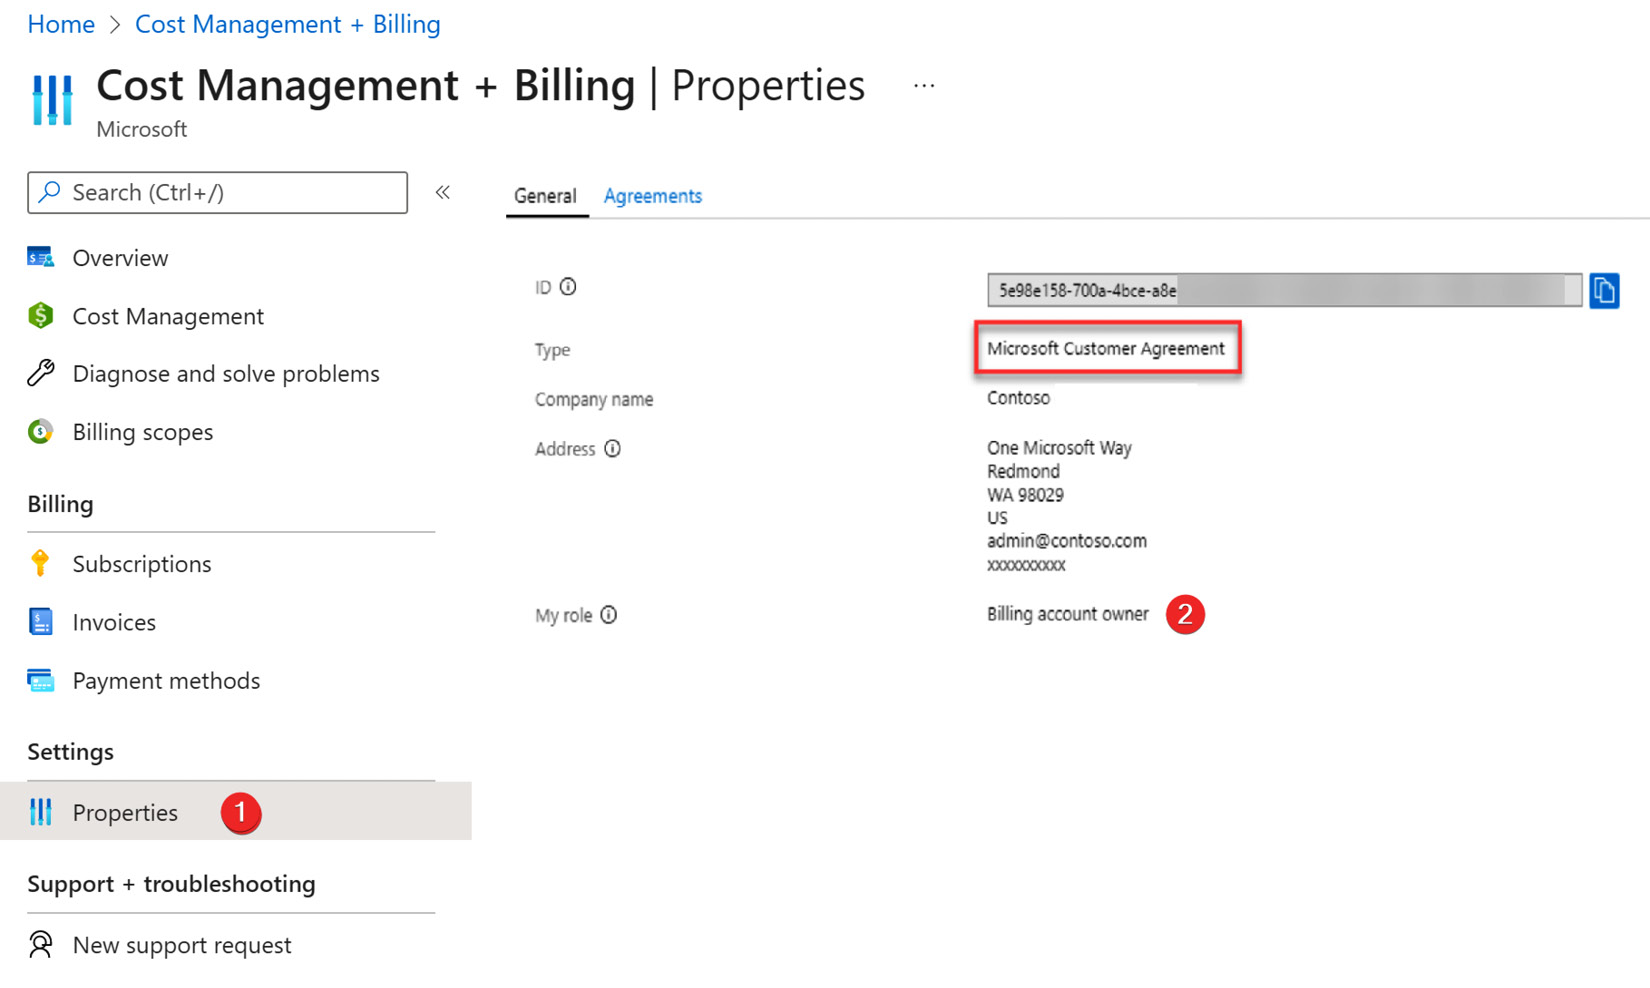
Figure 1.11 – Azure Cost Management + Billing
There are many different types of offers available in Azure. To view the full list and details about each offer, please check out https://azure.microsoft.com/en-us/support/legal/offer-details/.
Accumulated and forecasted cost
One of the most common requests from the finance and procurement team is to provide accumulated and forecasted costs for the workloads running in Azure. To accomplish this request, you can use the built-in accumulated cost view. Furthermore, you can share the view directly with the finance and procurement team or export the data in PNG, Excel, or CSV format for further analysis. The forecasted cost is based on your historical resource usage and shows a prediction of your estimated cost for up to a year.
Open Cost Management + Billing in the Azure portal and then click on Cost Analysis. The default Cost Analysis view will display actual and forecasted costs.
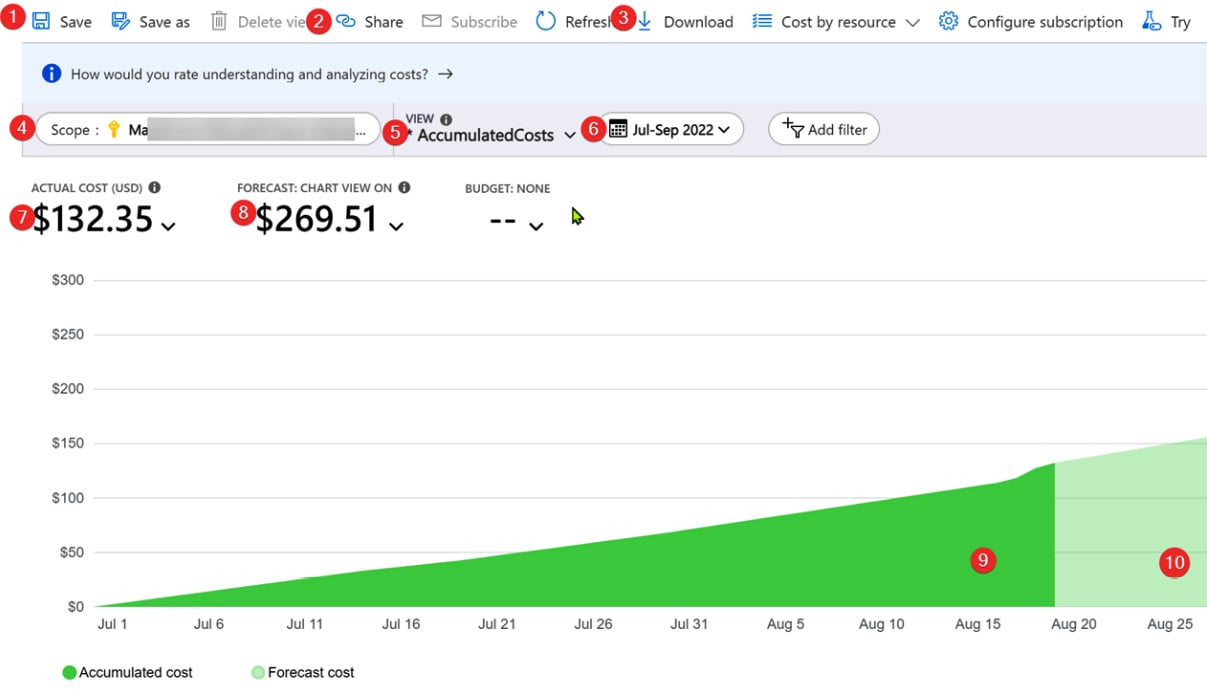
Figure 1.12 – The Azure Cost Analysis feature
Since this is the first time we are looking at Cost Management + Billing, let’s get familiar with its key features:
- You can create many different views with customizations such as date ranges, scope, filter by service or tag, group by location or resource, and so on. Then, using the Save button at the top, you can create a new customized view.
- To share the view directly, use the Share button. It provides a direct URL to the cost management view. Remember that appropriate RBAC permissions will be required for the viewer to access the report.
- Using the Download button, you can download the image or data (as a CSV or Excel file) and share it with others.
- The Scope filter allows you to restrict the cost analysis to a subscription or management group.
- The VIEW dropdown shows built-in views such as accumulated cost, daily cost, cost by service, and any custom views that you may have saved earlier.
- The date range filter provides options to view your costs daily, monthly, quarterly, or yearly, or select a custom date range.
- The ACTUAL COST (USD) option shows the total cost. For Enterprise Agreement accounts, this includes all usage, reservations, and marketplace purchases.
- The FORECAST: CHART VIEW ON option shows the predicted cost based on your usage in the past.
- The dark color shows your accumulated cost.
- The light color shows your forecasted cost.
Now, you can provide the actual resource cost by selecting the right scope and date range.
We will take a deeper look at forecasting cost in Chapter 3, Forecasting the Future Spend.
Cost grouped by service
In this task, we will drill down the cost to the service level to better understand the parts of your infrastructure that cost more. This view helps you understand the primary cost drivers and enables you to adjust the service usage to control the cost:
- Open Cost Management + Billing in the Azure portal and then click on Cost Analysis.
- Change the view to CostByService and select the appropriate date range.
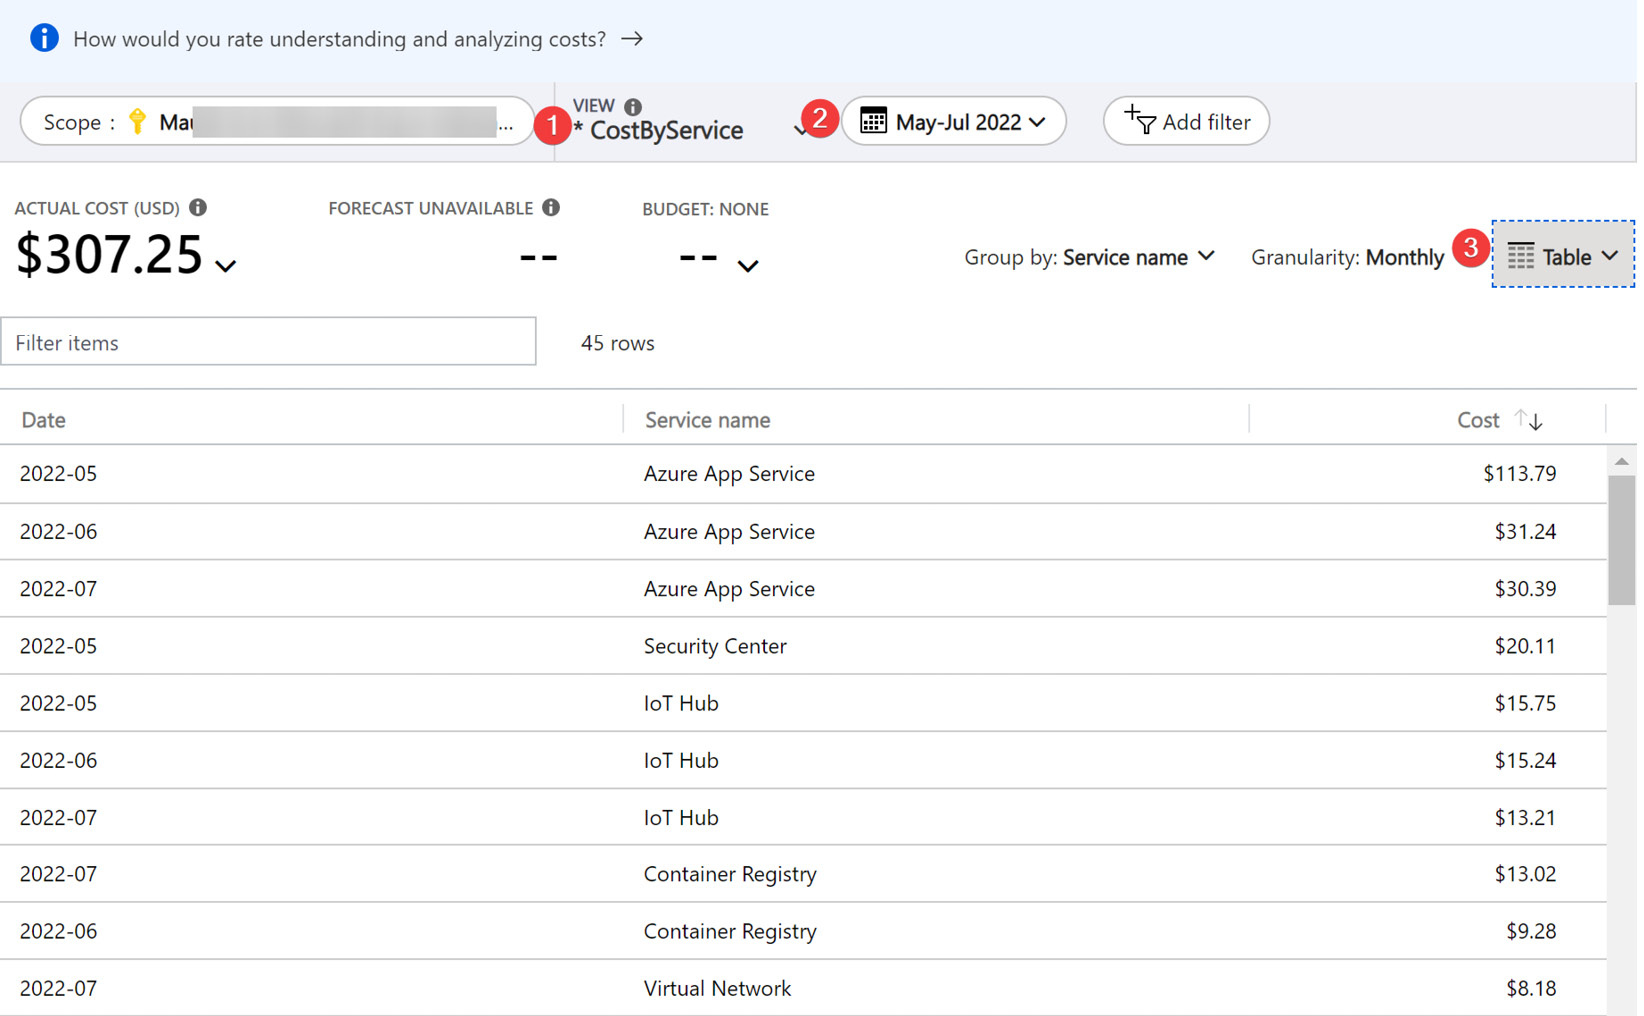
Figure 1.13 – Cost grouped by services
- Set the view to Table to see the data in table format.
Often, you will want to see the networking (virtual network, bandwidth, and so on) versus compute versus storage cost. This view provides all these details and enables you to create custom reports by exporting data into Excel.
Cost grouped by management group
Management groups in Azure provide you with an efficient way to manage resources, access, policies, and compliance by logically grouping the subscriptions. The management group hierarchy has also extended to Cost Management + Billing. Now, the cost management scope filter supports management group-based filtering. Let’s look at an example. The engineering vice president wants to know how much money we are spending to host corporate intranet applications versus customer-facing online business applications to calculate the overhead cost. To provide this data, follow these steps:
- Open Cost Management + Billing in the Azure portal and then click on Cost analysis.
- Change the Scope filter to -corp management group under the landing zone. This will provide costs for all the subscriptions hosting internal corporate applications.
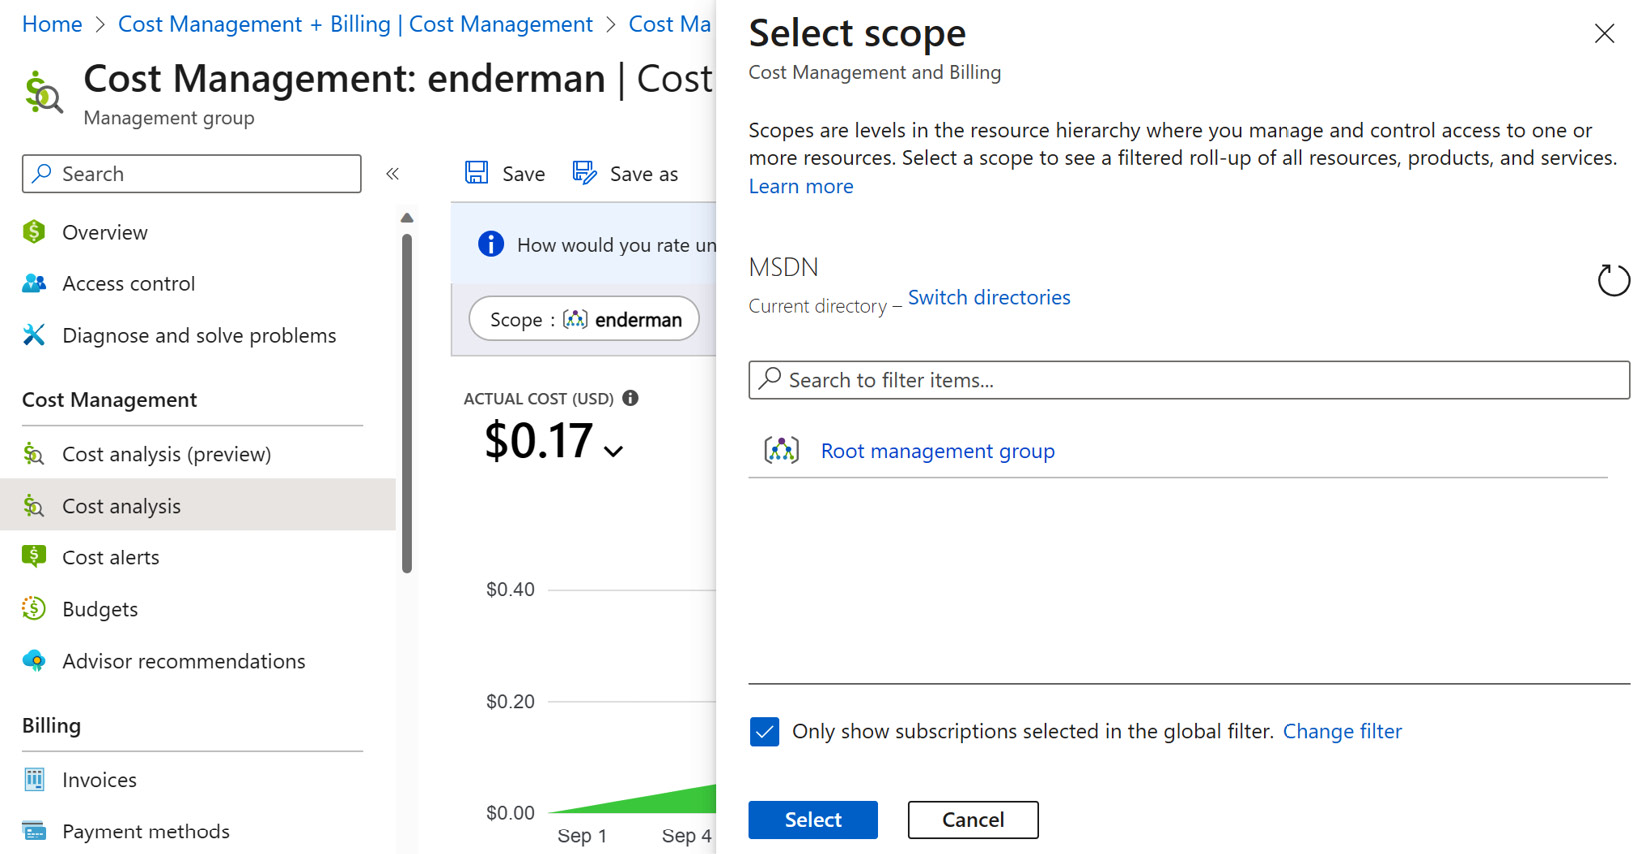
Figure 1.14 – Root management group
- To provide the cost for online business-facing applications, change the scope to the online management group under the landing zone.
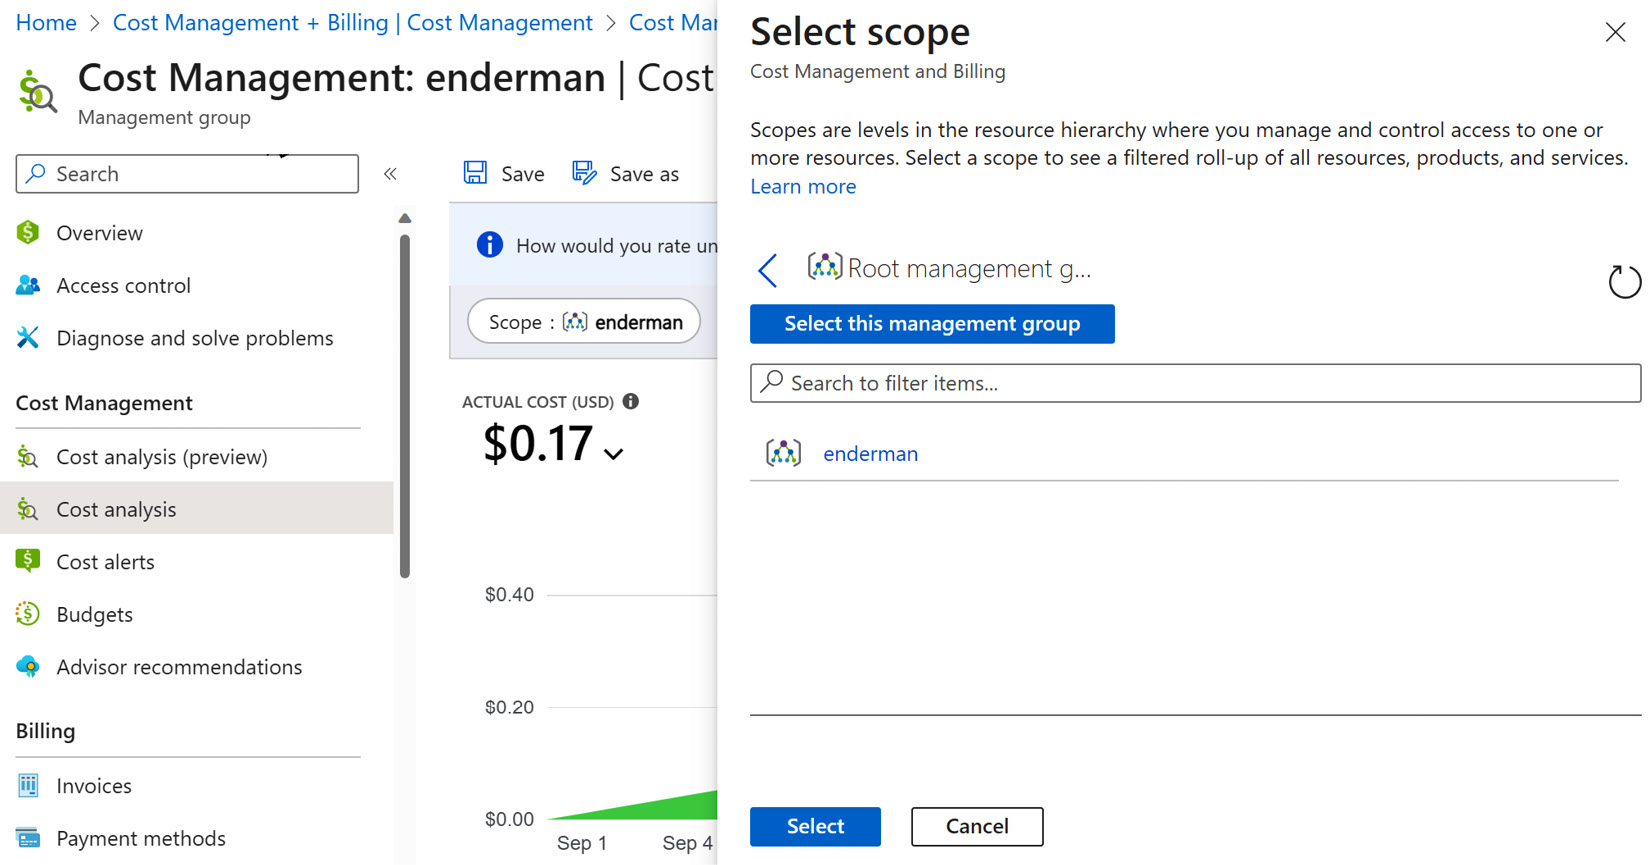
Figure 1.15 – Child management group
Please note that the aforementioned steps assume you have organized your subscriptions into management groups according to the Microsoft WAF guidance. More details are available at https://docs.microsoft.com/en-us/learn/modules/enterprise-scale-introduction/3-enterprise-scale-architecture-approach.
Cost grouped by tag
As you have seen previously, in Azure, you can use resource tags to allocate costs. After careful planning, your team has set up appropriate tags for the workload. In this example, the env:dev or env:prod tag has been applied to each resource in the dev and prod subscriptions for the marketing website’s workload. Now, for the annual budget planning, the finance team is asking you to provide costs for the dev and production environments. Here is how you can accomplish this task:
- Open Cost Management + Billing in the Azure portal and then click on Cost Analysis.
- Click on the Group by dropdown, then select Tag as a filter. Next, select a given tag to group by the cost. In this case, I have selected the env tag, which contains values such as dev and prod.
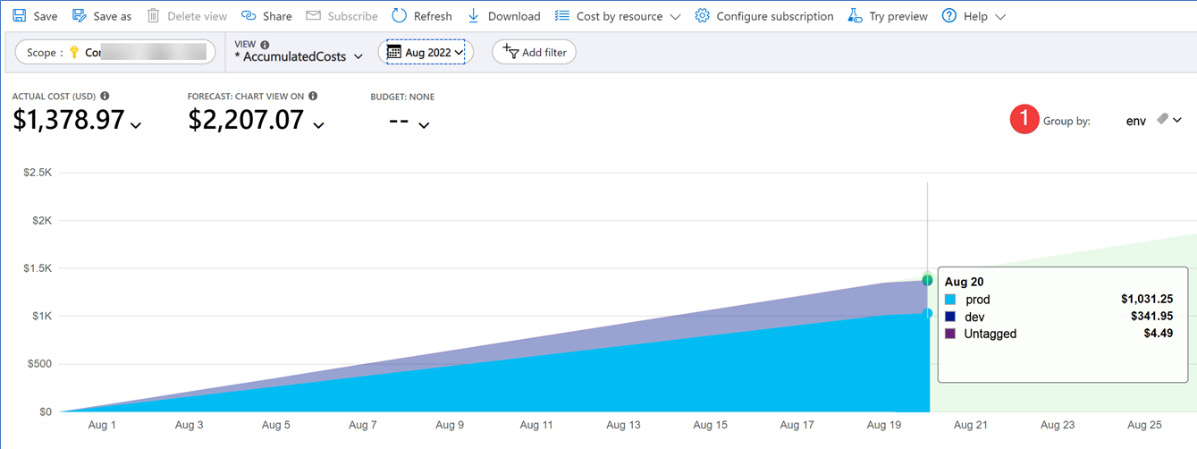
Figure 1.16 – Cost grouped by the env tag
Note that when you group the cost by tag, you will see the Untagged category. This is because there are untagged resources in your subscription. Later, we will discuss how to deal with untagged and untaggable resources since, practically, it is not possible to tag 100% of resources all the time.
Creating, saving, and sharing custom cost analysis views
Finally, you want to create custom views and share them with the FinOps team to standardize the cost showback across teams. You can create private views that only you can see, as well as shared views. Shared views are accessible to anyone who has cost management access. To edit or delete a shared view, you will need cost management contributor access.
The finance team is asking for a standardized report that shows quarterly spending by service in the Azure US West 2 region for showback purposes. This is how you can accomplish the task:
- Open Cost Management + Billing in the Azure portal and then click on Cost Analysis.
- Click on the VIEW dropdown and select CostByService.
- Change Time Range to This Quarter.
- Click on Add filter, then select Location from the drop-down list. For Value, select US West 2. For Chart Type, select Column (stacked).
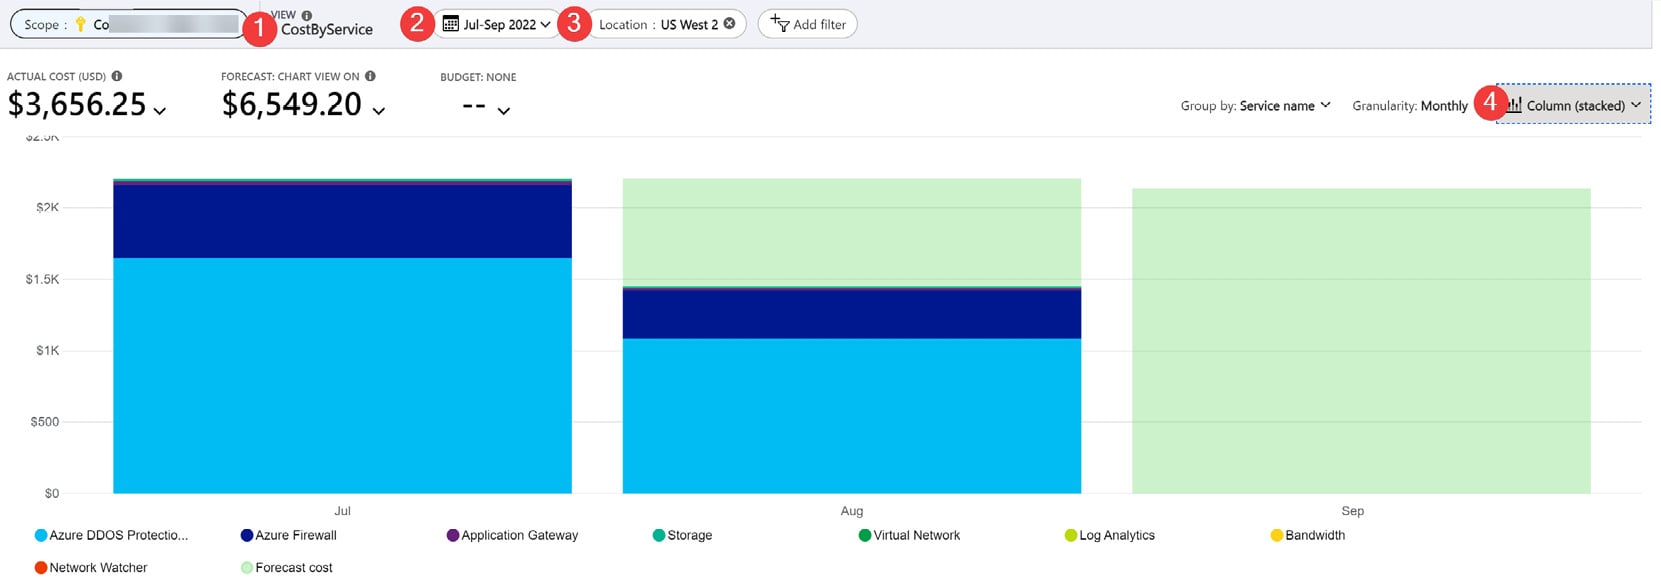
Figure 1.17 – Cost by services custom view
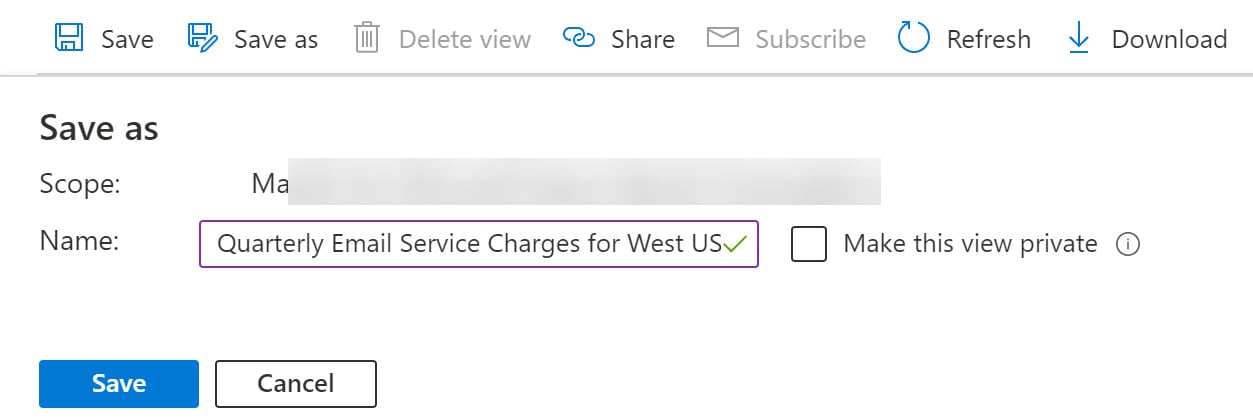
Figure 1.18 – Save the custom dashboard
- To share the view via a direct URL, click on Share.
The shared views will then appear under the VIEW dropdown of the Cost Analysis page. That concludes this chapter. Let’s recap what we’ve learned so far.
Summary
We have covered lots of things in this chapter. We started by introducing native Azure tools and then looked at the Microsoft WAF Cost Optimization assessment. The team collaboratively works to complete the assessment and establish the baseline score. Then, we discussed traditional cost allocation and ABC allocation from a cost accounting point of view. Taking that concept further, we used billing accounts, management groups, subscriptions, and resource tags to allocate the cost for a workload running in Azure. By using the Cost Analysis feature of Cost Management + Billing in Azure, we looked at various scenarios and how to effectively use the tool to accomplish the tasks given by the finance and procurement teams.
In the next chapter, we will look at benchmarking the current cloud spending and how to establish a budget for a workload, department, or business unit.