Eclipse is a highly modular application, consisting of hundreds of plug-ins, and can be extended by installing additional plug-ins. Plug-ins are developed and debugged with the Plug-in Development Environment (PDE).
In this chapter, we shall:
Set up an Eclipse environment for performing plug-in development
Create a plug-in with the new plug-in wizard
Launch a new Eclipse instance with the plug-in enabled
Debug the Eclipse plug-in
Developing plug-ins requires an Eclipse development environment. This book has been developed and tested on Juno (Eclipse 4.2) Kepler (4.3). Use the most recent version available.
Eclipse plug-ins are generally written in Java. Although it's possible to use other JVM-based languages (such as Groovy or Scala), this book will use the Java language.
There are several different packages of Eclipse available from the downloads page, each of which contains a different combination of plug-ins. This book has been tested with:
Eclipse SDK from http://download.eclipse.org/eclipse/downloads/
Eclipse Classic and Eclipse Standard from http://www.eclipse.org/downloads/
These contain the necessary Plug-in Development Environment (PDE) feature as well as the source code, the help documentation, and other useful features. (The RCP and RAP package should not be used, as it will cause problems with exercises in the Chapter 7, Understanding the Eclipse 4 Model.)
It is also possible to install the Eclipse PDE feature into an existing Eclipse instance. To do this, go to the Help menu and select Install New Software, followed by choosing the General Purpose Tools category from the update site. The Eclipse Plug-in Development Environment feature contains everything needed to create a new plug-in.
Eclipse is a Java-based application, which needs Java installed. Eclipse is distributed as a compressed archive and doesn't require an explicit installation step.
To obtain Java, go to http://java.com and follow the instructions to download and install Java. Note that Java comes in two flavors; a 32-bit install and a 64-bit install. If the running OS is a 32-bit, install the 32-bit JDK; alternatively, if the running OS is 64-bit, install the 64-bit JDK.
Running
java -versionshould give output like so:java version "1.7.0_09" Java(TM) SE Runtime Environment (build 1.7.0_09-b05) Java HotSpot(TM) 64-Bit Server VM (build 23.5-b02, mixed mode)
Go to http://www.eclipse.org/downloads/ and select the Eclipse Classic or Eclipse Standard distribution.
Download the one which matches the installed JDK. Running
java -versionshould report either:If it's a 32-bit JDK:
Java HotSpot(TM) Client VMIf it's a 64-bit JDK:
Java HotSpot(TM) 64-Bit Server VM
To install Eclipse, download and extract the contents to a suitable location. Eclipse is shipped as an archive, and needs no administrator privileges. Do not run it from a networked drive as this will cause performance problems.
Note that Eclipse needs to write to the folder from which it is extracted, so it's normal that the contents are writable afterwards. Generally, installing into
/ApplicationsorC:\Program Files, while being logged in with administrator account, is not recommended.Run Eclipse by double-clicking on the Eclipse icon, or by running
eclipse.exe(Windows),eclipse(Linux), orEclipse.app(OS X).Upon startup, the splash screen should be shown:

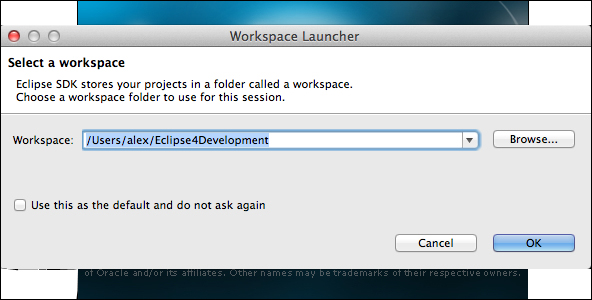
Choose a workspace, which is the location in which projects are be stored, and click on OK:
-
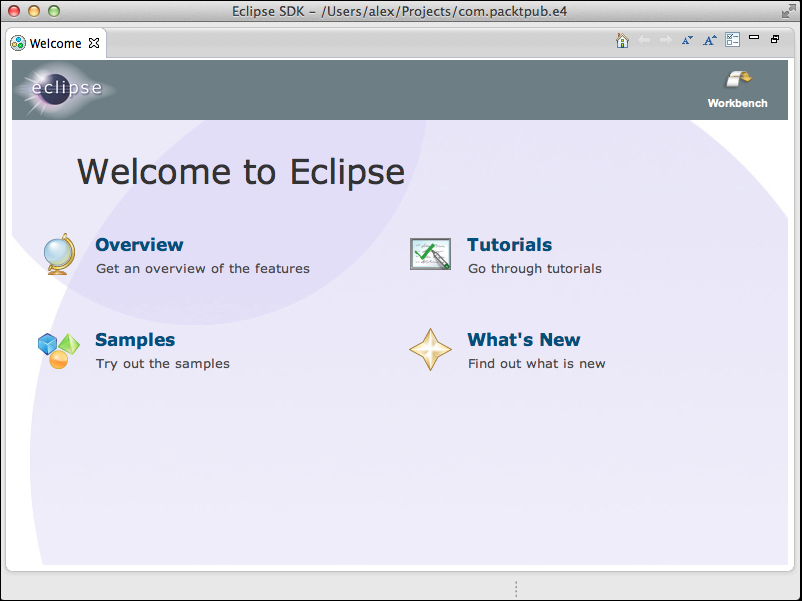
Close the welcome screen by clicking on the cross icon
 in the tab next to the Welcome text. The welcome screen can be re-opened by navigating to Help | Welcome:
Eclipse needs Java to run, and so the first step involved in installing Eclipse is ensuring that an up-to-date Java installation is available. By default, Eclipse will find a copy of Java installed on the path or from one of the standard locations. It is also possible to specify a different Java version by using the -vm command-line argument.
If the splash screen doesn't show up, the Eclipse version may be incompatible with the JDK (for example, a 64-bit JDK with a 32-bit Eclipse, or vice-versa). Common error messages shown at the launcher may include Unable to find companion launcher or a cryptic message about being unable to find an SWT library.
On Windows, there is an additional eclipsec.exe launcher, which allows log messages printed to the console to be seen. This is sometimes useful if Eclipse fails to load and no other message is displayed. Other operating systems can use the eclipse command. Both eclipse.exe and eclipse support the -consolelog argument, which can display more diagnostic information about problems while launching Eclipse.
The Eclipse workspace is a directory used for two purposes: as the default project location, and to hold the .metadata directory containing Eclipse settings, preferences, and other runtime information. The Eclipse runtime log is stored in the .metadata/.log file.
The workspace chooser dialog has an option to set the chosen value as the default workspace. It can be changed within Eclipse by navigating to File | Switch Workspace. It can also be overridden by specifying a different workspace location with the -data command-line argument.
Finally, the welcome screen is useful for first-time users, but is worth closing (rather than minimizing) once Eclipse has started.
In the Plug-in Development Environment (PDE), every plug-in has its own individual project. A plug-in project is typically created with the New Project wizard, although it is possible to upgrade an existing Java project to a plug-in project by adding the PDE nature and the required files (by navigating to Configure | Convert to plug-in project).
To create a Hello World plugin, navigate to File | New | Project:

The project types shown may be different from this list, but should include Plug-in Project with Eclipse Classic. If nothing is shown under the File | New menu, navigate to Window | Open Perspective | Other | Plug-in Development first; the entries should then be seen under the File | New menu.
Choose Plug-in Project and click on Next. Fill in the dialog as follows:
Project name:
com.packtpub.e4.hello.uiSelect the checkbox for Use default location
Select the checkbox for Create a Java project
Target Eclipse Version:
3.5 or greater
Click on Next again, and fill in the plug-in properties:
ID:
com.packtpub.e4.hello.uiVersion:
1.0.0.qualifierName:
HelloVendor:
PacktPubExecution Environment: Use the default (for example: JavaSE-1.6 or JavaSE-1.7)
Select the checkbox for Generate an Activator
Activator:
com.packtpub.e4.hello.ui.ActivatorSelect the checkbox for This plug-in will make contributions to the UI
Rich client application:
No
Click on Next and a set of templates will be provided:
Select the checkbox for Create a plug-in using one of the templates
Choose the Hello World Command template
Click on Next to customize the sample, including:
The Java package name, which defaults to the project's name
The handler class name, which is the code that gets invoked for the action
The message box text, which is the message supplied
Finally, click on Finish and the project will be generated.
If a dialog asks, click on Yes to show the plug-in development perspective.
Creating a plug-in project is the first step towards creating a plug-in for Eclipse. The New Plug-in Project wizard was used with one of the sample templates to create a project.
Plug-ins are typically named in reverse domain name format, so these examples will be prefixed with com.packtpub.e4. This helps to distinguish between many plug-ins; the stock Eclipse SDK comes with more than 440 individual plug-ins, for example, the Eclipse-developed ones start with org.eclipse.
Note
Conventionally, plug-ins which create additions to (or require) the use of the UI have .ui. in the name. This helps to distinguish from those that don't, which can often be used headlessly. Of the 440+ plug-ins that make up the Eclipse SDK, 120 of those are UI related and the rest are headless.
The project contains a number of files which are automatically generated, based on the content filled in the wizard. The key files in an Eclipse plug-in are:
META-INF/MANIFEST.MF: The OSGi manifest describes the plug-in's dependencies, version, and name. Double-clicking it will open a custom editor, which shows the information entered in the wizards; or it can be opened in a standard text editor.The Manifest follows standard Java conventions; continuations are represented by a new line followed by a single space character, and the file must end with a new line. (For example, the maximum line length is 72 characters, although many ignore this.)
plugin.xml: Theplugin.xmlfile declares what extensions this plug-in provides to the Eclipse runtime. Not all plug-ins need aplugin.xmlfile; headless (non-UI) plug-ins often don't need to have one. Extension points will be covered in more detail later, but the sample project creates an extension for the commands, handlers, bindings, and menus extension points. (If the older Hello World template was chosen, present on 3.7 and older, only theactionSetsextension will be used.)Text labels for the commands, actions, or menus are represented declaratively in the
plugin.xmlfile, rather than programmatically; this allows Eclipse to show the menu before needing to load or execute any code.Note
This is one of the reasons Eclipse starts so quickly; by not needing to load or execute classes, it can scale by showing what's needed at the time, and then load the class on demand when the user invokes the action. Java Swing's Actions provides labels and tool tips programmatically, which can result in a slower initialization of the user interface.
build.properties: This file is used by PDE at development time and at build time. Generally it can be ignored, but if resources are added that need to be made available to the plug-in (such as images, properties files, HTML content, and so on), an entry must be added here as otherwise it won't be found. Generally, the easiest way to do this is by going to the Build tab of thebuild.propertiesfile, which will give a tree-like view of the project's contents.
This file is an archaic hangover from the days of Ant builds, and is generally useless when using more up-to-date builds such as Maven Tycho, which will be covered in Chapter 10, Automated Builds with Tycho.
Eclipse can launch a new Eclipse application by clicking on the Run button, or via the Run menu.
Select the plug-in project in the workspace.
-
Click on the Run button
 to launch the project. The first time this happens, a dialog will be shown; subsequent launches will remember the previous type:
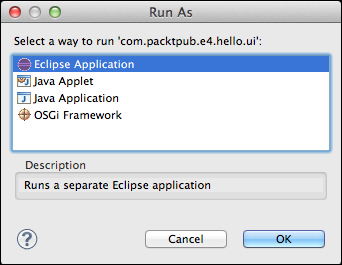
Choose the Eclipse Application type and click on OK, and a new Eclipse instance will be launched.
Close the welcome page in the launched application, if shown.
Click on the Hello World icon in the menu bar, or navigate to Sample Menu | Sample Command, and the dialog box created via the wizard will be shown:

Quit the test Eclipse instance by closing the window, or via the usual keyboard shortcuts or menus (Cmd + Q on OS X, Alt + F4 on Windows).
When clicking Run  in the toolbar (or via the Run | Run As | Eclipse Application menu) a launch configuration is created, which includes any plug-ins open in the workspace. A second copy of Eclipse—with its own temporary workspace—will enable the plug-in to be tested and verified so that it works as expected.
The Run operation is intelligent, in that it launches an application based on what is selected in the workspace. If a plug-in is selected, it will offer the opportunity to run as an Eclipse application; if a Java project with a class with a main method, it will run it as a standard Java application; and if it has tests then it will offer to run the test launcher instead.
However, the Run operation can also be counter-intuitive; if clicked a second time, and in a different project context, something other than the expected launch might be run.
A list of the available launch configurations can be seen by going to the Run menu, or by going to the drop-down list to the right of the Run icon. The Run | Run Configurations menu shows all the available types, including any previously run:
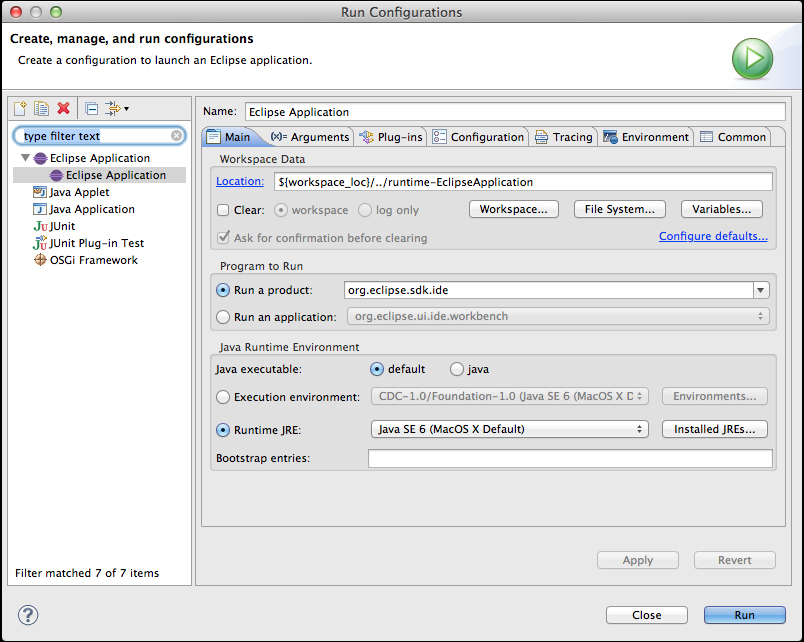
By default, the runtime workspace is kept between runs. The launch configuration for an Eclipse application has options that can be customized; in the previous screenshot, the Workspace Data section in the Main tab shows where the runtime workspace is stored, and an option is shown that allows the workspace to be cleared (with or without confirmation) between runs.
Launch configurations can be deleted by clicking on the red Delete icon  on the top-left, and new launch configurations can be created by clicking on the New icon
  . Each launch configuration has a type:
Eclipse Application
Java Applet
Java Application
JUnit
JUnit Plug-in Test
OSGi Framework
The launch configuration can be thought of as a precanned script, which can launch different types of programs. Additional tabs are used to customize the launch, such as the environment variables, system properties, or command-line arguments. The type of the launch configuration specifies what parameters are required, and how the launch is executed.
When a program is launched with the Run icon, changes to the project's source code do not take effect. However, as we'll see in the next section, if it's launched with the Debug icon, changes can take effect.
If the test Eclipse is hanging or otherwise unresponsive, in the host Eclipse instance the Console view (shown with the Window | View | Show View | Other | General | Console menu) can be used to stop ( ) the test Eclipse instance.
Q1. What are the two ways of terminating a launched Eclipse instance?
Q2. What are launch configurations?
Q3. How do you create and delete launch configurations?
Now that you've got the Eclipse plug-in running, try the following:
Change the message of the label and title of the dialog box to something else
Invoke the action by using the keyboard shortcut (defined in
plugin.xml)Change the tool tip of the action to a different message
Switch the action icon to a different graphic (note that if you use a different filename, remember to update
build.properties).
Since it's rare that everything works first time, it's often necessary to develop iteratively, adding progressively more functionality each time. Secondly, sometimes it's necessary to find out what's going on under the covers when trying to fix a bug, particularly if it's hard to track down exceptions such as NullPointerException.
Fortunately, Eclipse comes with excellent debugging support, which can be used for debugging both standalone Java applications as well as Eclipse plug-ins.
Debugging an Eclipse plug-in is almost the same as running an Eclipse plug-in, except that breakpoints can be used, and the state of the program can be updated, variables, and minor changes to the code can be done. Rather than debugging plug-ins individually, the entire Eclipse launch configuration is started in debug mode. That way, all the plug-ins can be debugged at the same time.
Although run mode is slightly faster, the added flexibility of being able to make changes makes debug mode much more attractive to use as a default.
Start the test Eclipse, by navigating to the Debug | Debug As | Eclipse Application menu, or by clicking on Debug ( ) in the toolbar.
-
Click on the Hello World icon
 in the test Eclipse to display the dialog, as before, and click on OK to dismiss it.
In the host Eclipse, open the
SampleHandlerclass and go to theexecute()method.-
Add a breakpoint by double-clicking in the vertical ruler (the gray/blue bar on the left of the editor), or by pressing Ctrl + Shift + B (or Cmd + Shift + B on OS X). A blue dot
 representing the breakpoint will appear in the ruler:

-
Click on the Hello World icon
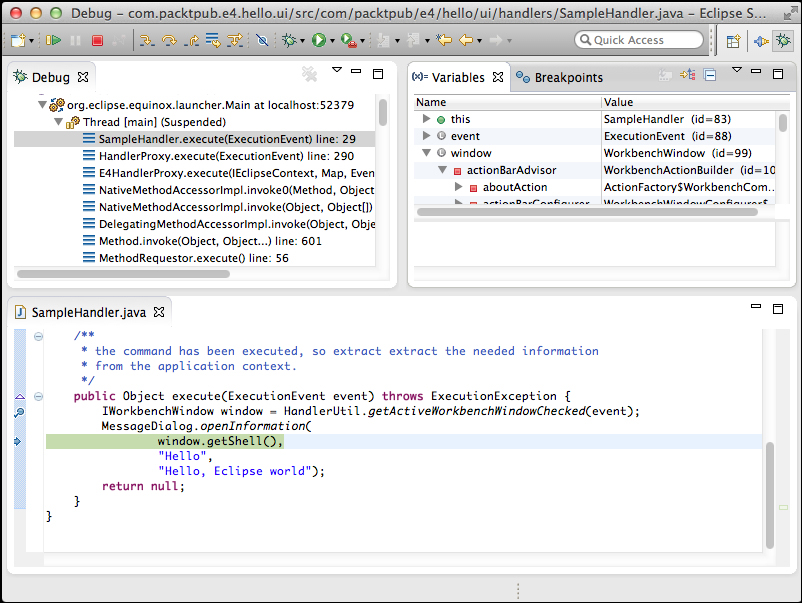
 in the test Eclipse to display the dialog, and the debugger will pause the thread at the breakpoint in the host Eclipse:

On the top-right, variables that are active in the line of code are shown. In this case, it's just the implicit variables (via
this), any local variables (none, yet) as well as the parameter (in this case,event).-
Click on Step Over
 or press F6, and window will be added to the list of available variables:
-
When ready to continue, click on Resume
 or press F8 to keep running.
The built-in Eclipse debugger was used to launch Eclipse in debug mode. By triggering an action which led to a breakpoint, the debugger was revealed allowing the local variables to be introspected.
When in the debugger, there are several options available for stepping through the code:
-
Step Over
 – allows stepping over line-by-line in the method
-
Step Into
 – follow the method calls recursively as execution unfolds
-
Step Return
 – jump to the end of a method
-
Drop to Frame
 – return to a stack frame in the thread to re-run an operation
When an Eclipse instance is launched in run mode, changes made to the source code aren't reflected in the running instance. However, debug mode allows changes made to the source to be reflected in the running test Eclipse instance.
-
Launch the test Eclipse in debug mode by clicking on the Debug
 icon.
icon.
-
Click on the Hello World icon
 in the test Eclipse to display the dialog, as before, and click on OK to dismiss it. It may be necessary to remove or resume the breakpoint in the host Eclipse instance to allow execution to continue.
In the host Eclipse, open the
SampleHandlerclass and go to theexecute()method.Change the title of the dialog to
Hello again, Eclipse worldand save the file. Provided that Project | Build Automatically is enabled, the change will be recompiled.Click on the Hello World icon in the test Eclipse instance again. The new message should be shown.
By default, Eclipse ships with Project | Build Automatically enabled. Whenever changes are made to Java files, they are recompiled along with their dependencies if necessary.
When a Java program is launched in run mode, it will load classes in on-demand and then keep using that definition until the JVM shuts down. Even if the classes are changed, the JVM won't notice that they have been updated, and so no differences will be seen in the running application.
However, when a Java program is launched in debug mode, whenever changes to classes are made, it will update the running JVM with the new code if possible. The limits to what can be replaced are controlled by the JVM through the JVMTI and whether, for example, the virtual machine's canUnrestrictedlyRedefineClasses() call returns true. Generally, updating an existing method and adding a new method or field will work, but changes to interfaces and super classes may not be. (Refer to http://en.wikipedia.org/wiki/Java_Virtual_Machine_Tools_Interface for more information.)
Note
The ex-Sun Hotspot JVM cannot replace classes if methods are added or interfaces are updated. Some JVMs have additional capabilities which can substitute more code on demand. With the merging of JRockit and Hotspot over time, more may be replaceable at runtime than before; for everything else, there's JRebel.
Other JVMs, such as IBM's, can deal with a wider range of replacements.
Note that there are some changes which won't be picked up; for example, new extensions added to the plugin.xml file. In order to see these changes, it is possible to start and stop the plug-in through the command-line OSGi console, or restart Eclipse inside or outside the host Eclipse to see the change.
Step filtering allows for uninteresting packages and classes to be ignored during step debugging.
Run the test Eclipse application in debug mode.
Ensure a breakpoint is set at the start of the
SampleHandlerclass'sexecute()method.Click on the Hello World icon, and the debugger should open at the first line as before.
-
Click on Step Into
 five or six times. At each point, the code will jump into the next method in the expression; first through various methods in
 HandlerUtiland then intoExecutionEvent. -
Click on Resume
 to continue.
Open Preferences, and then navigate to Java | Debug | Step Filtering.
Check the Use Step Filters option.
Click on Add Package and enter
org.eclipse.ui, followed by clicking on OK.
Click on the Hello World icon again.
-
Click on Step Into
 as before. This time, the debugger goes straight to
 getApplicationContext()in theExecution Eventclass. -
Click on the Resume icon
 to continue.
To make debugging more efficient by skipping accessors, go back into the Step Filters preference and select the Filter Simple Getters from the Step Filters preference's page.
Click on the Hello World icon again.
-
Click on Step Into
 as before.
Instead of going into the
getApplicationContext()method, execution will drop through to theExpressionContextclass'sgetVariable()method instead.
The Step Filters preferences allows uninteresting packages to be skipped, at least from the point of debugging. Typically, JVM internal classes (such as those beginning with sun or sunw) are not helpful when debugging and can easily be ignored. This also avoids debugging through the class loader, as it loads classes on demand.
Typically, it makes sense to enable all the default packages in the Step Filters dialog, as it's pretty rare to need to debug any of the JVM libraries (internal or public interfaces). This means when stepping through the code, if a common method such as List.toString() is called, debugging won't step through the internal implementation.
It also makes sense to filter out simple setters and getters (those that just set a variable, or those that just return a variable). If the method is more complex (like the getVariable() method discussed previously), it will still stop in the debugger.
Constructors and static initializers can also be specifically filtered.
Method breakpoints allow the user to see when a method is entered or exited.
Open the
SampleHandlerclass, and go to theexecute()method.Double-click in the vertical ruler at the method signature, or select Toggle Method Breakpoint from the method in one of the Outline, Package Explorer, or Members views.
The breakpoint should be shown on the line
public Object execute(...) throws ExecutionException {.Open the breakpoint properties by right-clicking on the breakpoint or via the Breakpoints view, which is shown in the debug perspective. Set the breakpoint to trigger at the method entry and method exit.
Click the Hello World icon again.
When the debugger stops at the method entry, click on the Resume icon.
When the debugger stops at the method exit, click on the Resume icon.
The breakpoint triggers at the time the method enters and subsequently when the method's return statement is reached.
Note that the exit is only triggered if the method returns normally; if an exception is raised which causes the method to return, this is not treated as a normal method exit, and so the breakpoint won't fire.
Other than the breakpoint type, there's not a significant difference between creating a breakpoint on method entry and creating one on the first statement of the method. Both give the ability to introspect the parameters and do further debugging prior to any statements in the method itself are called.
The method exit breakpoint, on the other hand, will only trigger once the return statement is about to leave the method. Thus, any expression in the method's return value will have been evaluated prior to the exit breakpoint firing. Compare and contrast this to the line breakpoint, which will wait to evaluate the argument of the return statement.
Note that Eclipse's Step Return  icon has the same effect; this will run until the method's
 return statement is about to be executed. However, to find when a method returns, using a method exit breakpoint is far faster than stopping at a specific line and then clicking on Step Return.
Breakpoints are useful, since they can be invoked on every occasion that a line of code is triggered. However, sometimes they need to break for specific actions only, such as when a particular option is set, or when a value has been incorrectly initialized. Fortunately, this can be done with conditional breakpoints.
Normally, breakpoints fire on each invocation. It is possible to configure breakpoints such that they fire when certain conditions are met.
Go to the
execute()method of theSampleHandlerclass.Clear any existing breakpoints by double-clicking them or using Delete all breakpoints from the Breakpoints view.
Add a breakpoint to the first line of the
execute()method body.Right-click on the breakpoint and select the Breakpoint Properties menu. (It can also be shown by Ctrl + double-clicking, or Cmd + double-clicking on OS X on the breakpoint icon itself.)

Set the Hit Count field to
3, and click on OK.Click on the Hello World icon button three times. On the third click, the debugger will open up at that line of code.
Open the breakpoint properties, deselect Hit Count and select the Enabled and Conditional options. Put the following code into the conditional trigger field:
((org.eclipse.swt.widgets.Event)event.trigger).stateMask == 65536
Click on the Hello World icon and the breakpoint will not fire.
Hold down Alt, click on the Hello World icon, and the debugger will open. (
65536is the value ofSWT.MOD3, which is the Alt key.)
When a breakpoint is created, it is enabled by default. A breakpoint can be temporarily disabled, which has the effect of removing it from the flow of execution. Disabled breakpoints can be trivially re-enabled on a per-breakpoint basis, or from the Breakpoints view. Quite often it's useful to have a set of breakpoints defined in the codebase, but not necessarily have them all enabled at once.
It is also possible to temporarily disable all breakpoints using the Skip All Breakpoints setting, which can be changed from the corresponding item in the Run menu (when the debug perspective is enabled), or the corresponding icon  in the Breakpoints view. When this is toggled, no breakpoints will be fired.
Conditional breakpoints must use a Boolean expression, rather than a statement or a set of statements. Sometimes this is constraining; if that's the case, having a utility class with a static method allows more complex code paths (with the caveat that all interesting data must be passed in as method arguments).
Although it's trivial to put a breakpoint in the catch block, this is merely the location where the failure was ultimately caught, not where it was caused. The place where it was caught can often be in a completely different plug-in from where it was raised, and depending on the amount of information encoded within the exception (particularly if it has been transliterated into a different exception type), it may hide the original source of the problem. Fortunately, Eclipse can handle such cases with a Java Exception breakpoint.
Introduce a bug into the
SampleHandlerclass'sexecute()method, by adding the following just before theMessageDialog.openInformation()call:window = null;
Tip
Downloading the example code
You can download the example code files for all Packt books you have purchased from your account at http://www.packtpub.com. If you purchased this book elsewhere, you can visit http://www.packtpub.com/support and register to have the files e-mailed directly to you.
Click on the Hello World icon.
Nothing will appear to happen in the target Eclipse, but in the Console view of the host Eclipse instance, the following error message should be seen:
Caused by: java.lang.NullPointerException
  at com.packtpub.e4.hello.ui.handlers.SampleHandler.execute(SampleHandler.java:30)
  at org.eclipse.ui.internal.handlers.HandlerProxy.execute(HandlerProxy.java:293)
  at org.eclipse.ui.internal.handlers.E4HandlerProxy.execute(E4HandlerProxy.java:76)
-
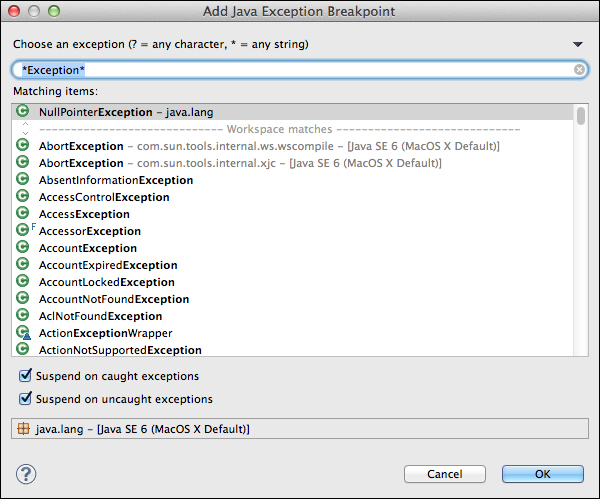
Create a Java Exception breakpoint
 in the Breakpoints view of the debug perspective. The exception dialog will be shown as follows:
Enter
NullPointerExceptioninto the search dialog and click on OK.Click on the Hello World icon and the debugger will stop at the line the exception is thrown, instead of where it is caught:
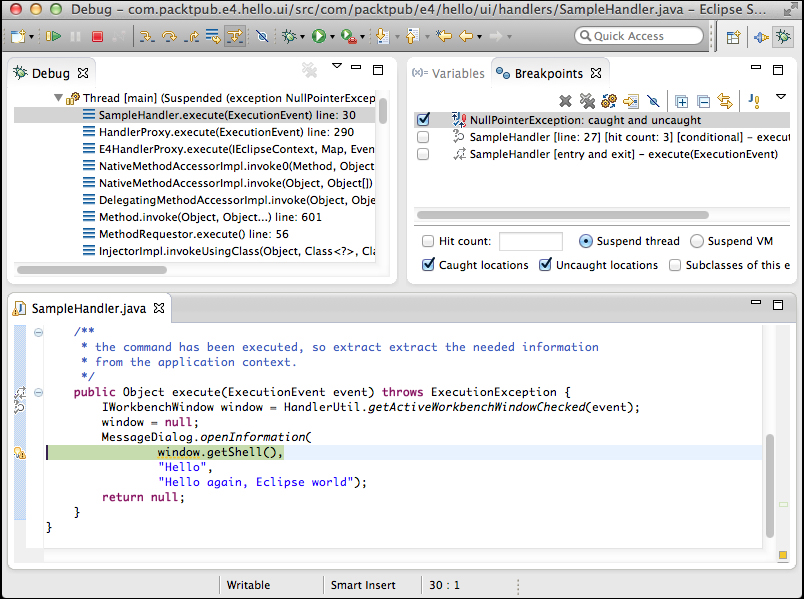
The Java Exception breakpoint stops when an exception is thrown, not when it is caught. The dialog asks for a single exception class to catch and by default, the wizard has been prefilled with any class whose name includes *Exception*. However, any name (or filter) can be typed into the search box, including abbreviations such as FNFE for FileNotFoundException. Wildcard patterns can also be used, which allows searching for Nu*Ex or *Unknown*.
By default, the exception breakpoint corresponds to instances of that specific class. This is useful (and quick) for exceptions such as NullPointerException
, but not so useful for ones with an extensive class hierarchy such as IOException. In this case, there is a checkbox visible in the Breakpoint properties window and the bottom of the Breakpoints view, which allows the selection of all subclasses of that exception, not just of the specific class itself.
There are also two other checkboxes, which say whether the debugger should stop when the exception is caught or uncaught. Both of these are selected by default; if both are deselected, the breakpoint effectively becomes disabled. Caught means that the exception is thrown in a corresponding try/catch block, and Uncaught means that the exception is thrown without a try/catch block (thus, bubbles up to the method's caller).
Finally, it's worth seeing what the Variables view can do.
Click on the Hello World icon again.
Highlight the
openInformation()call and navigate to Run | Step Into Selection.Select the
titlein the the Variables view.Modify where it says
Helloin the bottom half of the Variables view and change it toGoodbye: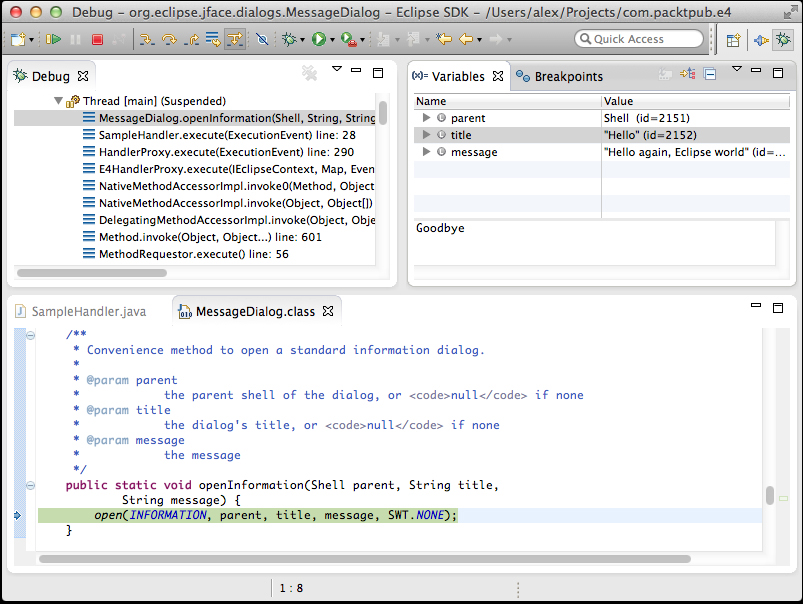
Save the value using Ctrl + S (or Cmd + S on OS X).
Click on the Resume icon and the newly updated title can be seen in the dialog.
Click on the Hello World icon again.
With the debugger stopped in the
execute()method, highlight event in the Variables view.Right-click on the value and choose Inspect (Ctrl + Shift + I or Cmd + Shift + I on an OS X) and the value is opened in the Expressions view:
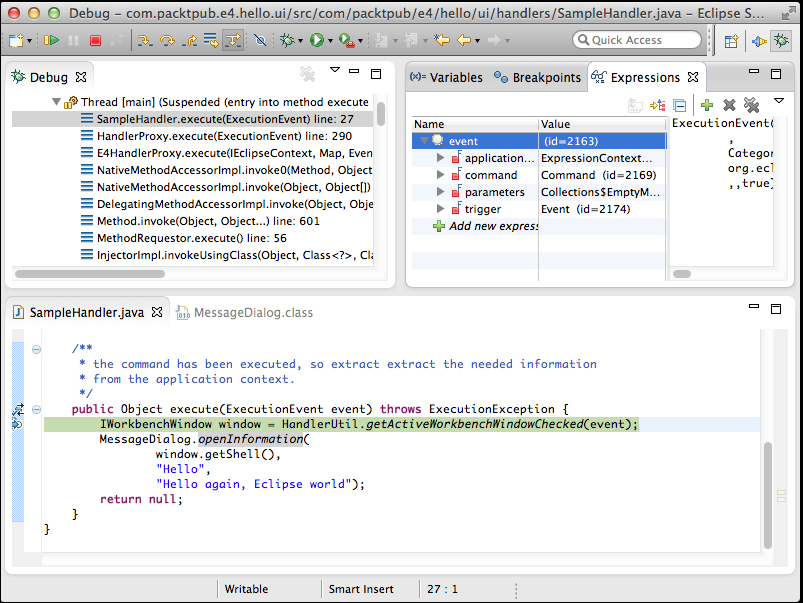
Click on the Add new expression option in the bottom of the Variables view.
Add new
java.util.Date()and the right-hand side will show the current time.Right-click on the new
java.util.Date()and choose Re-evaluate Watch Expression. The right-hand pane shows the new value.Step through the code line by line, and notice that the watch expression is reevaluated after each step.
Disable the watch expression by right-clicking on it and choosing Disable.
Step through the code line by line and the watch expression will not be updated.
The Eclipse debugger has many powerful features, and the ability to inspect (and change) the state of the program is one of the more important ones.
Watch expressions, when combined with conditional breakpoints, can be used to find out when data becomes corrupted or used to show the state of a particular object's value.
Expressions can also be evaluated based on objects in the Variables view, and the code completion is available to select methods, with the result being shown with Display.
Q1. How can an Eclipse plug-in be launched in debug mode?
Q2. How can certain packages be avoided when debugging?
Q3. What are the different types of breakpoints that can be set?
Q4. How can a loop debugged that only exhibits a bug after 256 iterations?
Q5. How can a breakpoint be set on a method when its argument is null?
Q6. What does inspecting an object do?
Q7. How can the value of an expression be calculated?
Using the conditional breakpoint to stop at a certain method is fine if the data is simple, but sometimes there needs to be more than one expression. To implement additional functionality, the breakpoint can be delegated to a breakpoint() method in a Utility class. The following steps will help you to work with breakpoints:
Create a
Utilityclass with a static methodbreakpoint(), this will return atruevalue if the breakpoint should stop andfalseotherwise:public class Utility { public static boolean breakpoint() { System.out.println("Breakpoint"); return false; } }Create a conditional breakpoint in the
execute()method, which callsUtility.breakpoint().Click on the Hello World icon again and the message will be printed to the host Eclipse's Console view. The breakpoint will not stop.
Modify the
breakpoint()method to returntrueinstead offalse. Run the action again. The debugger will stop.Modify the
breakpoint()method to take the message as an argument, along with a Boolean value that is returned to say if the breakpoint should stop.Set up a conditional breakpoint with the following code:
Utility.breakpoint(
 ((org.eclipse.swt.widgets.Event)event.trigger).stateMask
  != 0,"Breakpoint")
Modify the
breakpoint()method to take a varargsObjectarray, and use that in conjunction with the message to useString.format()for the resulting message:Utility.breakpoint( ((org.eclipse.swt.widgets.Event)event.trigger).stateMask != 0,"Breakpoint" %s %h",event, new java.util.Date().getTime()))
In this chapter, we covered how to get started with Eclipse plug-in development. From downloading the right Eclipse package (from a bewildering array of choices) to getting started with a wizard-generated plug-in, you should now have the tools to follow through with the remainder of the chapters in this book.
Specifically, we covered:
The Eclipse SDK (also known as Eclipse Classic) has the necessary Plug-in Development Environment to get you started
The plug-in creation wizard can be used to create a plug-in project, optionally using one of the example templates
Testing an Eclipse plug-in launches a second copy of Eclipse with the plug-in installed and available for use
Launching Eclipse in debug mode allows you to update code and stop execution at breakpoints defined via the editor
Now that we've learned about how to get started with Eclipse plug-ins, we're ready to look at creating plug-ins which contribute to the IDE; starting with SWT and Views, which is the topic of the next chapter.


