


D3.js is an open source JavaScript library that provides the facility for manipulating HTML documents based upon data, using JavaScript as the language for implementing the mapping of data to the documents. Hence, the name D3 (Data Driven Documents). Many consider D3.js as a data visualization library. This may be correct, but D3.JS provides much more to its user than just visualization, such as:
Binding of data to visual elements.
Specifications on handling the addition and removal of data items.
The ability to style DOM elements dynamically.
Definition of an interaction model for the user with the data.
The ability to specify transitions between data visualizations based upon dynamic changes in data.
D3.js helps you bring data to life using HTML, SVG, and CSS. It focuses on the data, the way it is presented to the user, the changes in visualization with changes in data, and the way the user interacts with data through the visualization.
We are about to start on a fabulous journey of discovery with creating rich data visualizations with D3.js, and focusing on project-based learning of D3.js through practical examples. We will start out with the basic concepts, and then move through various examples of creating living data visualizations with D3.js.
In this first chapter, we will start with a brief overview of several of the concepts in D3.js, create a minimal D3.js application, and examine several of the tools that you can use to build D3.js applications.
Specifically, in this chapter, we will cover the following topics:
A brief overview of D3.js
The key design features of D3.js, including selection, data management, interaction, animation, and modules
An introduction to development tools to get you going quickly with D3.js
A simple Hello World program using D3.js
Examining the DOM generated by D3.js with the Google Chrome Developer tools
D3.js is a JavaScript library for manipulating DOM objects based upon data. By using D3.js and modern browsers, specifically those which can display and manipulate SVG, you can create rich visualizations of data. These visualizations not only visualize the data, but can also include descriptions to change what is shown to the user based upon the changes in the data, and the way in which the user can interact with the visuals which represent the data.
Note
You can get D3.js at http://d3js.org.

D3.js differs from other data visualization frameworks such as Processing (https://processing.org/) in that it provides a domain-specific language for transforming the DOM based upon data, whereas tools like Processing provide a lower level direct rendering model. D3.js lets you describe the means of visualizing the data instead of coding all of the specific details to draw the pixels of the visualizations. This facilitates easy creation of visualizations by allowing D3.js to worry about the details on rendering the data, based on the standards of SVG and CSS.
A fundamental concept in D3.js is the ability to easily manipulate the DOM in a web document. This is often a complicated problem, and many frameworks (such as jQuery) have been created to perform this task. D3.js provides capabilities similar to jQuery, and for those familiar with jQuery, much of D3.js will feel familiar.
But D3.js takes what libraries like jQuery provide and extends them to provide a more declarative nature of modifying the DOM to create visuals based on the structure of the data instead of simply being a framework for low level DOM manipulation.
This is important, as data visualization requires more than an ability to simply modify the DOM; it should also describe how the DOM should be changed when data is modified, including the way it changes when the user interacts with the visual elements representing the data.
Note
We will not cover jQuery in this book. Our focus will purely be on how we can manipulate the DOM using the facilities provided by D3.js. We will use D3.js constructs to apply styles instead of depending on CSS. All of this is to exemplify how to use the facilities of D3.js instead of hiding any of it with other tools.
We will examine many concepts in D3.js in detail, but let's start with a few high-level ideas in D3.js that are worth mentioning first.
The core operation in D3.js is selection, which is a filtered set of DOM elements queried from the document. As the data changes (that is, it is either loaded or modified), the result of the selection filter is changed by D3.js based on how the data was changed. Hence, the visual representation also changes.
D3.js uses the W3C selectors API (http://www.w3.org/TR/selectors-api/) for identifying the items in the DOM. This is a mini-language consisting of predicates that can filter the elements in the DOM by tag, class, id, attribute, containment, adjacency, and several other facets of the DOM. Predicates can also be intersected or unioned, resulting in a rich and concise selection of elements.
Selections are implemented by D3.js through the global namespace d3, which provides the d3.select() and d3.selectAll() functions. These functions utilize the mini-language and return, respectively, the first or all items matching the specification. Using the result of these selections, D3.js provides additional abilities for modifying those elements based upon your data using a process known as data binding.
The data in D3.js is bound to the DOM elements. Through binding, D3.js tracks a collection of objects along with their properties, and based upon rules that you specify, it modifies the DOM of the document based upon that data. This binding is performed through various operators provided by D3.js, which can easily be used to describe the mapping of the visual representation of the data. At this point, we'll introduce the three stages of data binding, and dive into more details on the process in Chapter 2, Selections and Data Binding.
The process of binding in D3.js consists of three stages: Enter, Update, and Exit. When performing a selection for the first time with D3.js, you can specify the data that is to be bound and needs to be entered. You can also specify the code to be executed for each of these stages.
When data is first joined into a selection, new visuals will need to be created in the DOM for each data item. This is performed using the enter process which is started by calling the .enter() function. Code that you specify after the .enter() function will be used to specify each and every piece of data that is represented visually, and D3.js will use this code to automatically generate the DOM that is required instead of you needing to code it all in detail.
As the application modifies this bound data, we will execute the selection repeatedly. D3.js will make a note of the existing visuals and the data they are bound to, and allow us to make modifications to the visuals based upon the way the data changed.
If data items are removed, we can use the D3.js .exit() function in a selection to inform D3.js to remove the visuals from the display. Normally, this is done by telling D3.js to remove the associated DOM elements, but we can also execute animations to make the removal demonstrate to the user how the visual is changing instead of a jarring change of display.
If we create a selection without an explicit reference to .enter() or .exit(), we are informing D3.js that we want to potentially make modifications to the visuals that are already bound to the data. This gives us the chance to examine the properties of each data item and instruct D3.js on changing the bound visuals appropriately.
This separation of enter, update, and exit processes allows for very precise control of the visual element lifecycle. These states allow you to update visuals as the data changes either internally or through user interaction. It also gives you the ability to provide well-defined transitions or animations for each of the three states, which are essential for dynamic data visualizations that demonstrate data not simply statically but also how it changes through motion.
D3.js provides facilities for animating the visual elements based upon the changes in data or upon events created by the user such as mouse events. These are performed by integrating with the events in the DOM using the .on() function as part of a selection.
D3.js event handlers are similar to those provided by jQuery. However, instead of just calling a function, they also expose the bound data item to the function, and if you want, the index of the data item in a collection. This saves us from having to write code that looks up the data item based upon things like mouse positions, and therefore, greatly simplifies our code.
Additionally, through integration with the enter, update, and exit selection processes, we can declaratively code scene transitions in each of these scenarios. These transitions expose the style and attr operators of the selections. Any changes that we make to those properties are noticed by D3.js, which will then apply an interpolator to transition the property values from the previous to the new values over a given period of time.
By using interpolation, we can avoid coding the repeated changes in the values of the visual properties (such as location and color) at each step of the animation. D3.js does all this for us automatically!
Additionally, D3.js automatically manages the scheduling of animations and transitions. This removes the need for you to manage complicated concurrency issues and guarantees exclusive access to the resources for each element along with highly optimized animation through a shared timer managed by D3.js.
D3.js provides a number of modules of prebuilt functionality for helping us code many of the things that we need to do for creating rich and interactive data visualizations. These modules in D3.js are grouped into a number of generated categories based upon the capabilities provided to the programmer.
Shapes: The shapes module gives us numerous prebuilt visuals including, and not limited to, lines, arcs, areas, and scatterplot symbols. By using D3.js shapes, we can simply add the geometric renderings to the visualization, and not worry about drawing each in detail, pixel by pixel.
Scales: This module gives us a means of converting data values into coordinates within the browser. These save us from coding repetitive, complex, and often error-prone translations by providing them out of the box. They also provide the basis for generating the visuals for axes, again saving us much effort in rendering visuals that would otherwise be complicated.
Layouts: The layouts module gives us the tools to easily (if not automatically) calculate the visual relationships between the elements in our visualizations. This is often the most complicated part of data visualizations, and D3.js provides us with many prebuilt hierarchical and physical layouts that make our lives as programmers much simpler.
Behaviors: This module provides implementations of the common user interaction patterns. An example would be a selection behavior that implements listening to the mouse events on visual elements, and changes the presentation of the item to represent that the user has selected it.
Data-processing modules: D3.js also includes various data-processing utilities such as nest and cross operators, and parsers for data in formats, such as CSV, JSON, TSV, and for data, in date and number formats.
We will discuss these modules in detail in their dedicated chapters.
D3.js applications can be built using many, if not any, web development tools. The choice of tool is often dependent upon the individual coder, as each platform (.Net, Node.JS, Ruby on Rails, and so on) provides their own (and many third-party) tools.
This book will not be prescriptive and specify editors. Instead, it will generally refer you to the online and functional examples of all the code, and leave it to the readers to reproduce them in their own development environment.
The examples in this book will be delivered using a combination of Js Bin (http://jsbin.com/) and bl.ocks.org (http://bl.ocks.org/), and we will use the Google Chrome Developer tools for examining the DOM in our examples. A brief introduction to each is therefore worthwhile, as each example in this book will be linked to an example on bl.ocks.org, which itself will contain a link to the code in Js Bin for you to play with dynamically.
Js Bin (http://jsbin.com/) is a website that functions as a development tool for facilitating the quick creation and sharing of simple JavaScript applications that run within the browser. It provides many features, including saving and sharing of HTML and JavaScript, real-time update of the UI while you are editing, and a very cool ability to push your code and data to GitHub.
Note
GitHub is a free code sharing and source code management tool. If you are not familiar with it, check it out at http://www.github.com.
I think that Js Bin provides one of the least-friction means of getting up and coding with D3.js. You can simply go to the website, start editing in HTML, CSS, or JavaScript, and see the results as you type in the browser pane. No need for installing any development tools or web servers!
As an example of Js Bin, the following link will take you to the first of our examples, the canonical Hello World application written purely in HTML. http://jsbin.com/zimeqe/edit?html,output.

Note
Don't worry right now about the code embedded in HTML in this demonstration. We will again look at this example along with more complicated ones later in this chapter.
The preceding screenshot displays a single bin, a combination of HTML, CSS, and JavaScript that is stored within Js Bin's servers. The Js Bin user interface provides multiple tabs/panes for the HTML, CSS, JavaScript, Console, and HTML output from the code in the bin. With Auto-run JS selected, the output will be regenerated on every interactive change to any of the code.
This makes Js Bin excellent for interactively demonstrating and creating D3.js visualizations.
bl.ocks.org (http://bl.ocks.org) is a service for D3.js code examples that you place on GitHub, a free source code and sharing repository, in an entity known as a gist. A gist is simply one or more reusable and sharable piece of code that are managed by GitHub. They are an excellent means of remembering and sharing small code examples.
bl.ocks.org was created by Mike Bostock, the original creator of D3.js. It is able to create great D3.js visualizations using gists, provided that the gist itself is a piece of D3.js code. Many, if not most, D3.js examples on the Web are presented as examples on bl.ocks.org, and this book will follow this model.
For a demonstration, open http://bl.ocks.org/d3byex/ed79b9fee311091333d6, which takes you to a bl.ock.org version of the Hello World example. Opening the link will present you with the following content.

This bl.ock follows a pattern that will be used throughout the book. Each example will be in its own bl.ocks.org and consist of a title, the D3.js code in operation, a link to live code on Js Bin, and then the HTML and any data that is in use in the example.
At the very top of the page, there is a link that you can click which will also take you to the gist on GitHub.

The link displayed in the preceding screenshot takes you to the following page at https://gist.github.com/d3byex/ed79b9fee311091333d6

This code is not dynamic like the one on Js Bin, but you can click on the Download Zip button, and all the files in the gist get downloaded to your system as a ZIP file.
D3.js applications can be developed in any number of tools. In this book, we will use Google Chrome as a browser, and use its embedded development tools. You can also use Firefox or Internet Explorer and their respective development plugins. Theoretically, all the examples will run identically in all three browsers, but have only been tested in Google Chrome.
You can access the developer tools from the Chrome settings button, or by using the key combination of option + command + I (on Mac) or Ctrl + Shift + I (on Windows). Pressing the F12 button also takes you to the Chrome Developer tools on a Windows platform.
The following screenshot demonstrates the Google Chrome Developer tools open on the Epicyclic Gearing bl.ock at http://bl.ocks.org/mbostock/1353700

On opening the developer tools, you will be presented with a panel that opens in the browser which displays the details of the content on the page.
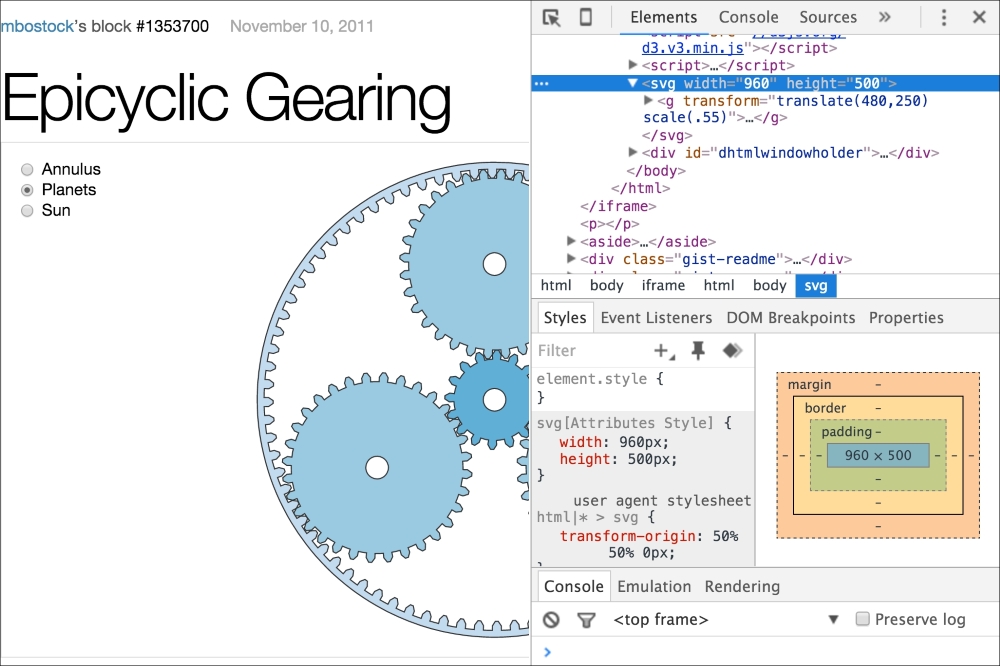
In this case the pane opens on the right (you can configure the location where it opens), and displays the HTML for the page with the main SVG element of the page highlighted. While selecting nodes in HTML, the tools will highlight that element in the web page, and display the selected details for the element, in this case, the styles. We will use these tools in Chapter 2, Selections and Data Binding, to demonstrate how D3.js binds data to the DOM elements, and in later chapters to understand how.
Now let's apply what we have learned in this chapter by stepping through an example, and see how we use D3.js to modify the DOM. The example will be the same as the one we just saw in the previous section; we'll walk through it to see how it functions.
The following is the entire entire HTML for the application:
<!DOCTYPE html>
<html>
  <head>
    <meta name="description" content="D3byEX 1.1>
  </head>
  <body>
    <script src="http://d3js.org/d3.v3.min.js"
            charset="utf-8"></script>
    <script>
      d3.select('body')
        .append('h1')
        .text('Hello World!');
    </script>
  </body>
</html>
Note
bl.ock (1.1): http://goo.gl/7KkIuC
The code appends a level one header using an h1 tag to the body tag of the document. The h1 tag then has its content set to the text Hello World. And as we saw earlier, the output in the browser looks like the following screenshot:

There are two primary parts to this application, both of which we will see in almost every example. The first part includes a reference to the D3.js script, which is performed with the following code placed just inside the <body> tag:
<script src="http://d3js.org/d3.v3.min.js"
           charset="utf-8"></script>
This references the minified D3.js file directly from the D3.js (http://d3js.org/) website. You can also copy this file and place it locally on your web server or in a Web project. Since all the examples in this book are online, we will always use this URL.
Note that we also have to specify charset="utf-8". This is normally not required for most JavaScript libraries, but D3.js is UTF-8 encoded and not including this can cause issues. So, make sure you don't forget this attribute.
The actual D3.js code in this example consists of the following three functions placed within another <script> tag within the body of the document.
d3.select('body')
  .append('h1')
  .text('Hello World!');
Let's examine how this puts the text in the web page.
d3.select('body')All D3.js statements will start with the use of the d3 namespace. This is the root of where we start accessing all the D3.js functions. In this line, we call the .select() function, passing its body. This is telling D3.js to find the first body element in the document and return it to us for performing other operations upon it.
The .select() function returns a D3.js object representing the body DOM object. We can immediately call .append('h1') to add the header element inside the body of the document.
The .append() function returns another D3.js object, but this one represents the new h1 DOM element. So all we need to do is to make a chained call: .text('Hello World!'), and our code is complete.
This process of calling functions in this manner is referred to in D3.js parlance as chaining, and in general, it is referred to as a fluent API in programming languages. This chaining is the aforementioned mini-language. Each chained D3.js function call further specifies the operation, allowing you to very easily describe how you want to modify the DOM through chained method calls.
This sometimes feels strange to those who have not had experience in using a fluent syntax, but once you get used to it, I guarantee that you will see the reason behind using this type of syntax. As we will see through the examples that we cover, this provides us with a very concise means of declaratively instructing D3.js on what we want in our visualization.
Note
For those familiar with jQuery, this syntax will look familiar. An equivalent piece of code could be written in JQuery as $('body').append('h1').text('Hello World');
But as we will see in more complex examples, the features provided by D3.js will give us much more power to create data visualizations than can be done with jQuery.
Now let's take a quick look at the DOM that was created by this code using the Chrome Developer Tools. Open the developer tools using the instructions given earlier in the chapter. I prefer mine to be displayed to the right of the page, and the book will follow this convention.

Since this example (and all the examples in this book) is hosted within Js Bin, there is a bunch of HTML content generated automatically and injected into our page by the backend of Js Bin. To find the element corresponding to the text generated by our code, you can drill through the DOM in the explorer. Otherwise, you can right-click on the element in the output pane of the browser, and select Inspect Element as seen in the following screenshot:

Then you can move directly to the element in the developer tools.

In the preceding screenshot, we can visually verify that the <body> tag had a new <h1> tag added with the text as we desired.
In this chapter, we looked at several high level concepts in D3.js: selections, data, interactions and animation, and modules. Then we briefly covered several of the tools that can be used to build D3.js applications, and which will be used in examples that follow in the remainder the book: Js Bin, bl.ocks.org, Google Chrome, and Google Chrome Developer tools. We closed the chapter with a very simple example that demonstrates how to include D3.js in your application and performing a simple selection that inserts content into the web page.
In the next chapter, we will expand upon the concept of selection and use it to bind data to visual elements in the DOM. We will expand our use of D3.js to create and modify DIV elements. Further on in Chapter 3, Creating Visuals with SVG, we will get into the real power of D3.js by using it to manipulate SVG.
