Download code from GitHub
Data-Driven Documents (D3), developed by Mike Bostock and the D3 community in 2011, is the successor to Bostock's earlier Protovis library. It allows pixel-perfect rendering of data by abstracting the calculation of things such as scales and axes into an easy-to-use Domain-Specific Language (DSL), and uses idioms that should be immediately familiar to anyone with experience of using the popular jQuery JavaScript library. Much like jQuery, in D3, you operate on elements by selecting and then manipulating them via a chain of modifier functions. Especially within the context of data visualization, this declarative approach makes using it easier and more enjoyable than a lot of other tools out there. The official website, https://d3js.org/, features many great examples that show off the power of D3, but understanding them is tricky to start with. After finishing with this book, you should be able to understand D3 well enough to figure out the examples, tweaking them to fit your needs. If you want to follow the development of D3 more closely, check out the source code hosted on GitHub at https://github.com/d3.
In this chapter, we'll lay the foundations of what you'll need to run all the examples in the book. I'll explain how you can start writing ECMAScript 2017 (ES2017)--the latest and most advanced version of JavaScript--and show you how to use Babel to transpile it to ES5, allowing your modern JavaScript to be run on any browser. We'll then cover the basics of using D3 v4 to render a basic chart.
The fine-grained control and its elegance make D3 one of the most powerful open source visualization libraries out there. This also means that it's not very suitable for simple jobs, such as drawing a line chart or two--in that case, you may want to use a library designed for charting. Many use D3 internally anyway. For a massive list, visit https://github.com/sorrycc/awesome-javascript#data-visualization.
D3 is ultimately based around functional programming principles, which is currently experiencing a renaissance in the JavaScript community. This book isn't really about functional programming, but a lot of what we'll do will seem really familiar if you've ever used functional programming principles before. If you haven't, or come from an Object-Oriented (OO) background like I do, don't worry, I'll explain the important bits as we get to them, and the revised section on functional programming at the beginning of Chapter 4, Making Data Useful, will hopefully give you some insight into why this paradigm is so useful, especially for data visualization and application construction.
The second edition of this book contained quite a number of examples using the class feature that is new in ES2015. The revised examples in this edition use factory functions instead, and the class keyword never appears. Why is this, exactly?
ES2015 classes are essentially just syntactic sugaring for factory functions. By this I mean that they ultimately transpile down to factory functions anyway. Although classes can provide a certain level of organization to a complex piece of code, they ultimately hide what is going on underneath it all. Not only that, using OO paradigms, such as classes, is effectively avoiding one of the most powerful and elegant aspects of JavaScript as a language, which is its focus on first-class functions and objects. Your code will be simpler and more elegant using functional paradigms than OO, and you'll find it less difficult to read examples in the D3 community, which almost never use classes.
There are many, much more comprehensive arguments against using classes than I'm able to make here. For one of the best, refer to Eric Elliott's excellent The Two Pillars of JavaScript pieces at: www.medium.com/javascript-scene/the-two-pillars-of-javascript-ee6f3281e7f3.
One of the key changes to D3 since the last edition of this book is the release of version 4.
Among its many changes, the most significant one is a complete overhaul of the D3 namespace. This means that none of the examples in this book will work with D3 3.x, and the examples from Learning D3.js Data Visualization, Second Edition will not work with D3 4.x. This is quite possibly the cruelest thing Mr. Bostock could ever do to educational authors such as myself (I am joking here!). Kidding aside, it also means many of the block examples in the D3 community are out of date and may appear rather odd if this book is your first encounter with the library. For this reason, it is very important to note the version of D3 an example uses -- if it uses 3.x, it might be worth searching for a 4.x example just to prevent this cognitive dissonance.
Note
You can usually find the version of D3 in an example block online by looking at the script tags near the top of the code. If it resembles: <script src="https://d3js.org/d3.v3.min.js"></script>...You're looking at a D3 v3 example. If it says:<script src="https://d3js.org/d3.v4.min.js"></script>...You're looking at a modern, v4 example and are good to go.
Related to this is how D3 has been broken up from a single library into many smaller libraries (or micro-libraries). There are two approaches you can take:
- You can use D3 as a single library (a monolib) in much the same way as version 3
- You can selectively use individual (microlib) components of D3 in your project
This book takes the former route. While learning D3, using micro-libraries takes a lot more effort, even if it helps reduce the size of the final bundle that people who view your graphics will have to download. That said, I will try to signpost which package a particular piece of functionality resides in; so, once you become more comfortable with D3, you can start using the microlibs instead of including everything and the kitchen sink.
One of the main changes to this book since its first edition is the emphasis on modern JavaScript; in this case, ES2017. Formerly known as ES6 (Harmony), it pushes the language features of JavaScript forward significantly, allowing for new usage patterns that simplify code readability and increased expressiveness. If you've written JavaScript before and the examples in this chapter look pretty confusing, it means you're probably familiar with the older, more common ES5 syntax.However, don't sweat! It really doesn't take too long to get the hang of the new syntax, and I will try to explain the new language features as we encounter them. Although it might seem to be something of a steep learning curve at the start, by the end, you'll have improved your ability to write code quite substantially and will be on the cutting edge of contemporary JavaScript development.
Note
For a really good rundown of all the new toys you have with ES2015-17, check out https://babeljs.io/docs/learn-es2015/, a nice guide by the folks at Babel.js, which we will use extensively throughout this book.
Before I go any further, let me clear some confusion about what ES2017 actually is. Initially, the ECMAScript (or ES for short) standards were incremented by cardinal numbers, for instance, ES4, ES5, ES6, and ES7. However, with ES6, they changed this so that a new standard is released every year in order to keep pace with modern development trends, and thus we refer to the year (2017) now. The big release was ES2015, which more or less maps to ES6. ES2016 was ratified in June 2016, and builds on the previous year's standard, while adding a few fixes and two new features. ES2017 is currently in the draft stage, which means proposals for new features are being considered and developed until it is ratified sometime in 2017. As a result of this book being written while these features were in draft, they may not actually make it to ES2017 and thus may need to wait until a later standard to be officially added to the language.
You don't really need to worry about any of this, however, because we use Babel.js to transpile everything down to ES5 anyway, so it runs the same in Node.js and in the browser. I will try to refer to the relevant specification where a feature is added, when I introduce it for the sake of accuracy (for instance, modules are an ES2015 feature), but when I refer to JavaScript, I mean all modern JavaScript, regardless of which ECMAScript specification it originated in.
I will try not to be too opinionated in this book about which editor or operating system you should use to work through it (though I am using Atom on macOS X), but you will need a few prerequisites to start.
The first is Node.js. Node is widely used for Web development nowadays, and it's actually just JavaScript that can be run on the command line. Later on, in this book, I'll show you how to write a server application in Node, but for now, let's just concentrate on getting it and npm (the brilliant and amazing package manager that Node uses) installed. If you're on Windows or macOS X without Homebrew, use the installer at https://nodejs.org/en/. If you're on macOS X and are using Homebrew, I would recommend installing n instead, which allows you to easily switch between versions of Node:
$ brew install n
$ n lts
Note
If you're in Windows, the $ above might be confusing. In UNIX-based operating systems, regular users see a $ on the command prompt, and the root administrator user sees a #. By indicating that, I mean that you should run the above commands as a regular user and not a super-user.
Regardless of how you do it, when you have finished, verify by running the following lines:
$ node --version
$ npm --version
If it displays the versions of node and npm, it means you're good to go.
Note
I'm using 6.5.0 and 3.10.3, respectively, though yours might be slightly different--the key is making sure that node is at least version 6.0.0.
If it says something similar to Command not found, double-check whether you've installed everything correctly, and verify that Node.js is in your $PATH environment variable.
Throughout this book, we will use a combination of Babel and Webpack to turn our fancy modular modern JavaScript into something even the crummiest old browsers (Hi, Internet Explorer 9!) can run.
First, create a package.json file to store the version of each dependency that we want. Do this by first creating a new folder and then running npm init:
$ mkdir d3-projects
$ cd d3-projects
$ npm init -y
The -y flag tells npm init to use all the default settings and not ask you any questions. Next, install our stack, using npm:
$ npm install "babel-core@^6" "babel-loader@^6" "babel-preset-es2017@^6" "babel-preset-stage-0@^6" "webpack@^2" "webpack-dev-server@^2" css-loader style-loader json-loader --save-dev
This installs v2 of Webpack, v6 of Babel, and a boatload of presets and plugins for both. It then saves these to package.json so that you can reinstall them as easily as running:
$ npm installYou'll also need to install D3 by typing the following command:
$ npm install d3 --saveNext, we need to create a configuration for Webpack. I won't get into detail around what each of the directives do; for that, look at the config supplied with the book repository; save this as webpack.config.js:
const path = require('path');
module.exports = [{
  entry: {
    app: ['./lib/main.js'],
  },
  output: {
    path: path.resolve(__dirname, 'build'),
    publicPath: '/assets/',
    filename: 'bundle.js',
  },
  devtool: 'inline-source-map',
  module: {
    rules: [{
      test: /.js?$/,
      exclude: /(node_modules|bower_components)/,
      loader: 'babel-loader',
    }, {
      test: /.json$/,
      loader: 'json-loader',
    }, {
      test: /.css$/,
      loader: 'style-loader!css-loader',
    }],
  },
}];
Lastly, we need to edit package.json to have a few shortcuts to make our lives easier. After the line that starts with name, put the following:
"babel": {
  "presets": [
    "es2017"
  ]
},
"main": "lib/main.js",
"scripts": {
  "start": "webpack-dev-server --inline",
},
This is what you need to do if you're starting a project from scratch.
Alternatively, you can clone the book's repository from GitHub. GitHub is where most of the world stores open source and other code. I've done a lot of configuration for you, in addition to supplying all of the examples and sample data. I'll move forward under the assumption you've cloned the book repository and are working out of the book repository directory. To do this, run the following command:
$ git clone https://github.com/aendrew/learning-d3-v4
$ cd learning-d3-v4
This will clone the development environment and all the samples in the learning-d3-v4/ directory, as well as switching you into it and installing all of the dependencies via npm.
Note
Another option is to fork the repository on GitHub and then clone your fork instead of mine as was just shown in the preceding code. This will allow you to easily publish your work on the cloud, enabling you to more readily seek support, display finished projects on GitHub Pages, and even submit suggestions and amendments to the parent project. This will help us improve this book for future editions. To do this, fork aendrew/learning-d3-v4 by clicking the "fork" button in GitHub, and replace aendrew in the preceding code snippet with your GitHub username.
Each chapter of this book is in a separate branch. To switch between them, type the following command:
$ git checkout chapter1
Replace 1 with whichever chapter you want the examples for. Stay on the master branch for now, though. To get back to it, type this line:
$ git stash save && git checkout masterThe master branch is where you'll do a lot of your coding as you work through this book. We still need to install our dependencies, so let's do that now:
$ npm installAll of the source code that you'll be working on is in the lib/ folder. You'll notice it contains just a main.js file; almost always, we'll be working in main.js, as index.html is just a minimal container to display our work in. This is it in its entirety, and it's the last time we'll look at any HTML in this book:
<!DOCTYPE html>
<html>
 <head>
 <meta charset="utf-8">
 <title>Learning Data Visualization with D3.js</title>
 </head>
 <body>
 <script src="assets/bundle.js"></script>
 </body>
</html>
There's also an empty style sheet in styles/index.css, which we'll add to in a bit.
Next, start the development server by typing the following line:
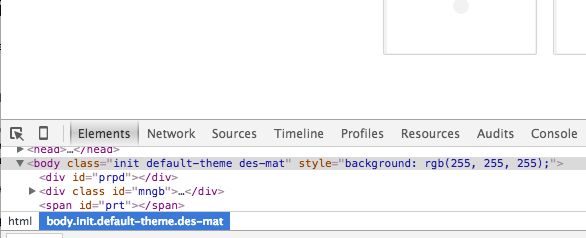
$ npm startThis starts up the Webpack development server, which will transform our new-fangled ES2017 JavaScript into backward-compatible ES5 and serve it to the browser. Now, point Chrome (or whatever, I'm not fussy--so long as it's not Internet Explorer!) to localhost:8080 and fire up the developer console (Ctrl + Shift + J for Linux and Windows and Option + Command + J for Mac). You should see a blank website and a blank JavaScript console with a Command Prompt waiting for some code:

Chrome Developer Tools are indispensable to Web development. Most modern browsers have something similar, but to keep this book shorter, we'll stick to just Chrome here for the sake of simplicity. Feel free to use a different browser. Firefox's Developer Edition is particularly nice, and--yeah yeah, I hear you guys at the back--Opera is good too! We will mostly use the Elements and Console tabs, Elements to inspect the DOM and Console to play with JavaScript code and look for any problems. The other six tabs come in handy for large projects:
The Network tab will let you know how long files will take to load and help you inspect the Ajax requests. The Profiles tab will help you profile JavaScript for performance. The Resources tab is good for inspecting client-side data. Timeline and Audits are useful when you have a global variable that is leaking memory and you're trying to work out exactly why your library is suddenly causing Chrome to use 500 MB of RAM. While I've used these in D3 development, they're probably more useful when building large Web applications with frameworks such as React and Angular.
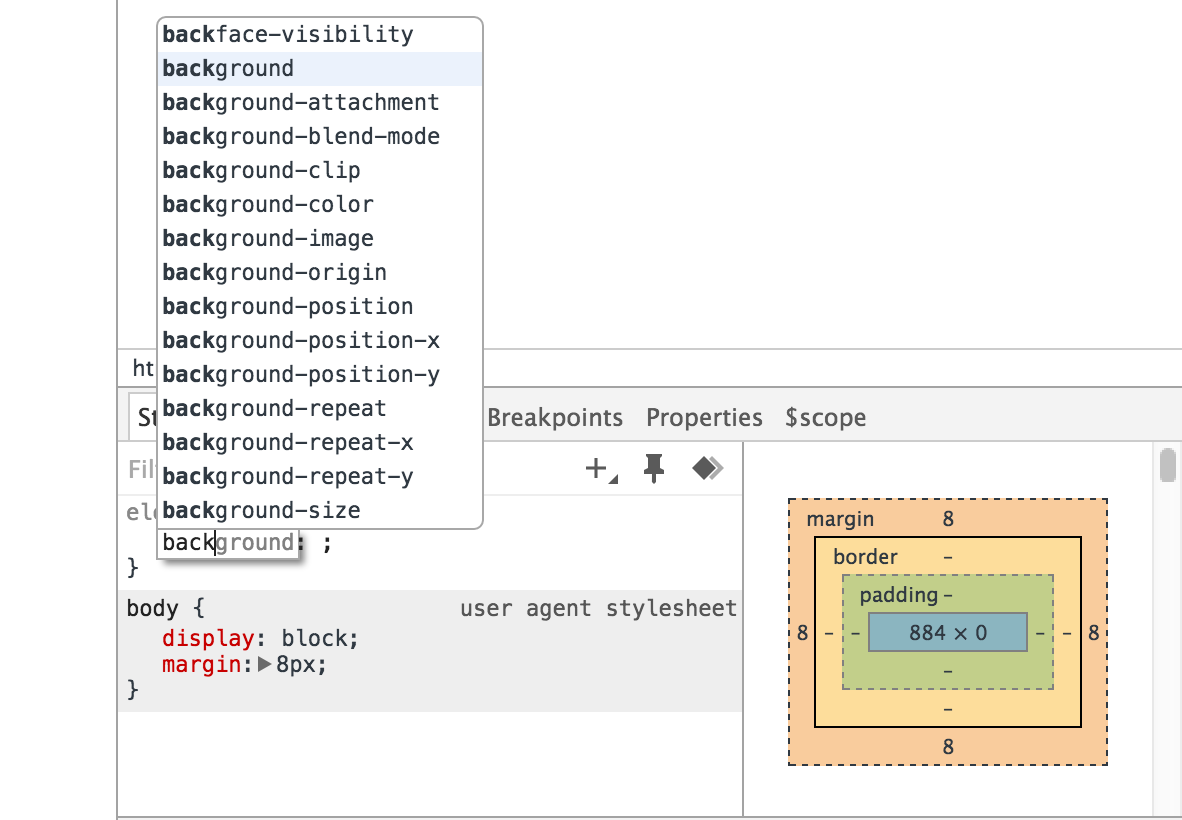
The main one you want to focus on, however, is Sources, which shows all the source code files that have been pulled in by the web page. Not only is this useful in determining whether your code is actually loading, it also contains a fully functional JavaScript debugger, which few mortals dare to use. Although explaining how to debug code is kind of boring and not at the level of this chapter, learning to use breakpoints instead of perpetually using console.log to figure out what your code is doing, is a skill that will take you far in the years to come. For a good overview, visit https://developers.google.com/web/tools/chrome-devtools/debug/breakpoints/step-code?hl=en Most of what you'll do with Developer Tools, however, involves looking at the CSS inspector at the right-hand side of the Elements tab. It can tell you what CSS rules are impacting the styling of an element, which is very good for hunting rogue rules that are messing things up. You can also edit the CSS and immediately see the results, as follows:
No introductory chapter on D3 would be complete without a basic bar chart example. They are to D3 as Hello World is to everything else, and 90% of all data storytelling can be done in its simplest form with an intelligent bar or line chart. For a good example of this, look at the kinds of graphics the Financial Times or The Economist includes in their articles--they frequently summarize the entire piece with a simple line chart or histogram. Coming from a newsroom development background (Full disclosure: I work on the Interactive Graphics desk at the Financial Times), many of my examples will be related to some degree to current events or possible topics worth visualizing with data. The news development community has been really instrumental in creating the environment for D3 to flourish, and it's increasingly important for aspiring journalists to have proficiency in tools such as D3. The first dataset that we'll use is the UK Electoral Commission's result set from the UK Brexit referendum. We will draw a bar chart depicting voter turnout by region.
The source for this data is at http://www.electoralcommission.org.uk/find-information-by-subject/elections-and-referendums/past-elections-and-referendums/eu-referendum/electorate-and-count-information.
We'll create a bar for each region in the UK. The first step is to get a basic container setup, which we can then be populated with all of our delicious new JavaScript code. We can either jump straight into the code, or we can set up some stuff to make life easier for us later on. Let's go with the first route for now. There's a lot of new-fangled JavaScript stuff coming at you really soon, so let's keep it light for the moment.
First open lib/main.js and write your very first line of D3:
const chart = d3.select('body')
.append('svg')
.attr('id', 'chart');
This selects the HTML <body> element, appends a <svg> element, and gives it the ID of #chart. We'll be using this pattern a lot throughout the book.
Note
Before we get any further, it's worth pointing out our first new-fangled modern JavaScript feature: The const keyword is used to define a variable that won't change dramatically. By dramatically I mean that you can still modify it somewhat (for instance, adding elements to an array or modifying an object), but you'll throw an error if you try to reassign it. It will also throw an error if you try to use it before it's declared. Unlike constants in other languages, JavaScript constants only apply to the current function scope (they're not global unless you make them that). This is really useful when using a functional programming style, as it prevents weird bugs caused by variable hoisting (an unusual JavaScript language feature, whereby variables are ultimately interpreted at the top of each function closure instead of where you actually define them). For more on const, visit http://mdn.io/const.Another new way to define variables in JavaScript is using let, which is like var but, like const, has block scope, meaning that it is limited to the block, statement, or expression where it's used. This also helps prevent weird bugs. For more information, visit http://mdn.io/let.When should you use each? Use const if you're not going to reassign a variable and use let if you will. I try to avoid reassigning variables, so I will usually use const in this book. However, while you still can use the var keyword to assign variables in modern JavaScript, you really shouldn't--always use let or const instead, defaulting to let if you're not sure which will work in a given situation.
Yeah! Let's open this up in the browser; ensure that the development server is running (npm start if it isn't) and go to http://localhost:8080
Uncaught Error: Cannot find module "d3"
Whups. Okay, that could have gone better...
You're getting this error because we haven't imported D3, yet. If you've used D3 before, you might be more familiar with it attached to the window global object. This is what happens when you include d3.js via a <script> tag. We're not doing that, however--we're JavaScript rockstarninjaciraptors; we use the new hotness, ES2015 module imports!
Go back to main.js. At the top of the file, type this:
import * as d3 from 'd3';
Let's unpack this a bit. Import statements must be at the top of every file (so no sneaky Node.js-style require() calls inside your functions), because it allows for static analysis. This lets new JavaScript tools be more effective. They always start with the import token.
Next is the curly bracket bit. In an ES2015 module, there are two types of exports:
- Named: This is where you give the export a title that needs to be imported specifically (though it can be renamed), and it is inside curly brackets.
- Default: There can be only one of these per module, and it can be referred to as anything when importing. We'll see this a bit later on.
What we do above is import all of the D3 microlibs under the namespace d3.
If you go back to your browser and switch quickly to the Elements tab, you'll notice a new SVG with an ID of #chart at the bottom of the page. There's progress!
Go back to main.js. We need to get our data in somehow, and I'll show you far better ways of doing this later on, but let's work through the pain and do this the bad, old way--using XMLHttpRequest:
const req = new window.XMLHttpRequest();
req.addEventListener('load', mungeData);
req.open('GET', 'data/EU-referendum-result-data.csv');
req.send();
This instantiates a new XMLHttpRequest object, tells it to load the data from the data/directory and then passes it to the soon-to-be-written mungeData() function once loaded.
Note how we had to use the ugly new keyword to instantiate it? Note how it took four lines and a new variable declaration? Note how we have to handle our response in a callback? Eww! We'll improve upon this in later chapters. The only advantage of doing things this way is that it works in nearly any browser without polyfilling, but there are so many better ways of doing this, all of which we will touch upon in Chapter 4, Making Data Useful.
The CSV file we're loading in has a row for each constituency in the UK, containing everything from what percentage voted for what to what the voter turnout was to how many ballots were invalid or spoiled. What we will do is turn that into an array of objects depicting the mean percentage for each broader region that voted for leaving.
It's time to create our mungeData() function. We will use d3.csvParse() (from the d3-dsv microlib) to parse our CSV data string in an object and then use some features from the d3-array microlib to manipulate that data:
function mungeData() {
  const data = d3.csvParse(this.responseText);
  const regions = data.reduce((last, row) => {
    if (!last[row.Region]) last[row.Region] = [];
    last[row.Region].push(row);
    return last;
  }, {});
  const regionsPctTurnout = Object.entries(regions)
    .map(([region, areas]) => ({
      region,
      meanPctTurnout: d3.mean(areas, d => d.Pct_Turnout),
    }));

  renderChart(regionsPctTurnout);
}
Note
Hey, there's another ES2015 feature! Instead of typing function() {} endlessly, you can now just put () => {} for anonymous functions. Other than being six keystrokes less, the fat arrow doesn't bind the value of this to something else. This won't impact us very much because we're using a functional style of programming; but if we were using classes, this would be a lifesaver. For more on this, visit http://mdn.io/Arrow_functions.
We transform our data in three steps here:
- First, we convert it into an array of objects using
d3.csvParse()and assign the result todata. - Then, we transform the array into an object keyed by the region, such that the object's keys are the regions, and the values are an array of associated constituencies.
- Lastly,
Object.entriesconverts an object into a multidimensional array consisting of elements comprising key-value pairs, which we can then reduce into a new object comprising each region's name and the mean of each constituency's voter turnout percentage.
You may have noted that the function signature for the call to Array.prototype.map is a little unusual:
.map(([region, areas]) => { Here, we use a new ES2015 feature called destructuring assignment to give each element in our array a temporary name. Normally, the callback signature is the following:
function(item, index, array) {} However, because we know item is an array with two elements, we can give each of them a nickname, making our code easier to read (we don't use the index or array arguments this particular time, but if we did, we'd just put those arguments after the destructuring bit).
Lastly, we pass our fully munged data to an as-of-yet-unwritten function, renderChart(), which we'll add next.
We can also simply add the above to this:
  const regionsPctTurnout = d3.nest()
    .key(d => d.Region)
    .rollup(d => d3.mean(d, leaf => leaf.Pct_Turnout))
    .entries(data);
d3.nest() is part of the d3-collection microlib, which we'll cover in--you guessed it--Chapter 4, Making Data Useful. D3 is a very un-opinionated library, which means you can accomplish many tasks in a variety of ways--there often really isn't a proper way of doing things. I will try to expose a variety of ways to accomplish tasks throughout the book; feel free to choose whichever you prefer.
With that done, let's render some data.
Create a new function in main.js, renderChart():
function renderChart(data) {
  chart.attr('width', window.innerWidth)
    .attr('height', window.innerHeight);
}
All this does is take our earlier chart variable and set its width and height to that of the window. We're almost at the point of getting some bars onto that graph; hold tight!
First, however, we need to define our scales, which decide how D3 maps data values to pixel values. Put another way, a scale is simply a function that maps an input range to an output domain. This can be annoying to remember, so I'm going to shamelessly steal an exercise from Scott Murray's excellent tutorial on scales from Interactive Data Visualization for the Web:
When I say "input," you say "domain." Then I say "output," and you say "range." Ready? Okay: Input! Domain! Output! Range! Input! Domain! Output! Range! Got it? Great.
It seems silly, but I frequently find myself muttering the above when I have a deadline and am working on a chart late at night. Give it a go!
Next, add this code to renderChart():
const x = d3.scaleBand()
  .domain(data.map(d => d.region))
  .rangeRound([50, window.innerWidth - 50])
  .padding(0.1);
The x scale is now a function that maps inputs from a domain composed of our region names to a range of values between 50 and the width of your viewport (minus 50), with some spacing defined by the 0.1 value given to .padding(). What we've created is a band scale, which is like an ordinal scale, but the output is divided into sections. We'll talk more about scales later on in the book.
Note
In this example, we use a uniform value of 50 for our margins, which we pass to our scales and elsewhere. Any arbitrary number passed in code is often referred to as a magic number, insomuch that, to anyone reading your code, it just looks like a random value that magically makes it work. This is bad; don't do this--it makes your code harder to read, and it means that you have to find and replace every value if you want to change it. I only do so here to demonstrate this fact. Throughout the rest of the book, we'll define things, such as margins more intelligently; stay tuned!
Still inside renderChart(), we define another scale named y:
const y = d3.scaleLinear()
  .domain([0, d3.max(data, d => d.meanPctTurnout)])
  .range([window.innerHeight - 50, 0]);
Similarly, the y scale is going to map a linear domain (which runs from zero to the max value of our data, the latter of which we acquire using d3.max) to a range between window.innerHeight (minus our 50 pixel margin) and 0. Inverting the range is important because D3 considers the top of a graph to be y=0. If ever you find yourself trying to troubleshoot why a D3 chart is upside down, try switching the range values in one of your scales.
Now, we define our axes. Add this just after the preceding line, inside renderChart:
const xAxis = d3.axisBottom().scale(x);
const yAxis = d3.axisLeft().scale(y);
We've told each axis what scale to use when placing ticks and which side of the axis to put the labels on. D3 will automatically decide how many ticks to display, where they should go, and how to label them. Since most D3 elements are objects and functions at the same time, we can change the internal state of both scales without assigning the result to anything. The domain of x is a list of discrete values. The domain of y is a range from 0 to the d3.max of our dataset, the largest value.
Now, we will draw the axes on our graph:
chart.append('g')
  .attr('class', 'axis')
  .attr('transform',
    `translate(0, ${window.innerHeight - 50})`)
  .call(xAxis);
Note
Hot new ES2015 feature alert! Above, the transform argument is in backticks (`), which are template literal strings. They're just like normal strings, except for two differences: you can use newline characters in them, and you can also run arbitrary JavaScript expressions in them via the ${} syntax. Above, we merely echo out the value of window.innerHeight, but you can write any expression that returns a string-like value, for instance, using Array.prototype.join to output the contents of an array; it's really handy!
We've appended an element called g to the graph, given it the axis CSS class, and moved the element to a place in the bottom-left corner of the graph with the transform attribute.
Finally, we call the xAxis function and let D3 handle the rest.
The drawing of the other axis works exactly the same, but with different arguments:
  chart.append('g')
    .attr('class', 'axis')
    .attr('transform', 'translate(50, 0)')
    .call(yAxis);
Now that our graph is labeled, it's finally time to draw some data:
  chart.selectAll('rect')
    .data(data)
    .enter()
    .append('rect')
    .attr('class', 'bar')
    .attr('x', d => x(d.region))
    .attr('y', d => y(d.meanPctTurnout))
    .attr('width', x.bandwidth())
    .attr('height', d =>
        (window.innerHeight - 50) - y(d.meanPctTurnout));
Okay, there's plenty going on here, but this code is saying something very simple. This is what is says:
- For all rectangles (
rect) in the graph, load our data - Go through it
- For each item, append a
rect - Then, define some attributes to it
Note
Ignore the fact that there aren't any rectangles initially; what you're doing is creating a selection that is bound to data and then operating on it. I can understand that it feels a bit weird to operate on nonexistent elements (this was personally one of my biggest stumbling blocks when I was learning D3), but it's an idiom that shows its usefulness later on when we start adding and removing elements due to changing data.
The x scale helps us calculate the horizontal positions, and bandwidth() gives the width of the bar. The y scale calculates vertical positions, and we manually get the height of each bar from y to the bottom. Note that whenever we needed a different value for every element, we defined an attribute as a function (x, y, and height); otherwise, we defined it as a value (width).
Let's add some flourish and make each bar grow out of the horizontal axis. Time to dip our toes into animations! Modify the code you just added to resemble the following; I've highlighted the lines that are different:
chart.selectAll('rect')
  .data(data)
  .enter()
  .append('rect')
  .attr('class', 'bar')
  .attr('x', d => x(d.region))
.attr('y', window.innerHeight - 50)
  .attr('width', x.bandwidth())
  .attr('height', 0)
    .transition()
    .delay((d, i) => i * 20)
    .duration(800)
    .attr('y', d => y(d.meanPctTurnout))
    .attr('height', d =>
        (window.innerHeight - 50) - y(d.meanPctTurnout));
The difference is that we statically put all bars at the bottom (window.innerHeight - 50) with a height of zero and then entered a transition with .transition(). From here on, we define the transition that we want.
First, we wanted each bar's transition delayed by 20 milliseconds using i*20. Most D3 callbacks will return the datum (or whatever datum has been bound to this element, which is typically set to d) and the index (or the ordinal number of the item currently being evaluated, which is typically i) while setting the this argument to the currently selected DOM element. If we were using, say, classes, this last point would be fairly important; otherwise, we'd be evaluating the rect SVGElement object instead of whatever context we actually want to use. However, because we're mainly going to use factory functions for everything, figuring out which context is assigned to this is far less of a worry.
This gives the histogram a neat effect, gradually appearing from left to right instead of jumping up at once. Next, we say that we want each animation to last just shy of a second, with .duration(800). At the end, we define the final values for the animated attributes--y and height are the same as in the previous code--and D3 will take care of the rest.
Save your file and refresh. If everything went according to plan, you should have a chart that looks like the following:

According to this, voter turnout was fairly high during the EU referendum, with the south-west having the highest turnout. Hey, look at this; we kind of just did some data journalism here! Remember that you can look at the entire code on GitHub athttp://github.com/aendrew/learning-d3-v4/tree/chapter1 if you didn't get something similar to the preceding screenshot.
We still need to do just a bit more, mainly using CSS to style the SVG elements. We could have just gone to our HTML file and added CSS, but then that means opening that yucky index.html file. Also, where's the fun in writing HTML when we're learning some newfangled JavaScript?
First, create an index.css file in your styles/ directory:
html, body {
  padding: 0;
  margin: 0;
}

.axis path, .axis line {
  fill: none;
  stroke: #eee;
  shape-rendering: crispEdges;
}

.axis text {
  font-size: 11px;
}

.bar {
  fill: steelblue;
}
Then, just add the following line to the top of main.js:
import * as styles from 'styles/index.css';
I know. Crazy, right? No <style> tags needed!
Note
It's worth noting anything involving require() or import that isn't a JS file is the result of a Webpack loader. Although the author of this text is a fan of Webpack, all we're doing is importing the styles into main.js with Webpack instead of requiring them globally via a <style> tag. This is cool because, instead of uploading a dozen files when deploying your finished code, you effectively deploy one optimized bundle. You can also scope CSS rules to be particular to when they're being included and all sorts of other nifty stuff; for more information, refer to https://github.com/webpack-contrib/css-loader.
Looking at the preceding CSS, you can now see why we added all those classes to our shapes. We can now directly reference them when styling with CSS. We made the axes thin, gave them a light gray color, and used a smaller font for the labels. The bars should be light blue. Save this and wait for the page to refresh. We've made our first D3 chart:

I recommend fiddling with the values passed to .width and .height to get a feel of the power of D3. You'll notice that everything scales and adjusts to any size without you having to change other code. Smashing!
In this chapter, you learned what D3 is and took a glance at the core philosophy behind how it works. You also set up your computer for prototyping of ideas and to play with visualizations. This environment will be assumed throughout the book.
We went through a simple example and created an animated histogram using some of the basics of D3. You learned about scales and axes, that the vertical axis is inverted, that any property defined as a function is recalculated for every data point, that we use a combination of CSS and SVG to make things beautiful. We also did a lot of fancy stuff with ES2017, Babel, and Webpack, and got Node.js installed. Go us!
Most of all, this chapter has given you the basic tools so that you can start playing with D3.js on your own. Tinkering is your friend! Don't be afraid to break stuff--you can always reset to a chapter's default state by running $ git reset --soft origin/chapter1, replacing 1 with whichever chapter you're on.
Next, we'll be looking at all this in a bit more in depth, specifically how the DOM, SVG, and CSS interact with each other. This chapter discussed quite a lot, so if some parts got away from you, don't worry. Just power through to the next chapter, and everything will start to make a lot more sense.