


 Download code from GitHub
What is SAS? If you had never heard of SAS, most likely you would not have picked up this book. You may have thought about the airline, Scandinavian Airline Systems (SAS), and wondered what an airline has to do with big data analytics. Other than the fact that airlines generate a lot of big data and they need to analyze it just like any other business, we are not talking about the airline. This book is about the SAS Institute, which is officially described like this SAS is the world's largest privately held software company. Third-party guide for referencing SAS trademarks, https://www.sas.com/en_us/legal/editorial-guidelines.html.
Privately held simply means the company is privately owned and does not sell stock. SAS, the software company that develops and sells SAS® software, has been the world's recognized leader as the best analytics platform for 41 years and counting. SAS is also the name of the fourth-generation programming language that provides the framework designed and engineered to do data management for analytics, provide advanced analytic capabilities, and provide multiple ways to deploy the results into production systems. This book will provide an introduction to this powerful solution, give you some hands-on experience, and provide you with knowledge about how SAS scales from small data to handle Big Data Analytics with SAS. What is really nice about SAS is that it really is much more than a programming language; it is an analytics processing environment. It is designed to scale so that you can use the existing knowledge and skills you develop using SAS on any size data to do the same type of analysis and reporting on big data. The SAS environment helps distribute where the processing of the data occurs, so you don't have to. We will get into the details of how SAS does this in Chapter 7, SAS® Software Engineers the Processing Environment for You, of this book.
In this chapter, we will cover the following topics:
- Acquire a free version of SAS
- Learn how to use SAS Studio, a web-based GUI for programming SAS
- An introduction to the SAS programming language
- Write and execute several SAS programs
- Understand the different levels of the SAS platform
- Learn about SAS data storage options
The co-founder and CEO of SAS, Dr. James H. Goodnight, sums up what SAS does with this quote:
"SAS is the first company to call when you need to solve complex business problems." -Dr. James H. Goodnight, SAS Institute Inc., CEO and co-founder
SAS helps solve business problems by being the best at applying advanced analytics, whether it's predictive analytics (otherwise known as data mining), forecasting, optimization, or a combination of some or all of them, in order to improve business processes and deliver more valuable data-driven information to decision-makers so they can make the best decisions possible to help grow their organizations. The fundamental value of analytics is in being able to increase revenue and/or cut costs, and ultimately, that's what SAS provides to its clients and their organizations.
Some people will come to this book with their own perception of what SAS is, which is fine. I hope this book will serve to open their minds to a broader understanding of what SAS is beyond what they may have thought prior to reading this book. People's perceptions of SAS are typically based on either their own experience of working with SAS as a programming language, or with talking to someone else who is or was a SAS Programmer within their organization. Many times, people's perceptions are partially accurate, but most of the time they are basing their perception on out-dated information.
For example, many people will tell you that you have to buy a SAS license in order to learn how to use it. This was true in the past, but no longer is accurate. You will learn shortly in this chapter how to a download, install, and use a free version of SAS so that you can have hands-on experience using SAS by doing the examples provided in this book. Another perception some people have of SAS is that you must always write code, which again is based on somewhat out-dated information:
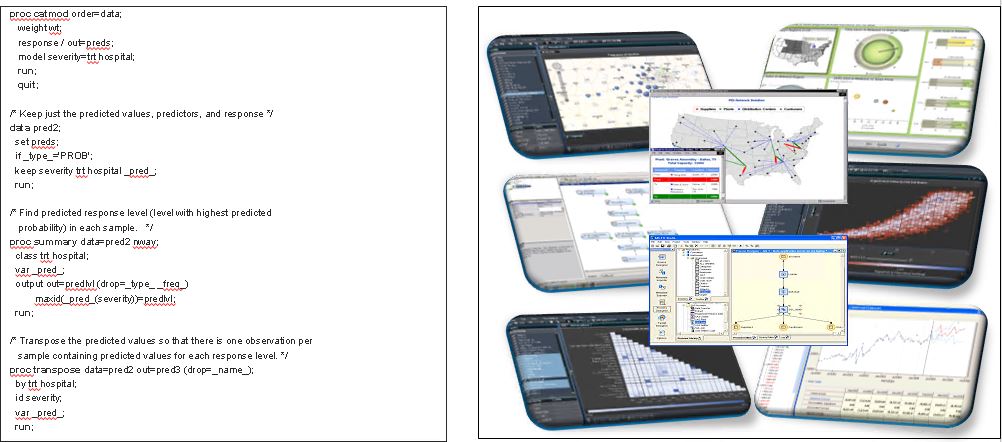
Figure 1.1: Perceptions of SAS
While it is true that you can write SAS code if you wish to, there are several ways to use SAS solutions via GUIs that provide easy-to-understand and drag and drop capabilities. Some will generate SAS code for you, while several of SAS's newer solutions are primarily driven via modern web-based interfaces that allow you to interact or integrate with other technologies via standard application program interfaces (APIs) such as Java, REST, Python, and even R. This book's primary focus is on teaching you some of the programming languages built into SAS; however, there will also be some overviews and references to some of the optional GUIs available within the SAS ecosystem.
The free version of SAS that you should use while reading this book is known as the SAS® University Edition, and is available for download from the main SAS website: https://www.sas.com/en_us/software/university-edition.html.
Download and install the software yourself, or launch it in the cloud via Amazon Web Services (AWS). There's no need to go through convoluted channels for software distribution. Here is the SAS® University Edition website: https://www.sas.com/en_us/software/university-edition.html
This free version is available for direct download for Windows, OS X, and Linux, as well as available via AWS. Please verify that for whichever version you want to use, your system meets the requirements listed here: https://www.sas.com/en_us/software/university-edition.html#m=system-requirements
- When you select
Get free softwareyou will activate this URL,https://www.sas.com/en_us/software/university-edition.html#m=get-free-software, and be presented with the following window:
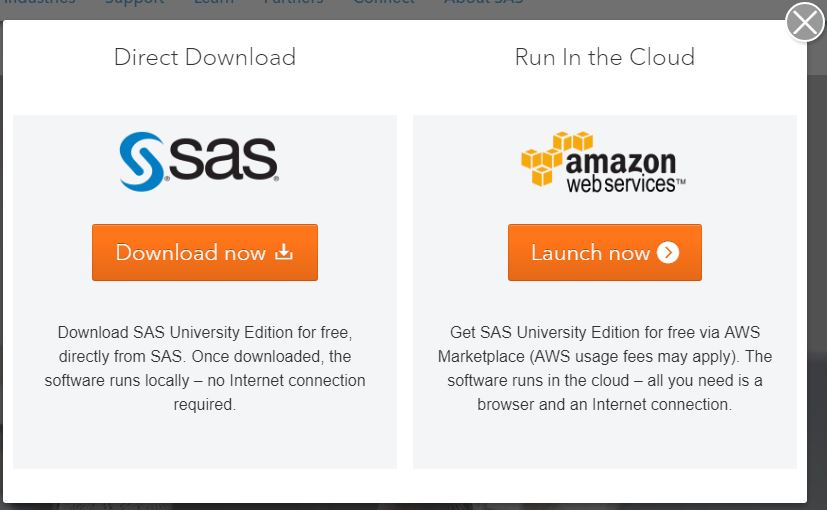
Figure 1.2: SAS® University Edition selection window
Note
Choose whichever option works best for you; however, for this book we will walk through and use the
Direct Download
option. On the next page, you should choose the operating system that you want to use: Windows, OS X, o
r Linux. For this book, we will choose Windows. It is recommended that the reader downloads the quick start guide and/or watches the video available at the given link.
- Now you will want to move on to the next step. Because SAS® University Edition is a virtual application (vApp), you need virtualization software to run it. You can download Oracle VirtualBox for Windows, a free virtualization software package, using the following link: https://www.virtualbox.org/wiki/Downloads?_sm_byp=iVVSgJ3HMfR7vg5r.
Note
In addition to Oracle VirtualBox, SAS® University Edition works with VMware Workstation Player virtualization software. If you prefer to use VMware Workstation Player, charges may apply. For this book, we chose to use the Oracle VirtualBox for Windows.
- After installing the Oracle VirtualBox, you should see the following screen when the VirtualBox application starts:
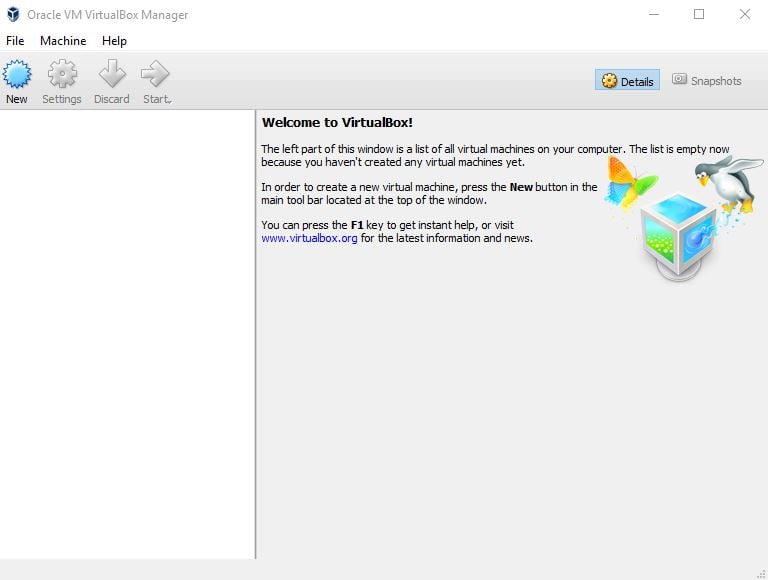
Figure 1.3: Oracle VirtualBox application
- Leave the Oracle VirtualBox and return to the download SAS® University Edition page and perform the next step, which is to download the SAS® University Edition vApp.
Note
If you don't already have a profile set up on www.sas.com, you will need to create one in order to download the SAS® University Edition vApp. It is important to note that the vApp is 2.0 GB in size, and as such you should plan to connect via as large a bandwidth as you have available to complete this step.
- After the SAS vApp downloads, you will need to import it into the Oracle VirtualBox. Once you select the SAS® University Edition from the list that pops up and select
Import, you should see something similar to this window:
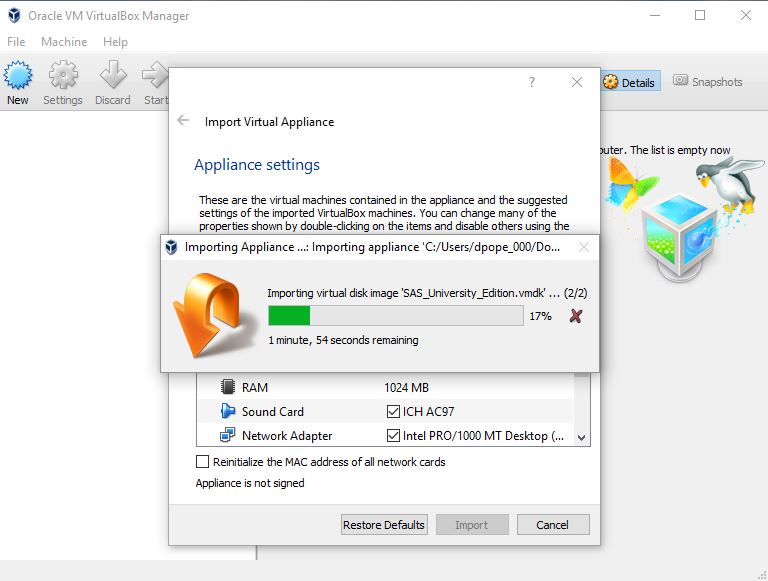
Figure 1.4: Importing the SAS® University Edition vApp into Oracle VirutalBox
- Once you have successfully completed importing the SAS vApp, the Oracle VirtualBox application should look like this:
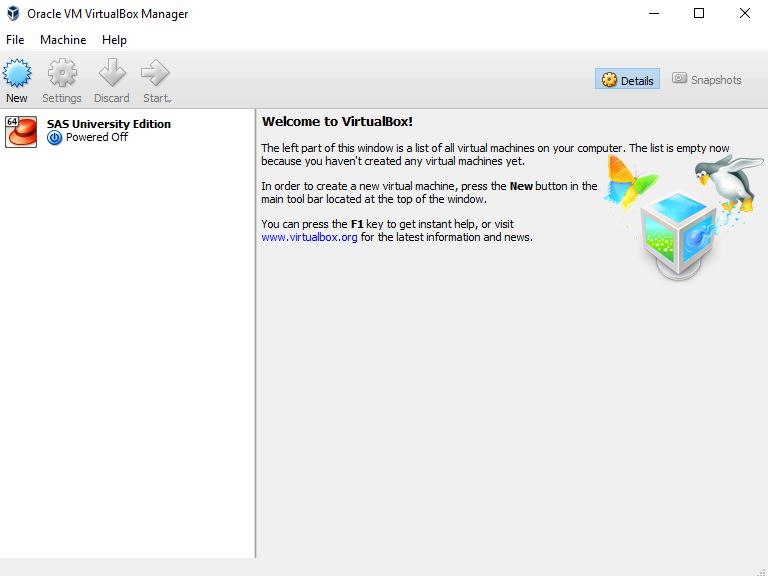
Figure 1.5: Completed import of SAS® University Edition vApp into Oracle VirtualBox
Note
Now you will need to follow steps 3, 4, and 5 listed in the SAS® University Edition quick start guide in order to make use of your SAS® University Edition. Make sure you use the exact folder names and case as stated in the guide. For this book we used C:\SASUniversityEdition\myfolders.
- Once you have completed step 4 in the SAS® University Edition quick start guide, you should see a window similar to this:
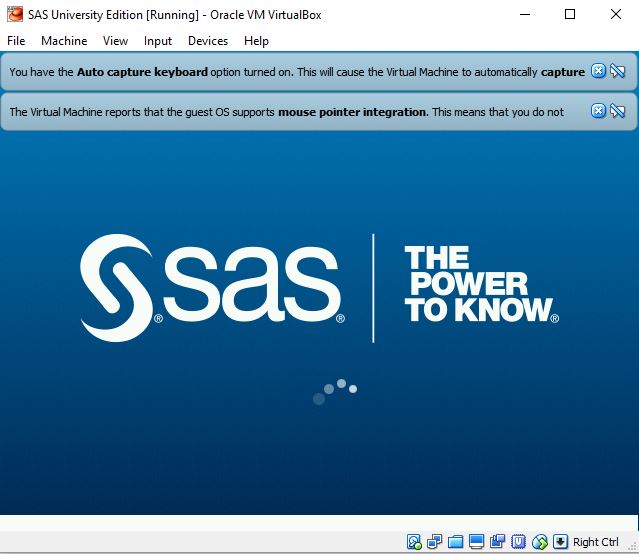
Figure 1.6: Successful start of the SAS® University Edition vApp
Note
You can minimize this window; however, don't close it until you are done with your current SAS session. Once you minimize it, you can start your SAS environment via one of the supported web browsers using http://localhost:10080.
Your web browser should look similar to this:
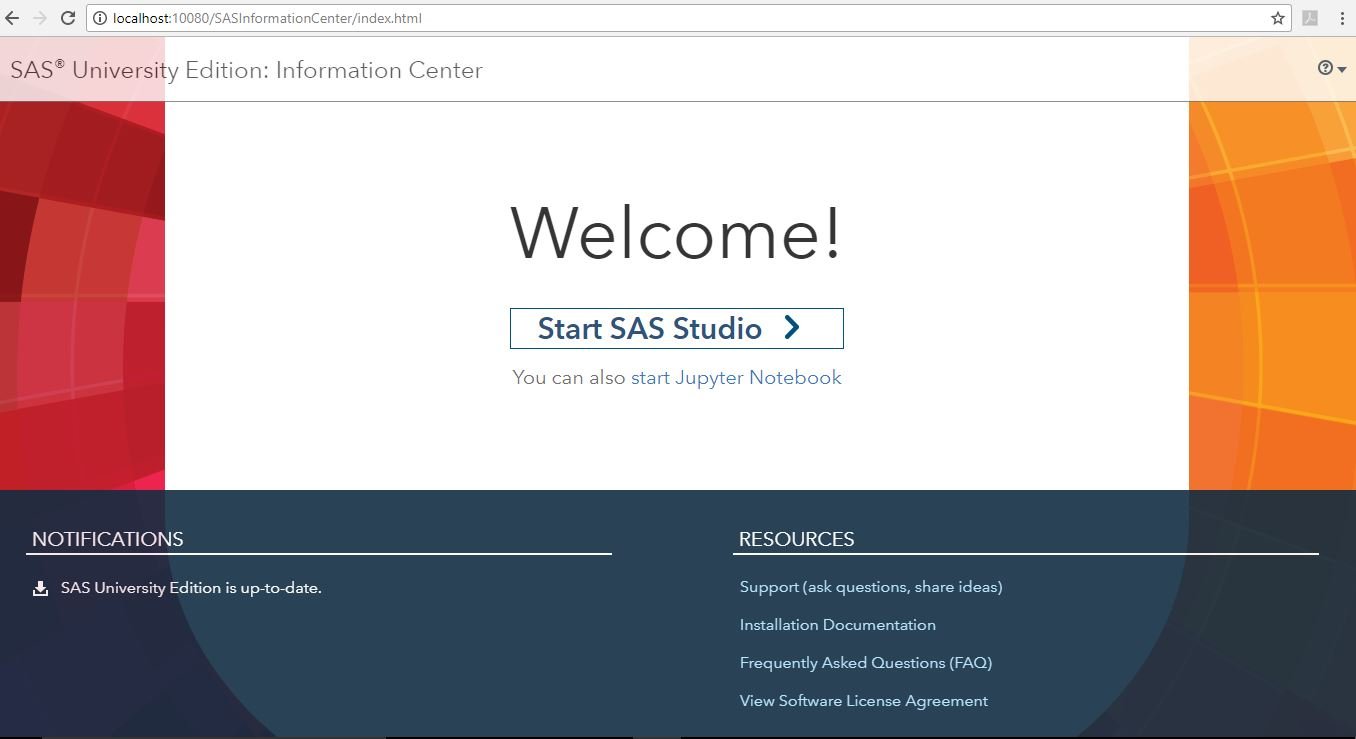
Figure 1.7: Successful start of your SAS environment from your web browser
Congratulations, you have successfully installed your free SAS® software and are now ready to begin learning your new skill, which will be your first steps in learning how to do big data analytics with SAS.
Note
SAS Studio is the newest GUI for writing SAS code and is a web-based thin client that in this case will be communicating with SAS, running within your SAS® University Edition vApp. This is just one example of how SAS has made complex work, such as client-server setup and installation, easy for their users.
Before we start getting familiar with the SAS Studio GUI, it would be best to provide the reader with a historical background of the interfaces to the SAS system. The SAS system was initially written and run on the mainframe back in the 1970s, and as such it worked with what is known as a command-line interface. This means there was no application window, but you could write one line of code and submit it, followed by your next line of code.
Interestingly enough, this command-line interface still persists today across all the operating systems that SAS runs on, which includes mainframes, Windows, and Unix/Linux. When SAS was rewritten in C in the 1980s, the original interface with SAS, which again still exists and is used today, was called the SAS Display Management System (DMS). Today, DMS is referred to as the SAS windows environment. This consists of three primary windows: a program editor for writing and submitting code, a log for debugging the submitted code, and an output window for displaying results. Today, you still have the capability of running SAS with DMS or with a NODMS option on several operating systems. One of the other most popular and commonly-used GUIs for SAS is known as SAS Enterprise Guide, which is a .NET-written Windows-only client that allows you to do quite a lot of SAS work using drag and drop functionality, and automatically generates SAS code for you for everything you do in the interface.
A more analytically advanced and data-scientist-focused interface for doing data mining within the SAS environment is known as SAS Enterprise MinerTM. Once again, this type of GUI provides the user with a lot of power within a drag and drop environment, and also provides self-documentation of the process, thereby helping one data scientist become much more productive from a time perspective than always having to hand-code and then self-document their work.
Why the history on the interface to SAS? Well, first of all you should want to be seen as an experienced SAS Programmer, and if you don't know about the SAS DMS, SAS Enterprise Guide, and SAS Enterprise MinerTM, then you will not be viewed as such. Second, as has already been stated, SAS is an analytic processing environment, and as such there is a variety of SAS solutions that provide their own business-purpose-focused GUI to interact with this single backend environment. These GUIs make it easier to perform specific tasks associated with the entire analytics lifecycle, whether it's data management and data preparation steps or data mining steps, or forecasting steps, or data visualization steps. What's nice about this is regardless of which way you interact with SAS, whether you program, interact through a GUI, or for that matter through an API or web service, from a governance and audit standpoint you are using the same set of tested and proven algorithms that provide consistent and repeatable results.
Once you start up SAS Studio, you'll see that the interface looks like this:
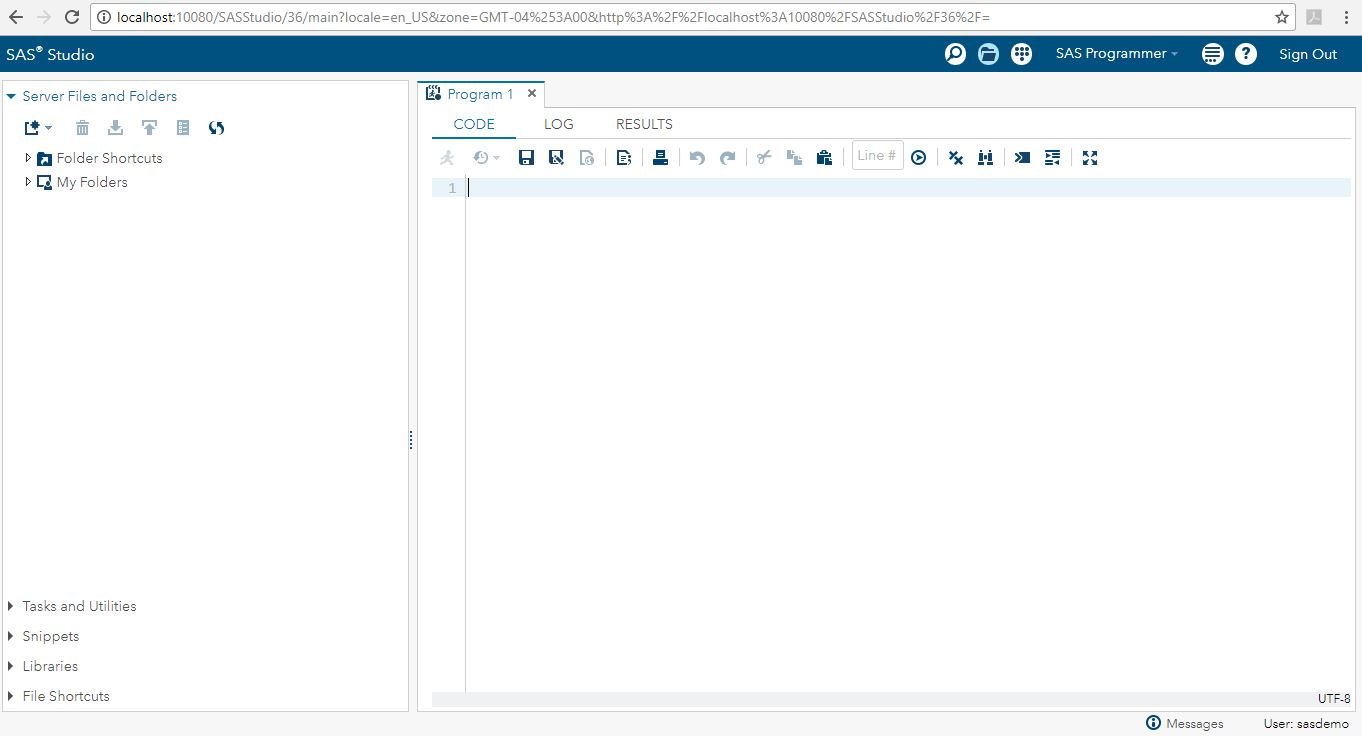
Figure 1.8: SAS Studio web based GUI
You will notice that the tabs in the right-hand window, or work area, are the tabs for Program1 and are labeled CODE, LOG, and RESULTS, which basically correspond to the DMS program editor, log, and output windows. This is another example of SAS modernizing their software, but enabling their current users to still feel comfortable and to continue to leverage their existing skills in the new SAS environment, while at the same time providing new SAS users with a modern way of working with SAS. You will spend most of your time in the coding examples in this book submitting code via the CODE tab and reviewing its execution in the LOG tab.
The left-hand side of SAS Studio is the navigation pane, and by default the
Servers Files and Folders
section is open. The other sections are
Tasks and Utilities
,
Snippets
,
Libraries
, and
File Shortcuts
. Across the top in the dark blue banner you will see several icons, which stand for search, open, new options, a toggle between SAS Programmer and Visual Programmer views, More application options,
Help, and finally, the Sign Out item. We will primarily make use of the default SAS Programmer view for the examples within this book; however, the Visual Programmer view provides a process view and self-documentation of the workflow involved with your program. Feel free to explore all the help items associated with SAS Studio to learn more about this GUI for SAS coding.
The paper SAS302-2014, Introduction to SAS® Studio, Michael A. Monaco, Marie Dexter, Jennifer Tamburro, SAS Institute Inc., Cary, NC, http://support.sas.com/resources/papers/proceedings14/SAS302-2014.pdf, describes the server files and folders as follows:
The Folders section of the navigation pane enables you to access your folders, create folder shortcuts, download and upload files, and create new SAS programs. You can expand and collapse folders, and you can open items in the folders, such as a SAS program or table, by double-clicking them or by using a drag-and-drop operation to move them to the work area.
The Folders section of the navigation pane references files that are stored on the same machine as the SAS server. These files can be downloaded to your workstation. Local files on your workstation must be uploaded to the server in order to be used with SAS Studio.
Similarly, the paper SAS302-2014 Introduction to SAS® Studio, Michael A. Monaco, Marie Dexter, Jennifer Tamburro, SAS Institute Inc., Cary, NC, http://support.sas.com/resources/papers/proceedings14/SAS302-2014.pdf describes the tasks and utilities as follows:
The Tasks section of the navigation pane enables you to access tasks in SAS Studio. Tasks are based on SAS procedures and enable you to generate SAS code and formatted results, based on the entry of user-supplied inputs and parameter values. SAS Studio is shipped with several predefined tasks that you can run. You can also edit a copy of a predefined task, and you can create your own new tasks.
As stated by the paper SAS302-2014 Introduction to SAS® Studio, Michael A. Monaco, Marie Dexter, Jennifer Tamburro, SAS Institute Inc., Cary, NC (http://support.sas.com/resources/papers/proceedings14/SAS302-2014.pdf).
The Snippets section of the navigation pane enables you to access your code snippets, which are samples of commonly used SAS code that you can insert into your SAS program. SAS Studio is shipped with several predefined code snippets that you can use. You can also save copies of these snippets and edit them to create your own custom snippets.
The paper SAS302-2014 Introduction to SAS® Studio, Michael A. Monaco, Marie Dexter, Jennifer Tamburro, SAS Institute Inc., Cary, NC, http://support.sas.com/resources/papers/proceedings14/SAS302-2014.pdf also states this:
The Libraries section of the navigation pane enables you to access all of your SAS table libraries and their contents. You can expand a table and view the columns in that table. The icon in front of the column name indicates the data type of the column. In addition to viewing the column names, you can use a drag-and-drop operation to move the columns from the tree directly into your SAS code.
Libraries in SAS are pointers to datasets (or tables). Within SAS, they will all look the same regardless of whether they are SAS datasets or data stored in a database or other data storage systems, such as Hadoop or SAP HANA. Datasets are referenced in SAS code by library-name.dataset-name. For example, open the Libraries section and expand My Libraries to see the following:
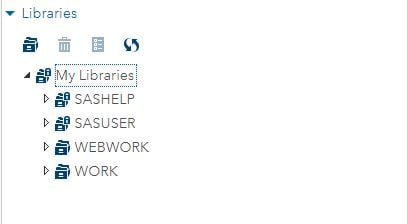
Figure 1.9: Default SAS libraries in the SAS Studio Libraries section
SAS libraries can either be permanent, which means the tables stored in them are saved as permanent tables within whatever type of data storage that library is associated with; or they can be temporary, such as WEBWORK and WORK, which means the data tables stored in these libraries will be deleted when your SAS session ends. SAS uses the WORK library to store intermediate tables that SAS may need to create in the process of executing SAS code. Expand SASHELP and you will see a lot of default data tables that are shipped with SAS. We will make use of some of these tables in the exercises associated with this book. Right-click on the SASHELP library and select Properties. In this case, you will see a list of physical path locations or directories in which all the data tables displayed under SASHELP are stored. In this case, SASHELP is a concatenated list of several physical directories. In most cases, SAS libraries either point to a single physical directory or a particular schema within a database system. The directories or database system is where the physical data tables are actually stored.
The paper SAS302-2014 Introduction to SAS® Studio, Michael A. Monaco, Marie Dexter, Jennifer Tamburro, SAS Institute Inc., Cary, NC, http://support.sas.com/resources/papers/proceedings14/SAS302-2014.pdf has described file shortcuts as follows:
File shortcuts, also known as SAS File References, enable you to quickly access files. You can create a file shortcut to a file on your SAS server or via a URL.
The core foundation of SAS technology is known as BASE SAS. All other modules or SAS solutions are built on top of this foundation. As mentioned previously, the SAS programming language is made up of two main parts—the SAS data step, and hundreds of SAS procedures, which are typically referred to as PROCs. BASE SAS also contains a SAS macro language, the new SAS FedSQL language, which is a SAS proprietary implementation of the ANSI SQL:1999 core standard, the relatively new DS2 language, which is an object-oriented multiple thread language (that we will learn more about in Chapter 6, Other Programming Language in BASE SAS® Software of this book), as well as the Output Deliver System (ODS), which can be used to programmically produce output in many different formats and will be discussed further in Chapter 5, Reporting with SAS® Software, of this book. From a historical perspective, SAS also had another language know as Screen Control Language (SCL) which was also object-oriented and was primarily used behind applications initially built with SAS/AF® software and then evolved into being able to be used behind web-based applications built in a variety of different languages, such as HTML, Java, JSP, ASP, and others.
This book will focus on providing you an introduction to the SAS data step, some SAS procedures, a little bit of SAS macro, and some DS2 and FedSQL. For more details and deeper dives into any of these individual topics, there are plenty of books and user-written papers that have been written to address these as individual topics.
Are you ready to begin building your SAS programming skills? As has been a tradition in learning any new programming language, we will write some SAS code that will print Hello World. This is quite easy to do, and all you need to do to start is to get into your SAS Studio, and, using the right-hand pane, make sure you have the CODE section of your Program1 tab highlighted and then type the following SAS data step code:
/* This is one way to add comments to your code */
data _null_;
   text="Hello World";
   put text;
run;
* here is another way to add a comment or to comment out code;
Notice that the code window automatically changes the color of various parts of the code to make it easier for you to identify specific parts. For example, both the comments are green, SAS key or reserved words are bold and dark blue, SAS statements such as the put statement are a lighter blue, variable names are black, and character values are purple. Every executable line of SAS code ends with a semi-colon and a data step starts with the keyword data and ends with the run statement. Before submitting or running this code, there a few other parts of the code that should be explained. Typically, the data keyword will be followed with the name of the data table you want the code to create, and it takes the form libraryname.tablename. For example, the statement data work.temp; will instruct SAS to create a data table in the temporary SAS library named WORK and name that table
temp. In this case, _null_ is a special reserved word that instructs SAS to execute the data step code, but doesn't save the results into any data table.
Now, submit the code by either clicking on the running man icon on the CODE toolbar or by pressing the F3 function key. You should see a window pop-up stating Running, and then be presented with this in SAS Studio:
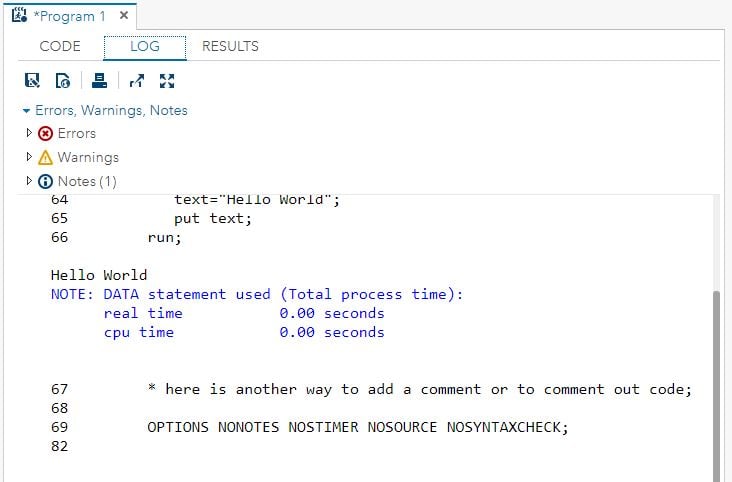
Figure 1.10: Log after submitting your Hello World data step program
As long as there was not a syntax error in your code, there should only be some blue-colored notes, the code you submitted, and the text Hello World printed out in the LOG. Congratulations on having successfully written and submitted a SAS program! Notice that similar to the color coding used in the CODE tab, the LOG tab uses color to help debug or make it easier to read how the code executed. Errors will show up in red, warnings in green, notes in blue, and code will be in black. In addition, a nice feature of the LOG tab in SAS Studio is that it will provide you with a linked index listing of any of the errors, warnings, or notes that occurred so a user can easily jump to that line in the log to help review and resolve them quickly. Click on the RESULTS tab and note that nothing showed up here. Why didn't the Hello World result show in the RESULTS tab? The RESULTS tab is used to show results to an end user that come from SAS PROCs, not from the put statement that was used in the data step program.
Move back into your
CODE tab and use the double
Xx
in the CODE tool bar to clear all code. Now type the following code:
proc print data=SASHELP.CARS (obs=10);
run;
proc print will print out all the rows of the data table you specify in the data part of the statement. In this case, one of many dataset options, obs is being used to instruct the proc to only perform its functions on the first 10 observations. Submit this code and the results should appear in the RESULTS tab:
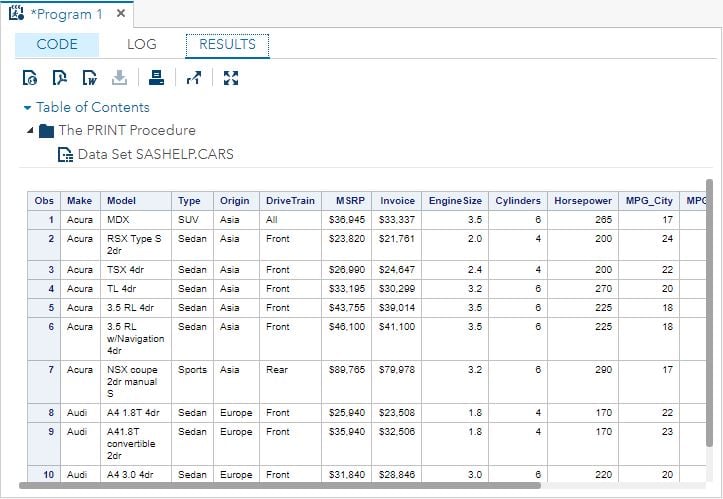
Figure 1.11: Results from proc print
Congratulations on executing a SAS PROC in a SAS program! Trust me, you will learn to appreciate and maybe even love PROCs, as they save a programmer a lot of time. Think for a moment about the small amount of code that was submitted, which printed out a subset of rows from a data table. How much code would have had to be written in any other language to achieve the same result? Yes, SQL could be used, but I doubt it could be done using less code.
Furthermore, the code window provides syntax completion for the programmer so that as you type, the programmer will be prompted for what SAS expects are valid parts of the code being written. This feature is quite useful, especially for new programmers or for experienced programmers starting to use a new PROC they may not be familiar with yet, because it gives a list of options that can be used with that particular PROC. As a programmer gains more experience, they may turn this feature off, which can easily be done by selecting the More application options icon to the left of the Help question mark icon in the top right-hand corner of SAS Studio and selecting Preferences:
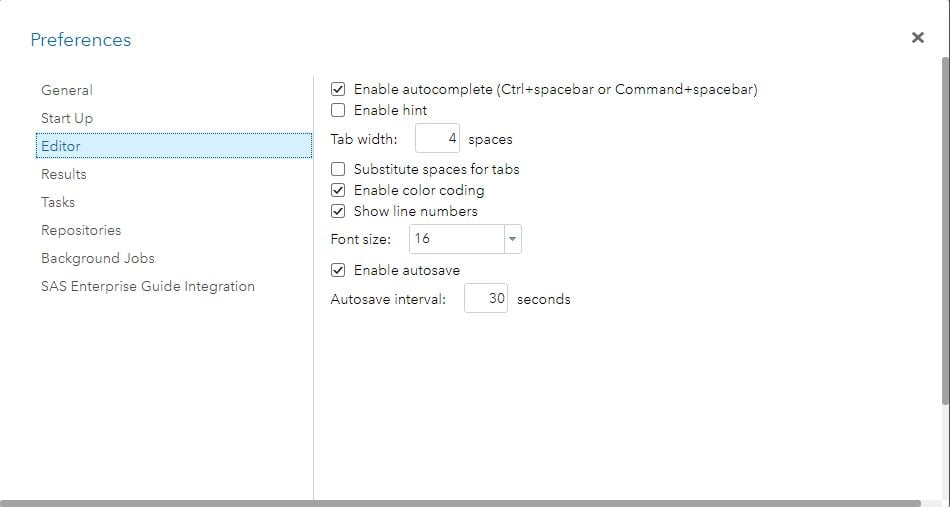
Figure 1.12: Code tab (Editor) preferences window
If the programmer wants to disable the code completion feature with the CODE tab, simply uncheck the Enable autocomplete (Ctrl+spacebar or Command+spacebar) box. To toggle this feature on and off while in the CODE tab writing code, a programmer can use either of these shortcut key combinations to accomplish this: Ctrl+spacebar or Command+spacebar.
Move back into the Program1
section and the CODE tab. Let's verify that programs and data tables can be saved within the SAS environment. SASUSER is a permanent SAS library that is created automatically for each user, and in this virtual SAS server environment, this library should have been allocated to the shared folder that was set up as C:\SASUniversityEdition\myfolders\sasuser.v94. Select the Save As icon from the CODE toolbar, expand My Folders, select sasuser.v94, and change the program name to Proc_print:
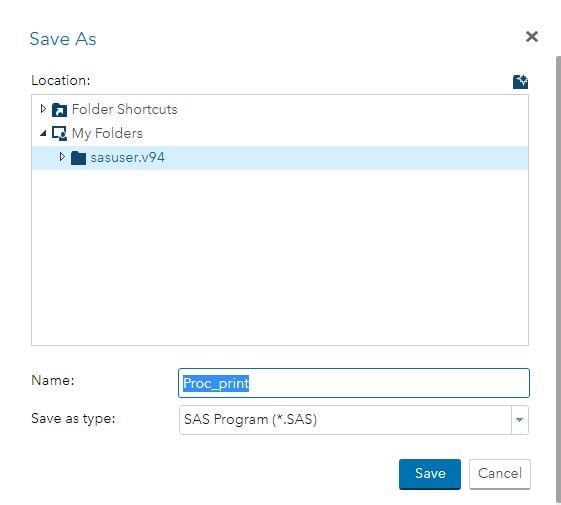
Figure 1.13: Save as window
Select Save and then verify that it automatically showed up under the Server Files and Folders section of the left-hand pane of SAS Studio and as a physical file in the C:\SASUniversityEdition\myfolders\sasuser.v94 directory:
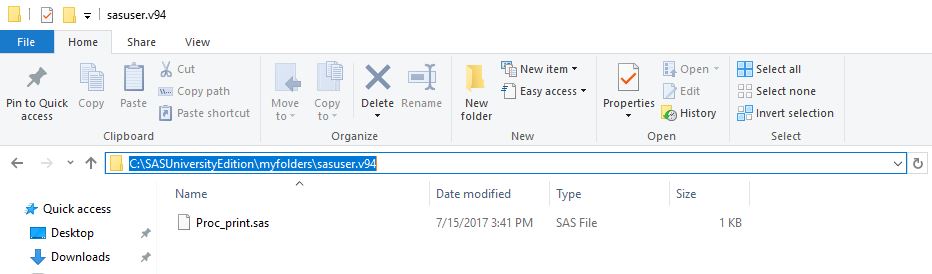
Figure 1.14: Proc_print.sas stored as a physical file on a PC
Move back into SAS Studio, and on the left-hand pane under the Server Files and Folders select the New icon and then select SAS Program(F4). SAS Studio allows a user to have multiple programs open at the same time and each program will have their own CODE, LOG, and RESULTS tabs:
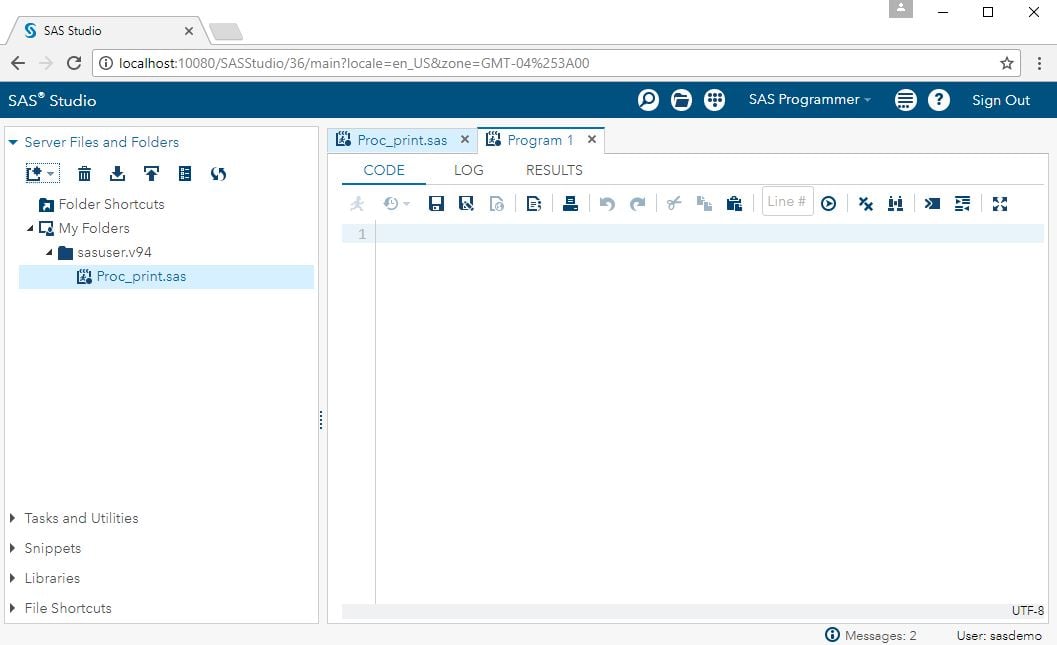
Figure 1.15: SAS Studio showing two program sections
Now, copy some data from the SASHELP library into the WORK library using both data step code and a PROC. Type in the following code into the CODE tab of the new Program 1 section:
/* Data set code to copy a data table */
data WORK.MYCARS;
   set SASHELP.MYCARS;
run;

/* PROC code to copy a data table */
proc copy out=WORK in=SASHELP;
   SELECT CLASS;
run;
Note
The more a programmer learns about the SAS language, they will discover that typically there is more than one way to accomplish a task or solve a problem using SAS. This shows the great flexibility a programmer is offered within SAS; however, there are some who may get frustrated trying to figure out which way is the best. This as a strength because not everyone thinks the same, and as a result SAS, provides different users different avenues that ultimately lead them to solve the issue at hand using the methods that make sense to them. After the problem is solved and if the programmer has the time, they can always go back and refine the code.
Submit this code and notice that SAS Studio adds an additional tab to your Program 1 section labeled OUTPUT DATA:
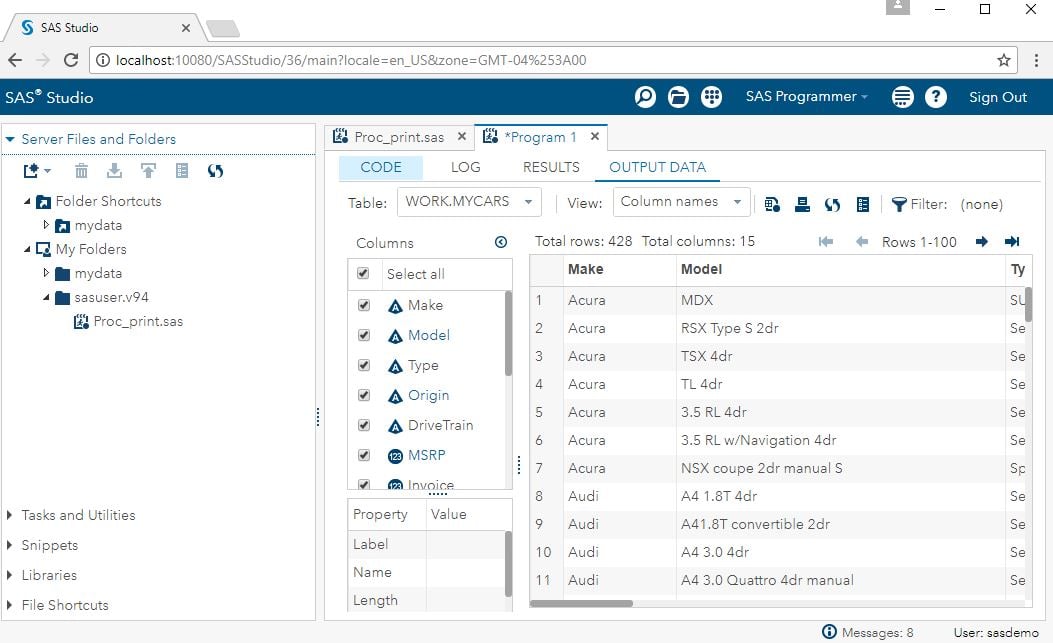
Figure 1.16: SAS Studio OUTPUT DATA tab
The SAS Studio user can toggle between both of the datasets created by this code with the Table drop-down list. This tab also shows the columns or variables within the tables and shows the user what the rows look like within the datasets.
There is a special SAS program file called autoexec.sas. This file allows an individual user or a server administrator to put any type of SAS executable statement in it, and whenever the individual starts a SAS session or, for a server, whenever the server is started, then the code in this file executes automatically. On a server, this makes it easy to set up consistent libraries that are named the same for multiple users, which saves time and resources because there is only one connection/pointer needed for a particular data source, instead of multiple libraries from multiple users making multiple connections to a single data source.
Likewise, at the individual user level, this empowers the user to set up libraries, create data, create user-defined formats, and/or create SAS macros that they themselves use all the time. SAS Studio provides the user with access to their own autoexec file through the More application options icon located in the top right-hand corner to the left of the Help question mark icon. Select the icon for More application options and select Edit Autoexec File:
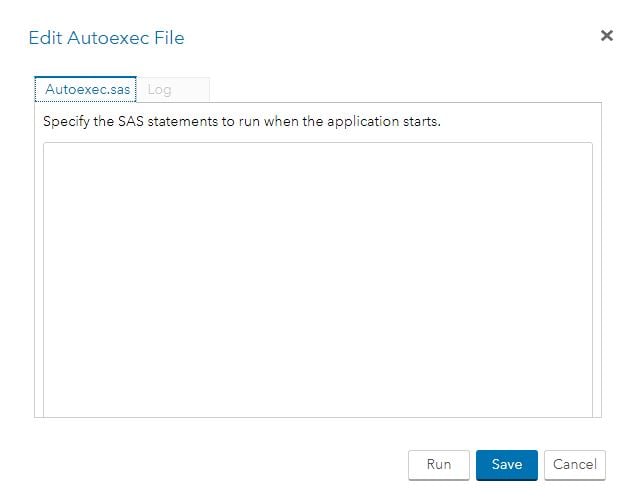
Figure 1.17: SAS Studio autoexec
There are two tabs Autoexec.sas and Log. The Autoexec.sas tab is simply a special code pane, and the Log allows you to debug any code that is put in the Autoexec.sas pane and Run.
In this book, the reader will primarily use the SAS Programmer perspective; however, SAS Studio also provides a Visual Programmer perspective, which is designed for users who would prefer to work with process flows in a project-based environment. In the upper right-hand corner of SAS Studio, right-click on SAS Programmer and then switch to the Visual Programmer perspective:
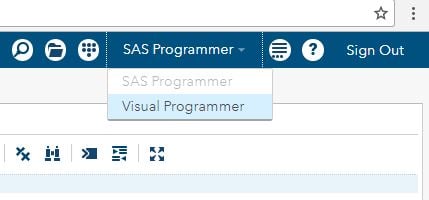
Figure 1.18: Switching between SAS and Visual Programmer persceptives
Notice how the right-hand side of SAS Studio changes from a Program 1 section with CODE, LOG, and RESULTS tabs to a Process Flow 1 section with FLOW, RESULTS, and PROPERTIES tabs:
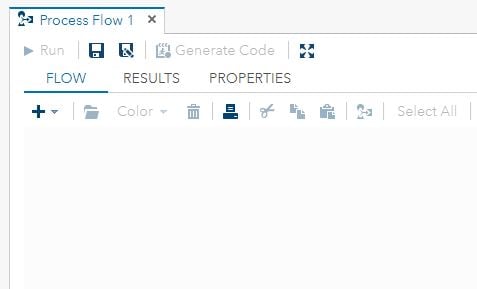
Figure 1.19: SAS Studio process flow section
The reader can now build a process flow using drag and drop functionality. On the left-hand side of SAS Studio, select/expand Libraries and select/expand SASHELP, which will provide the user with a list of default datasets that come with SAS:
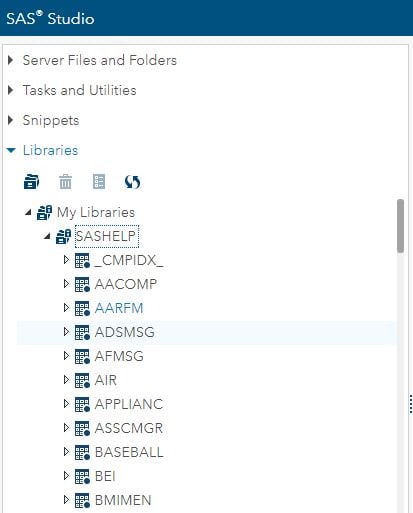
Figure 1.20: SASHELP library
Left-click and hold down on the AIR dataset and drag this over to the Process Flow 1 section and drop it:
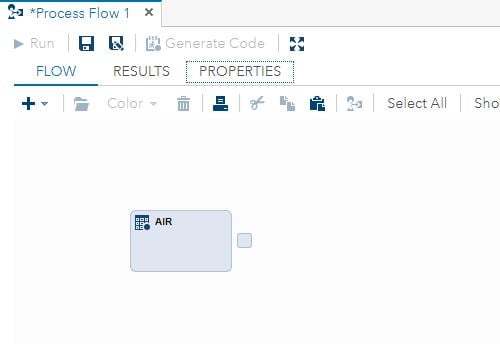
Figure 1.21: The AIR dataset graphically represented within a process flow
Note
Notice a block representing the AIR dataset is created on the process flow. This is not a copy of the AIR dataset, but simply a graphical representation of the table within the process flow that the reader is building.
To continue building a simple process flow, the user should now select/expand Tasks and Utilities on the left-hand side of SAS Studio and select/expand Tasks. As the user did for dragging and dropping the SASHELP. AIR dataset onto the process flow, drag and drop the List Table Attributes task to the right of the AIR table and then connect the two icons by left-clicking and holding on the control point, the little square, on the right side of the AIR icon, and drag the arrow over to connect it to the control point on the left side of the List Table Attributes icon:
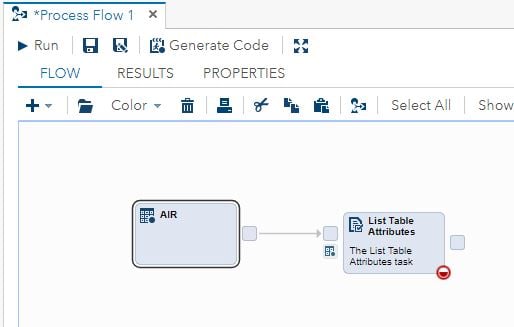
Figure 1.22: Process flow with two icons connected
The Run icon of the Process Flow 1 section should have ungrayed now that a table has been connected to a task; however, you will notice the task has a red half-filled circle icon in the lower right-hand corner. The red circle means that the task's properties have not yet been generated or manually added. Select the
Run
icon and the user should see the following popup window:
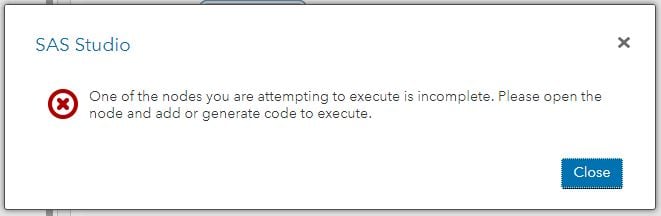
Figure 1.23: Process flow popup information window
To resolve this situation, select Close and then right-click the List Table Attributes icon and select Open. Once the user does this, SAS Studio generates the necessary code for this task and the reader should see the following window:
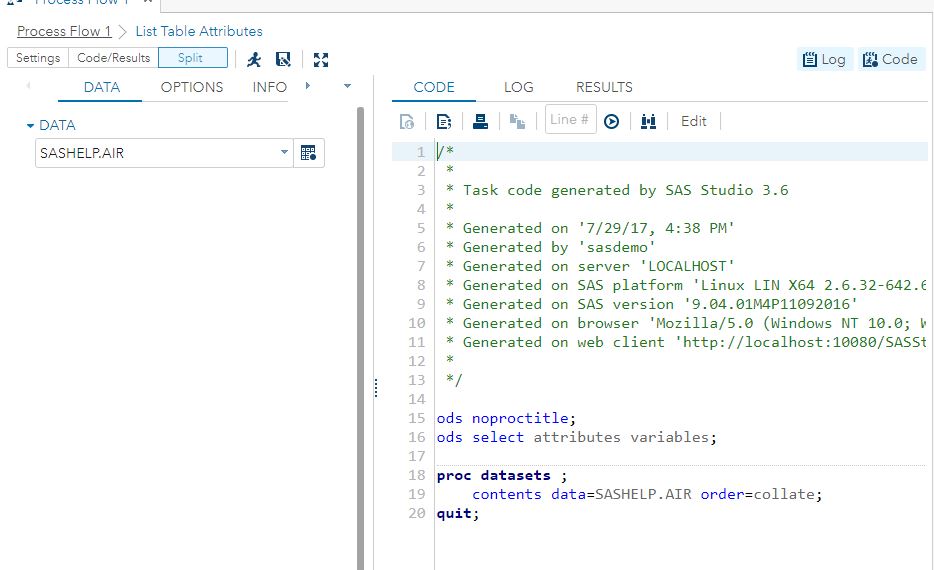
Figure 1.24: SAS Studio Auto-Generated Task Code
Select Process Flow 1 in the upper left-corner to return to the process flow and now select Run. A popup window that says Running will appear while the process flow executes. Select the RESULTS tab, and it will provide the status and time of each executable step in the flow:
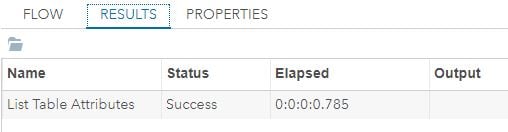
Figure 1.25: Process Flow Results
Click back on the Process tab and right-click on the List Table Attributes icon and select Open:
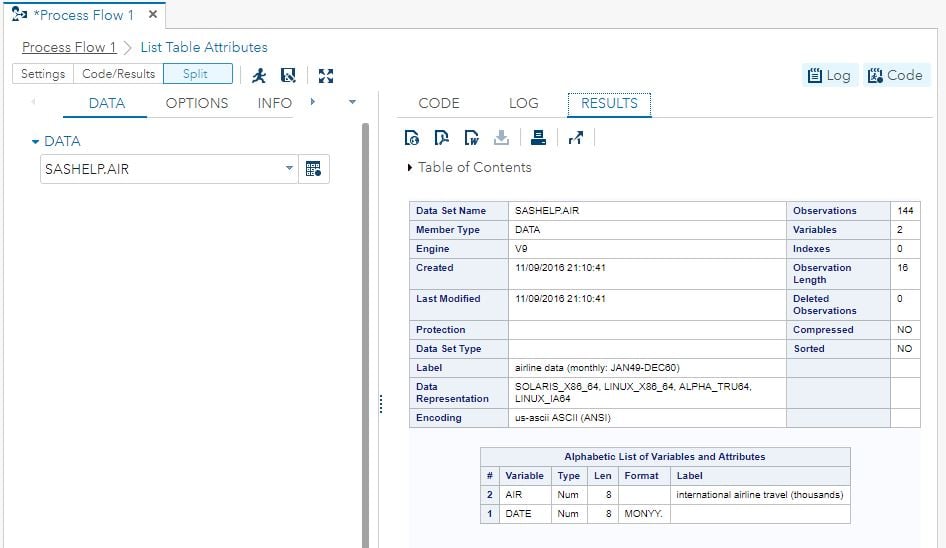
Figure 1.26: List Task Attributes results
When the List Table Attributes task opens this time, instead of the CODE tab being active and seeing the SAS Studio auto-generated code, the RESULTS tab is active and displays the output from the code that ran successfully when the user ran the process flow. Switch SAS Studio back to the SAS Programmer perspective using the drop down list in the upper right-hand corner.
Since SAS is an analytic platform with many modules and solutions, let's see which pieces of the SAS environment are included in the SAS® University Edition. Return to the Program 1 section and clear all the code using the Xx icon on the CODE tab toolbar. Type the following code in the CODE tab:
/* This lists the SAS foundation products that are installed on your system */
/* along with their version numbers.                                        */
proc product_status;
run;

/* This lists the SAS products that have been licensed and the date through */
/* which the licensed software is valid.                                    */
proc setinit;
run;
Click and highlight only the proc product_status; run; part of the code and submit this by selecting the running man icon from the CODE tab toolbar.
Note
A programmer can submit specific lines of code by simply highlighting the pieces of code they would like to execute and then selecting the running man icon.
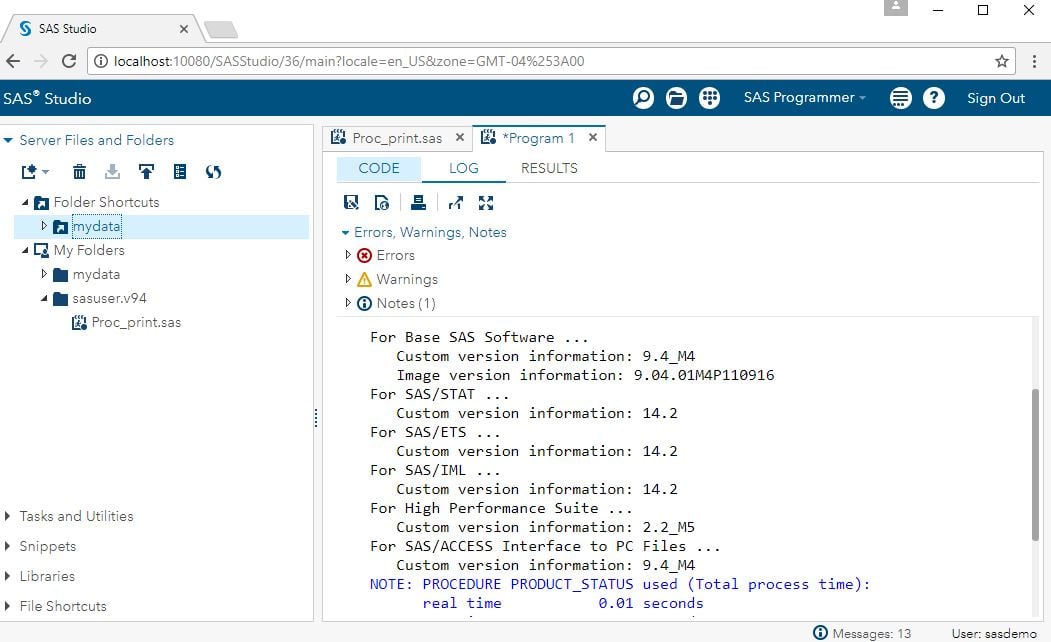
1.27: PROC product_status results for SAS® University Edition
As the results show, the SAS® University Edition contains custom versions of BASE SAS, SAS/STAT® software, SAS/ETS® software, SAS/IML® software, High Performance Suite, and SAS/ACCESS® Interface to PC files based on the SAS 9.4 M4 (Maintenance 4) release. Feel free to submit the older version proc setinit; in order to compare the output from the two different PROCs.
Please take some time to review the SAS product documentation by selecting the question mark icon in the upper right-hand corner of SAS Studio. This will take the user to an index listing of documentation for all SAS products and will help the user to understand the broad and deep power that the SAS language brings to solving business issues. Simply by looking at the listing of all the PROCs included in BASE SAS, a programmer should understand why this particular book will not be providing you a complete understanding of all the PROCs in any one of the included SAS products.
However, this book will provide the reader with a thorough understanding of SAS, and how once a programmer learns some of the SAS language, how easy it is to leverage the knowledge gained here in order to continue to learn other parts of the SAS system over a programmer's entire career.
At a high level, here are what the different pieces of the SAS® University Edition do—BASE SAS provides the bulk of data access, management, and preparation capabilities; SAS/STAT adds powerful descriptive and predictive analytics; SAS/ETS adds powerful forecasting capabilities; and SAS/IML adds matrix algebra and some optimization capabilities.
The SAS language originally started out as a bunch of tools, such as BASE, SAS/STAT, SAS/GRAPH, and SAS/ETS. These tools are what many today refer to as foundation (SAS) tools. Today, the simplest bundle of SAS® software is known as SAS Analytics Pro and contains BASE, SAS/STAT, and SAS/GRAPH. In the mid-1990s, SAS developed a metadata-based platform, at the heart of which lies what is called SAS Integration Technologies, which evolved into the SAS Intelligence Platform. It was on top of this metadata layer and foundation tools that several horizontal SAS solutions were developed. Chief among these horizontal solutions are SAS Enterprise MinerTM, the gold standard in providing an easy-to-use intuitive descriptive and predictive analytics GUI, and SAS Forecast Server, which provides an easy-to-use intuitive GUI for forecasting.
The reason these are described these as horizontal solutions is because they are used to solve their respective types of business issues across all industries. Around the year 2000, SAS started bringing to the market, at their customer's requests, what are referred to as vertical solutions. These solutions are built from a combination of the horizontal metadata-based solutions and the foundation tools. They are designed purposefully to address a specific business issue either in a certain department, such as marketing, or for a specific industry problem. Some examples of these types of vertical solutions are load forecasting in utilities and anti-money laundering in financial services. Typically, these solutions also contain intellectual property in the form of a data model that aligns well with the data needed to solve the business issue at hand.
As the age-old saying goes, a picture is worth a thousand words, so here is an image of the three levels that were just described:
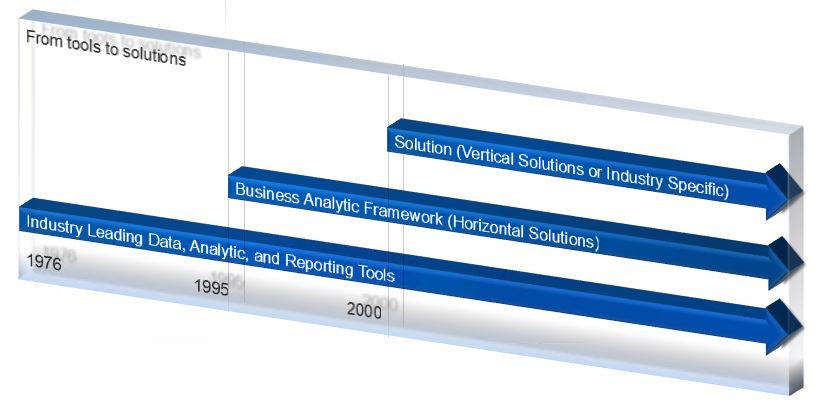
Figure 1.28: Evolution from tools to solutions
There are several aspects of data storage within the SAS environment and how the data storage helps to optimize how the overall system processes the data.
The simplest storage is a SAS dataset, and it is made up of observations (rows) and variables (columns).
Note
A SAS variable can be either numeric or character, and the number of bytes required to store variables can be set or controlled by the LENGTH statement.
Note
The DS2 language was developed to allow the processing of a more extensive variable and natively supports ANSI SQL data types for precise data manipulation.
Numeric variables in SAS are stored in default lengths of 8 bytes, while character variables are stored 1 byte per character for a single byte character set and, two bytes per character for double byte character sets. SAS stores numeric data using floating point notation. By reducing the length of variables, one can help reduce both the amount of physical data storage needed as well as reduce the Input/Output (I/O) operations needed to read and write the data. While working with small datasets, this may not seem that important, but as you move into working with larger and larger sized data, or big data, the ability to be as efficient as possible with both reading/writing and storing the data becomes extremely important. The more efficient you are able to be with data, the faster your programs will execute, which results in delivering important and valuable information to decision-makers so they can make use of it in making better, more informed decisions. SAS datasets also have a COMPRESS option, which can be used to save storage space. Compression reduces the number of bytes needed to represent each observation.
Note
A compressed dataset may require less storage space and fewer I/O operations to do reads/writes during processing; however, additional CPU resources may be required to access compressed files compared to uncompressed files.
If a file has very short records or there are no character variables with blank spaces to be compressed, then compressing the SAS dataset may result in a larger file.
Another option to store SAS datasets is to use the Scalable Performance Data (SPD) Engine. The Resources /
Focus Areas / Scalability & Performance section on support.sas.com, http://support.sas.com/rnd/scalability/spde/index.html describes SPD Engine as follows:
The purpose of this engine is to speed the processing of large data sets by accessing data that has been partitioned into multiple physical files called partitions. The SPD Engine initiates multiple threads with each thread having a direct path to a partition of the data set. Each partition can then be accessed in parallel (by a separate processor) which allows the application to analyze data in parallel, as fast as the data is read from disk. This can effectively reduce any I/O bottlenecks and substantially decrease the elapsed time to process data.
Note
If you don't have multiple CPUs or cores the SPD Engine will not provide you any benefit. It was initially developed to help PC users take advantage of the multiple CPUs within their individual PCs.
The SPD Engine evolved from the SPD Server product; therefore, many of its feature are derived from SPD Server. SPD Server supports a client/server environment requiring multiple SAS sessions. It also provides more functionality than the SPD Engine. However, the need to bring support of partitioned data into Base SAS resulted in the creation of the SPD Engine. Unlike SPD Server, the engine runs entirely in the same SAS process or session as the rest of your SAS job.
The Resources / Focus Areas / Scalability & Performance, section on support.sas.com
http://support.sas.com/rnd/scalability/spds/index.html describes the SPD Server as follows:
SPD Server provides a high performance data store of very large SAS data sets. The Scalable Performance Data Server (SPD Server) is a client/server, multi-user data server designed to optimize storage and to speed the processing of large SAS data sets. SPD Server does this by parallelizing many of the SAS I/O functions. SPD Server requires an SMP machine and is designed to use all resources available on the machine to achieve maximum scalability.
Note
SPD Server and SPD Engine predated open source solutions like Hadoop by many years. This SAS technology has been evolved to integrate and work within the Hadoop ecosystem. This is just one way SAS technology has proven itself to be flexible and agile in its ability to work with new technology as it becomes adopted as part of an organization's IT infrastructure.
As a matter of fact, as stated in The SAS® Scalable Performance Data Engine: Moving Your Data to Hadoop without Giving Up the SAS Features You Depend On, by Lisa Brown, SAS Institute https://support.sas.com/resources/papers/proceedings15/SAS1956-2015.pdf, if you currently use the Base SAS® engine or the SAS® SPD Engine, then using the SPD Engine with Hadoop will enable you to continue accessing your data with as little change to your existing SAS programs as possible.
Another example of SAS' commitment to innovation and continuous development of new technology was the introduction of a its own special data storage format for Hadoop, called SAS HDAT. As described in What's New in SAS® Data Management, by Nancy Rausch, SAS Institute Inc., Cary, NC; Malcolm Alexander, SAS Institute Inc., https://support.sas.com/resources/papers/proceedings13/070-2013.pdf SAS HDAT is highly optimized for fast load of data into SAS in-memory based analytic solutions built on either the SAS LASR server in SAS 9 or the new SAS Viya Cloud Analytic Server (CAS). SAS can write data in this format from any SAS system.
One very important feature of the SAS language and its data storage is the concept of the format and informat. Formats tell you how to display stored data, and informats tell you how to read them. While some programming languages provide limited formatting capabilities, SAS provides a robust and user-expandable system of formats. As a result, formats and informats play a far more valuable role within SAS than they do in other languages.
Within SAS, there are two types of formats/informats: those that are supplied by SAS called system formats, and those that allow a SAS Programmer to extend the system called user-defined formats. Because formats provide another method for storing and using information, they are important to understand and use as a SAS Programmer. When we start discussing SAS in-database technology in Chapter 7, SAS® Software Engineers the Processing Environment for You of this book, formats are a piece of SAS that you can push down into a massively parallel processing (MPP) data storage system such as an MPP database or Hadoop, and use them to extend the functionality of those systems just like they do within the SAS environment.
SAS date and time variables are stored in SAS as numeric data. Storing dates and times in this numeric form makes it easier to deal with interval calculations, but can present a problem when using the raw data in a report or when printing it out. Dates are expressed as integers and indicate the number of days since January 1, 1960. Time variables are represented as the number of seconds since midnight. Variables that contain both date and time parts and are referred to as datetime variables. Datetime variables indicate the number of seconds since midnight on January 1, 1960. This is why it is important to understand and use the date and time related formats and informats so the data is represented in a familiar looking format that is easy for users to understand. Once a programmer understands how dates and times are stored in SAS and how to make use of all the date- and time-related formats/informats and functions, they usually appreciate the power and ease with which one can use SAS to read in dates and times from any source system, and write them out in any format required by a target system or end user report.
A programmer can use this knowledge to save physical storage space by storing a date, time, or datetime variable in one variable instead of storing the same date in multiple variables, simply to represent different ways to display that date. With one variable and formats, the programmer will be able to render reports on the fly for end users around the globe, who are used to seeing dates in the format most used in their countries.
The reader has been introduced to SAS and now understands how SAS® software has evolved over the years, from supplying analytic tools to building an analytic platform on which not just the tools run, but horizontal and vertical solutions as well.
The reader has been made aware of several ways to access the SAS programming language, which includes command-line input, GUIs such as SAS Enterprise Guide and SAS Studio, and purpose-built GUIs for specific horizontal and vertical solutions.
The reader has been given step-by-step instructions on how to set up their own SAS® University Edition of SAS and has been lead through a few simple examples of submitting both data step code and a SAS PROC.
The reader has been shown the difference between the SAS Studio SAS Programmer perspective and the SAS Studio Visual Programmer perspective and was lead through an example of running a process flow in the Visual Programmer perspective.
The reader has been made aware of the different SAS data storage capabilities as well as some of the internal workings of SAS, such as how SAS stores data as either numeric or character, and the importance of FORMATS/INFORMATS, and in particular how these work hand-in-hand with how SAS stores date- and time-related data.
In Chapter 2, Working with Data Using SAS® Software of this book, the reader will learn how to make data within SAS, bring data in from external data sources as well as continuing to write and execute SAS programs!
