


Reduced hardware cost is giving us the opportunity to save a lot of data. We are now generating a lot of data, and this data can generate interesting patterns for various industries, which is why machine learning and data mining enthusiasts are responsible for this data.
The data from various industries can provide insights that can be very useful for the business. For example, sensor data on cars can be very useful for insurance majors. Data scientists can find out useful information from this data, such as driving speed, time of driving, mileage, breaking, and so on; they can also rate the driver, which in turn would be useful for the insurer to set up the premium.
In the health care industry, data collected from different patients is used to predict different diseases. A well-known use case is to predict whether a tumor will be cancerous or not based on the tumor size and other characteristics.
In bioinformatics, one well-known use case is grouping a homologous sequence into the gene family.
These problems are related to data gathering, finding useful pattern from data, and then enabling the machine to learn to identify patterns from new datasets. In the area of machine learning, learning can broadly be classified into the following three areas:
Supervised learning: In supervised learning, each sample consists of the input and the desired output, and we tried to predict the output from the given input set
Unsupervised learning: In unsupervised learning, we do not know anything about the output, but from the pattern of data, we can define different collections within the datasets
Reinforcement learning: In reinforcement learning, within a given context, machines and software agents automatically determine the ideal behavior
In this book, we will concentrate on unsupervised learning and the different methods applied to this. For the tool perspective, we will use Apache Mahout. You will learn what the algorithms available in Apache Mahout in the area of unsupervised learning are and how to use them.
In this chapter, we will explore following topics:
Understanding clustering
Applications of clustering
Understanding distance measures
Understanding different clustering techniques
Algorithm support in Apache Mahout
Installing Apache Mahout
Preparing data for use by clustering techniques
Since childhood, we have been grouping similar things together. You can see that kids demand something (such as candies, ice cream, chocolates, toys, a cycle, and so on) in return for a favor. We can see examples in our organizations where we group people (peers, vendors, clients, and so on) based on their work.
The idea of clustering is similar to this. It is a technique that tries to group items together based on some sort of similarity. These groups will be divided in a way that the items in one group have little or no similarity to the items in a different group.
Let's take an example. Suppose you have a folder in your computer that is filled with videos and you know nothing about the content of the videos. One of your friends asks you whether you have the science class lecture video. What will you do in this case? One way is to quickly check the content of the videos, and as soon as you find the relevant video you will share it. Another way of doing this is to create a subfolder inside your main folder and categorize the videos by movies, songs, education, and so on. You can further organize movies as action, romance, thriller, and so on. If you think again, you have actually solved one of your clustering problems—grouping similar items together in such a way that they are similar in one group but different from the other group.
Now, let's address a major question that beginners usually ask at this stage—how is it is different from classification? Take your video folder example again; in the case of classification, subfolders of movies, songs, and education will already be there, and based on the content, you will put your new videos into relevant folders. However, in the case of clustering, we were not aware of the folders (or labels in machine learning terms) based on the content, we divided the videos and later assigned the label to them.
As you can see in the following figure, we have different points and based on shapes, we group them into different clusters:
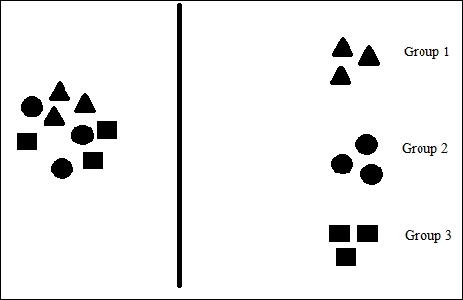
The clustering task can be divided into the following:
The pattern finding algorithm: We will discuss these algorithms throughout this book; they are K-means, spectral clustering, and so on. The basic idea is that we should have an algorithm that can detect patterns in given datasets.
The distance measuring technique: To calculate the closeness of different items, there are certain measures in place, such as Euclidean distance, cosine distance measure, and so on. We will discuss different techniques of distance measure in this chapter.
Grouping and Stopping: With the algorithm and distance measure techniques, items will be grouped in different clusters, and based on the conditions, such as the elbow method, cross validation, and so on, we will stop further grouping.
Analysis of Output: Once grouping is complete, we have a measuring technique to determine how well our model performed. We can use techniques such as F-measure, the Jaccard index, and so on to evaluate the cluster. We will discuss these techniques with the respective algorithm discussions.
Clustering is used in a wide area of applications such as bioinformatics, web search, image pattern recognition, and sequence analysis. There are a number of fields where clustering is used. Some of them are as follows:
For marketing: Clustering can be useful to segment customers based on geographical location, age, and consumption patterns. Clustering can be used to create a 360 degree view of customers, which is useful for customer relationship management. This is useful in creating new customers, retaining existing customers, launching new products, and in product positioning.
For recommendations: Clusters are very useful in creating recommendation system applications. Recommender systems are applications that suggest new items to customers based on their previous search or based on the item purchased by similar customers. Clustering is useful to create groups of customers based on their preferences.
Image segmentation: Clustering is used to partition the image into multiple regions and pixel in each region shares the common properties.
In bioinformatics: Clustering is used in many areas of bio-informatics and one major area is human genome clustering—identifying patterns in a genome, which leads to discover the cure for disease.
Clustering in web search: Clustering is useful to group results, resulted after keyword search on the Web.
Clustering is useful in almost all industries, and clustering is studied and researched in different areas such as data mining, machine learning, statistics, databases, biology, astrophysics, and many other fields.
Now, we will move on to the next section where we will discuss the different distance measuring technique that we used to find the similarity, or dissimilarity, between two data points as numeric values.
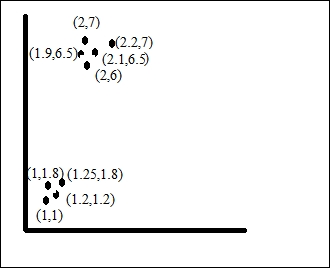
In each clustering problem, such as document clustering, protein clustering, genome sequence, galaxy image grouping, and so on, we need to calculate the distance between points. Let's start this problem with the points in a two-dimensional XY plane, and later in the section of preparing data for Mahout, we will discuss how to handle other types of documents, such as text.
Suppose that we have a set of points and know the points' coordinates (x and y position). We want to group the points into different clusters. How do we achieve this? For this type of problem, we will calculate the distance between points, the points close to each other will be part of one cluster, and the points; that are away from one group will be part of another. See the following figure:
Any clustering algorithm will divide the given points into two groups, and with great accuracy, but, to be honest, in a real scenario, we will not face such simple problems. As defined, we used a distance measure to calculate the distance between points. We will only discuss distance measuring techniques that are available in the Apache Mahout 0.9 releases. An introduction of Mahout is given later in this chapter. For numeric variables, distance measures are as follow:
ChebyshevDistanceMeasureCosineDistanceMeasureEuclideanDistanceMeasureMahalanobisDistanceMeasureManhattanDistanceMeasureMinkowskiDistanceMeasureSquaredEuclideanDistanceMeasureTanimotoDistanceMeasureWeightedEuclideanDistanceMeasureWeightedManhattanDistanceMeasure
Note that for categorical variables, distance is measured with matching categories. For example, say we have six categories of variables, three type of colors, and two sets of data:
|
Color 1 |
Color 2 |
Color 3 |
Color 4 |
Color 5 |
Color 6 | |
|---|---|---|---|---|---|---|
|
Dataset 1 |
Blue |
Red |
Green |
Red |
Blue |
Blue |
|
Dataset 2 |
Red |
Red |
Green |
Blue |
Green |
Green |
We can see that we have two matching and four nonmatching items, so the distance will be 4/6 ~= 0.67.
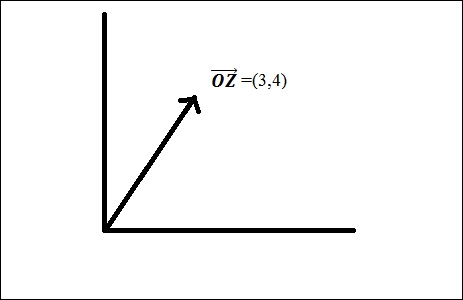
Let's understand what these distance measures are, but, before that, here's a reminder about the vectors that you learn in your physics class. A vector is a quantity that has both magnitude and direction. As shown in the figure, we represent a vector on the Cartesian plane by showing coordinates.
EuclideanDistanceMeasure is the simplest among all the distance measures. Euclidean distance between two n-dimensional vectors (x1, x2, x3…xn) and (y1, y2, y3…yn) is calculated as summing the square root of the squared differences between each coordinate. Mathematically, it is represented as:

The Mahout implementation of the Euclidean distance is available as the EuclideanDistanceMeasure class under the org.apache.mahout.common.distance package.
SquaredEuclideanDistanceMeasure is the square of the Euclidean distance. It provides greater weights to points that are farther apart. It is implemented as the SquaredEuclideanDistanceMeasure class under the org.apache.mahout.common.distance package. Mathematically, it is represented as:

WeightedEuclideanDistanceMeasure is implemented as the WeightedEuclideanDistanceMeasure class under the org.apache.mahout.common.distance package. In Weighted Euclidean Distance, squared differences between the variables are multiplied by their corresponding weights. Weights can be defined as:

 where
where  is sample standard deviation of ith variable.
Mathematically, Weighted Euclidean Distance is represented as:

ManhattanDistanceMeasure is the sum of absolute difference between the coordinates. It is implemented as the ManhattanDistanceMeasure class under the same package, as other distance measure classes exist. Manhattan distance is also called taxicab geometry. It is based on grid-like street geography of Manhattan, New York. In this grid structure, distance is the sum of horizontal and vertical lines. As shown in the following figure, the Manhattan distance for point A and B from line 1 and 2 is equal to 9 blocks:
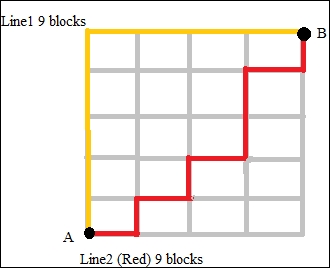
Mathematically, this is defined as:

The WeightedManhattanDistanceMeasure class is implemented as WeightedManhattanDistanceMeasure under the same distance package in Mahout. This class implements a Manhattan distance metric by summing the absolute values of the difference between each coordinate with weights, as in case of weighted Euclidean distance.
The ChebyshevDistanceMeasure distance measure is equivalent to a maximum of the absolute value of the difference between each coordinate. This distance is also known as chessboard distance because of the moves a king can make. Mathematically, this can be defined as:

So, let's say, for example, that we have two vectors, vector X (0,2,3,-4) and vector Y (6,5,4,1). The Chebyshev distance will be maximum (|0-6|,|2-5|,|3-4|,|-4-1|), which is 6.
This class is defined as ChebyshevDistanceMeasure under the same distance package in Mahout.
The CosineDistanceMeasure Cosine distance is a little different from the distance measures that we have studied so far. Cosine distance measures the similarity of the two vectors as the measure of the cosine of the angle between two vectors. Consider the following figure for more clarity. We have two vectors A and B, and the angle between them is θ.
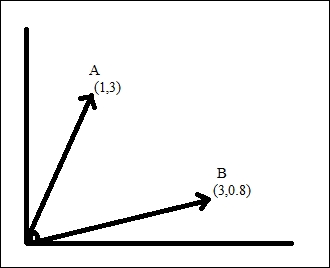
Cosine of the angle will be close to 1 for a smaller angle and decreases for a larger angle. Cosine for 900 is 0 and cosine for 1800 is -1. So, vectors in the same directions have a similarity of 1, and those in the opposite direction have a similarity of -1. Mathematically, it is defined as:
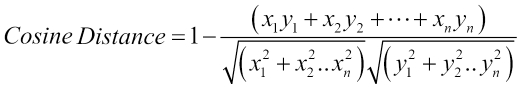
Subtraction of 1 is used to provide a proper distance so vectors close to each other (00) will provide 0, and those opposite each other (1800) will provide 2. So, in this distance, instead of the vector length, their directions matters.
MinkowskiDistanceMeasure is a generalization of the Euclidean and Manhattan distance. This distance is defined in the MinkowskiDistanceMeasure class under the same distance package of Mahout. Mathematically, it is defined as:
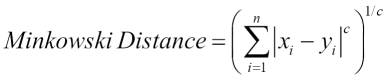
If you see, for c=1, it is the Manhattan distance measure, and for c=2, it is the Euclidean distance measure.
TanimotoDistanceMeasure: In cosine distance, we take only the angle between the vectors into account but for the tanimoto distance measure, we also take the relative distance of vectors into account. Mathematically, it can be defined as:
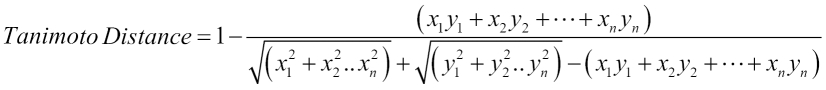
This is defined as the TanimotoDistanceMeasure class under the org.apache.mahout.common.distance package.
A number of different clustering techniques are available in the area of machine learning and data mining. There are algorithms based on these different techniques. Let's see these different techniques:
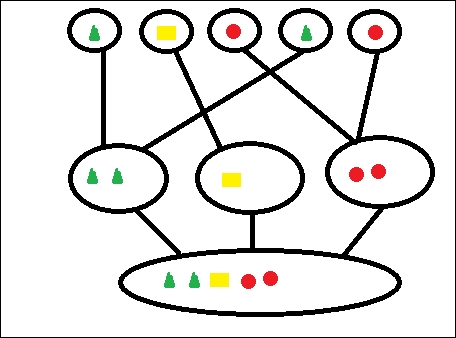
In this clustering method, the given data is divided hierarchically. To help you understand this, let's take an example of animals' class hierarchy. We have two groups, invertebrate and vertebrate, but we can combine them into one animal class. Hierarchical clustering can be done using two approaches, which are:
The top-down approach: This is also called the divisive approach. In this approach, all the datasets start with one cluster, and each iteration cluster is further divided into sub clusters. This process goes on until we meet a termination condition.
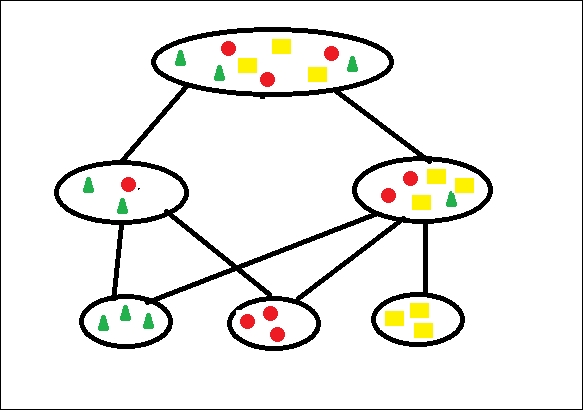
The bottom-up approach: This approach is also called the agglomerative approach. This method starts with each dataset in separate clusters and successively merges the dataset into closer clusters until all sub clusters are merged into one cluster.
We can take a real-life example from our organizational structure. We have all the employees' data, and we can divide them into clusters such as finance, HR, operations, and so on. The main pain point of hierarchical clustering is deciding between merger or split points.
In this method, we select a number, k, to create k numbers of clusters. Partitioning methods are generally distance-based.
The partitioning method involves a few steps to acquire better partitioning. First, it creates the initial partitioning, and after that, it calculates the similarity of items based on the distance measuring techniques. Iteratively, it relocates the objects to another group based on the similarity it calculates. Partitioning is said to be good if it keeps similar items in one cluster while the items in different clusters are different from each other.
K-means is a very good example of this method. K-means is used in many areas, such as human genetic clustering, shopping cart item clustering, and so on. We will discuss these algorithms in the upcoming chapter.
The density-based clustering algorithm groups together points that are closely packed together. So, for each data point within a given cluster, the neighborhood of a given radius has to contain at least a minimum number of points, which is given as part of the input to the algorithm. Such a method can be used to filter out noise or outliers. DBSCAN is a very popular algorithm in this area. It can detect arbitrary shapes in the cluster, and it can detect outliers in the data. This should not be used for high-dimensional datasets.
In probabilistic clustering, we take up the problems where we know that data is coming from different models of probability distribution. The probabilistic clustering algorithm takes a probabilistic model and tries to fit the data into that model.
The model that we built is used to fit the given dataset. The model is said to be right if it fits the data better and shows the number of clusters in the given dataset in line with the model.
By calculating the probability of the model being a fit for dataset and reading the vectors, we test whether a dataset is a fit for the model. This is also called soft clustering.
The implementation of algorithms in Mahout can be categorized into two groups:
Sequential algorithms: These algorithms are executed sequentially and so cannot use Hadoop's scalable processing. These algorithms are usually the ones derived from Taste (this was a separate project. It was a non Hadoop based recommendation engine).
Examples of these algorithms are user-based collaborative filtering, logistic regression, Hidden Markov Model, multi-layer perceptron, and singular value decomposition.
Parallel algorithms: These algorithms can support petabytes of data using Hadoop's map reduce parallel processing.
Examples of these algorithms are Random Forest, Naïve Bayes, Canopy clustering, K-means clustering, spectral clustering, and so on.
Mahout has the implementation of the following clustering algorithms (as of release 0.9):
K-means clustering: This is available as both single machine and map reduce way
Fuzzy K-means: This is available as both single machine and map reduce way
Streaming K-means: This is available as both single machine and map reduce way
Spectral clustering: This is available only as map reduce way
Latent Dirichlet Allocation for topic modeling: This is available as both single machine and map reduce way
We can install Mahout using different methods. Each method is independent from the others. You can choose any one of these:
Building Mahout code using Maven.
Setting up the development environment using Eclipse
Setting up Mahout for Windows users
Before performing any of the steps, the prerequisites are:
Having Java installed on your system
Having Hadoop installed on your system (http://hadoop.apache.org/docs/stable/hadoop-project-dist/hadoop-common/SingleNodeSetup.html)
The Mahout build and release system is based on Maven. For Maven installation:
Create the folder
/usr/local/maven:mkdir /usr/local/mavenDownload the distribution
apache-maven-x.y.z-bin.tar.gzfrom the Maven site (http://maven.apache.org/download.cgi), and move this to/usr/local/maven:mvapache-maven-x.y.z-bin.tar.gz /usr/local/mavenUnpack this to the location
/usr/local/maven:tar –xvfapache-maven-x.y.z-bin.tar.gzEdit the
.bashrcfile as follows:export M2_HOME=/usr/local/apache-maven-x.y.z export M2=$M2_HOME/bin export PATH=$M2:$PATHNote
For the Eclipse IDE, go to help and select Install new Software, click on the add button, and in the popup fill up the name M2Eclipse and provide the http://download.eclipse.org/technology/m2e/releases link, and click on OK.
Building the Mahout code:
By default, Mahout assumes that Hadoop is already installed on the system. Mahout uses the HADOOP_HOME and HADOOP_CONF_DIR environment variables to access Hadoop cluster configurations. To set up Mahout, follow the steps given here:
Download the Mahout distribution file
mahout-distribution-0.9-src.tar.gzfrom http://archive.apache.org/dist/mahout/0.9/.Choose an installation directory for Mahout (
/usr/local/Mahout) and place the downloaded source in the folder. Extract the source code and ensure that the folder contains thepom.xmlfile:tar -xvf mahout-distribution-0.9-src.tar.gzInstall the Mahout Maven project and skip the test cases during installation:
mvn install -Dmaven.test.skip=trueSet the
MAHOUT_HOMEenvironment variable in the~/.bashrcfile and update thePATHvariable with the Mahoutbindirectory:export MAHOUT_HOME=/user/local/mahout/mahout-distribution-0.9 export PATH=$PATH:$MAHOUT_HOME/bin
To test the Mahout installation, execute the
mahoutcommand. This will list the available programs within the distribution bundle, as shown in following screenshot: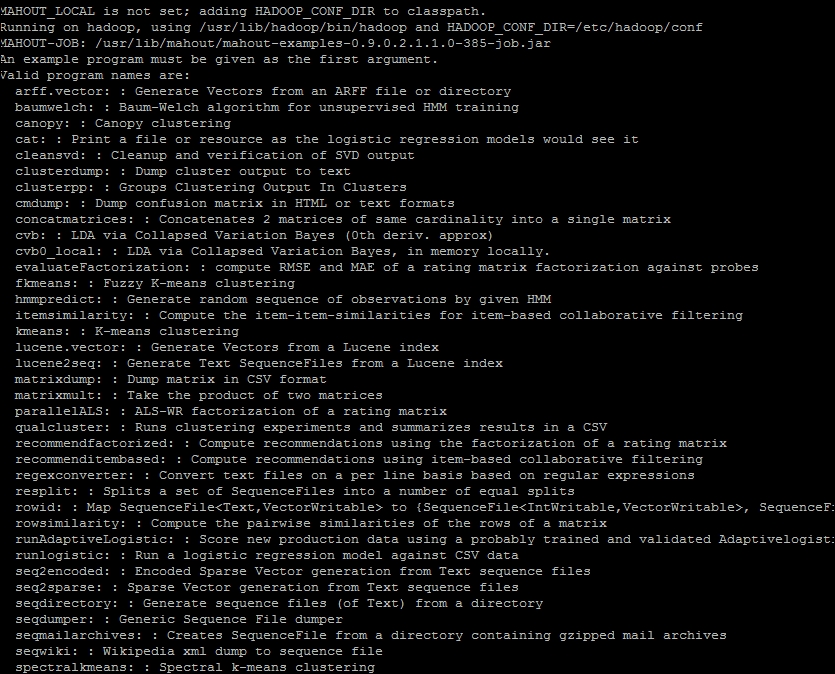
For this setup, you should have Maven installed on the system and the Maven plugin for Eclipse. Refer to the Installing Maven steps mentioned in a previous section.
Download the Mahout distribution file
mahout-distribution-0.9-src.tar.gzfrom the http://archive.apache.org/dist/mahout/0.9/ location and unzip this:tarxzfmahout-distribution-0.9-src.tar.gzCreate a folder name workspace under
/usr/local/workspace:mkdir /usr/local/workspaceMove the downloaded distribution to this folder (from the downloads folder):
mvmahout-distribution-0.9 /usr/local/workspace/Move to the
/usr/local/workspace/mahout-distribution-0.9folder and make the Eclipse project:mvneclipse:eclipse(this command can take up to one hour)Set the Mahout home in the
.bashrcfile, as explained earlier.Now, open Eclipse, select the file and click on import. Under Maven, select Existing Maven Projects. Now, browse to the location for
mahout-distribution-0.9and click on Finish.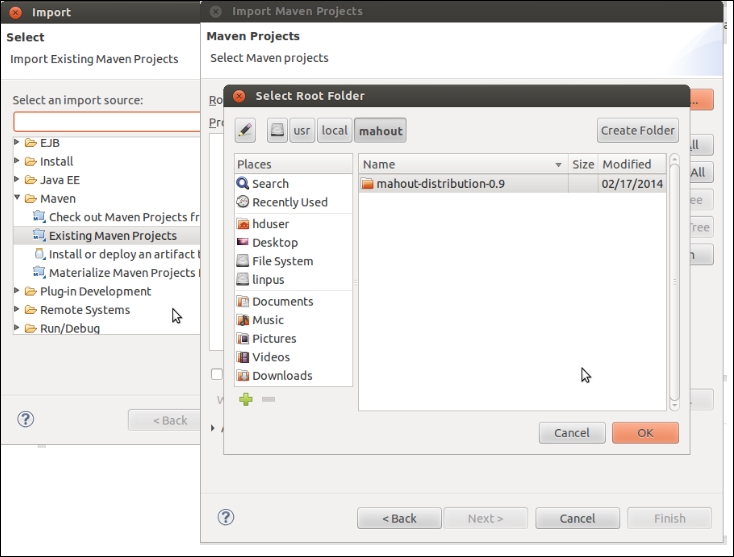
Windows users can use cygwin to setup their environment. There is one more easy-to-use way.
Download Hortonworks Sandbox for VirtualBox on your system (http://hortonworks.com/products/hortonworks-sandbox/#install). On your system, this will be a pseudo-distributed mode of Hadoop. Log in to the console, and enter the following command:
yum install mahout
Now, you will see the following screen:
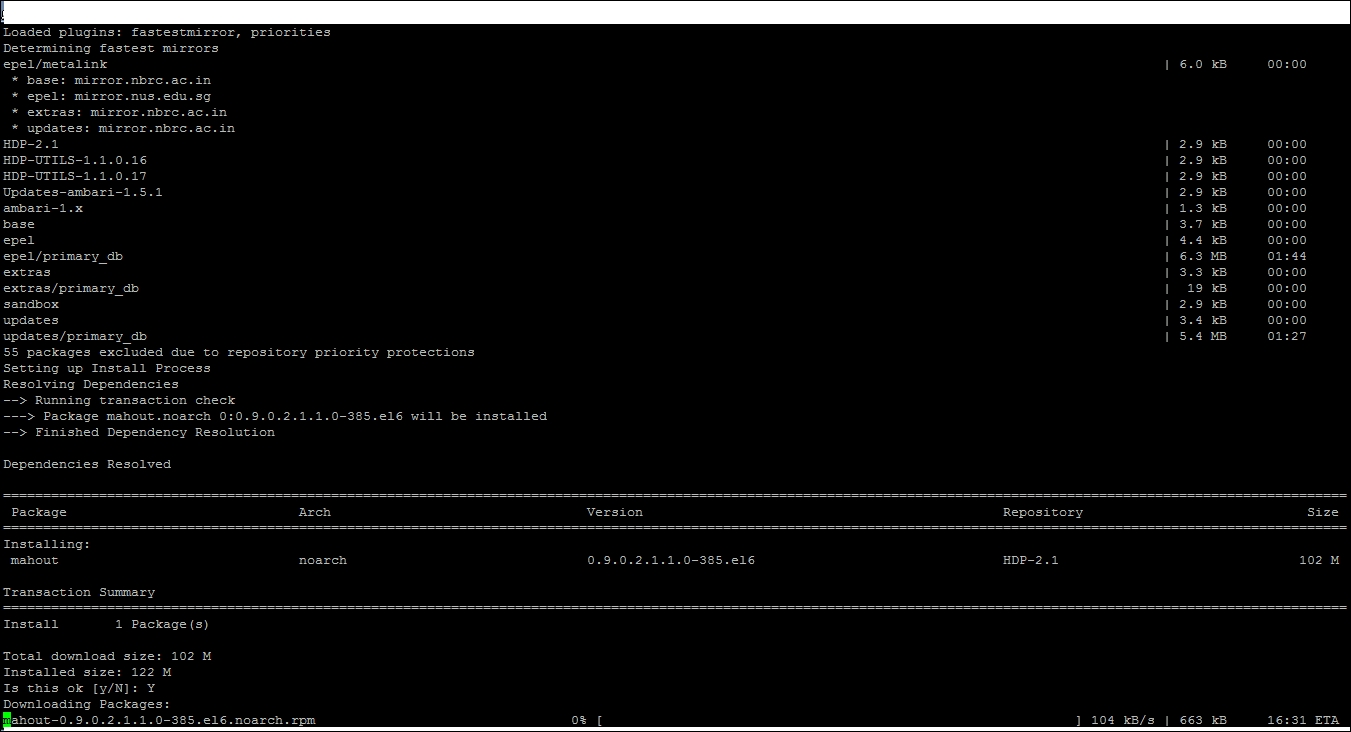
Enter y and your Mahout will start installing. Once done, you can test it by typing the command – mahout, and this will show you the same screen as shown in preceding figure.
Machine learning algorithms such as clustering and classification use input data in vector formats. We need to map features of an object in the numeric form, which will be helpful in creating the vectors. The vector space model is used to vectorize text documents. Let's understand this model in more detail.
In this model, first we will create a dictionary of all the words present in the document in such a way that we assign a particular index to each word. As some of the words will occur more frequently in any document, such as a, as, the, that, this, was, and so on. These words are also called stop words and will not help us, so we will ignore these words. Now, we have a dictionary of the words that are indexed. So, let's assume that we have two documents, Doc1 and Doc2, containing the following content:
Doc1: We will learn clustering in this book
Doc2: We have different clustering algorithms
Now, we will have the following index dictionary:
[learn , cluster, book, different, algorithm]
[1,2,3,4,5]
So, we have created a vector space of the document, where the first term is learn, the second is cluster, and so on. Now, we will use the term-frequency to represent each term in our vector space. The term-frequency is nothing but the count of how many times the words present in our dictionary are present in the documents. So, each of the Doc1 and Doc2 can be presented by five-dimensional vectors as [1,1,1,0,0] and [0,1,0,1,1] (the number of times each word in particular index occurred in the Doc).
When we try to find the similarity between the documents based on distance measures, we often encounter a problem. Most occurring words in the documents increase the weight. We can find out that two documents could be same if they are talking about the same topic, and for the same topic, words are usually rare and occur less often occurring words. So, to give more weightage for these words, there is a technique that is called Inverse document frequency.
Inverse document frequency can be considered as the boost a term gets for being rare. A term should not be too common. If a term is occurring in every document, it is not good for clustering. The fewer documents in which a term occurs, the more significant it is likely to be in the documents it does occur in.
For a term t inverse document frequency is calculated as:
IDF (t) = 1 + log (total number of documents/ number of documents containing t)
Usually, TF-IDF is the widely used improvement to provide weightage to words. It is the product of the term frequency and inverse document frequency.
TFIDF (t, d) = TF (t, d) * IDF (t)
Where t is the term, d id the document, TF(t,d) is frequency of term t in document d and IDF(t), as explained earlier.
Sometimes, we find that some words can be found in groups and make more sense instead of appearing alone. A group of words in a sequence is called n-grams. Words that have a high probability to occur together can be identified by Mahout. To find out whether two words occur together by chance or because they are a unit, Mahout passes these n-grams through log-likelihood tests.
Mahout provides two types of implementation of the vector format—sparse vector and dense vector. Applications that require fast random reads use RandomAccessSparseVector, which is a sparse implementation. Applications that require fast sequential reads can use SequentialAccessSparseVector.
Mahout uses sequence files to read and write the vectors. These sequence files are used by Hadoop for parallel execution. A sequence file contains binary key value pairs. Mahout provides commands to convert text document corpse into sequence files and later to generate vectors from those sequence files. These vectors are used as inputs for the algorithms.
In this chapter, we discussed clustering. We discussed clustering in general, as well as the different applications of clustering. We further discussed the different distance measuring techniques available. We then saw the different clustering techniques and algorithms available in Apache Mahout. We also saw how to install Mahout on the system and how to prepare a development environment to execute Mahout algorithms. We also discussed how to prepare data using Mahout's clustering algorithms.
Now, we will move on to the next chapter, where we will see one of the best known clustering algorithms—K-means. You will learn about the algorithm and understand how to use the Mahout implementation of this algorithm.
