Imagine you're an administrator of a large IT infrastructure. You have just started receiving e-mails that a web application has suddenly stopped working. When you try to access the same page, it just does not load. What are the possibilities? Is it the router? Maybe the firewall? Perhaps the machine hosting the page is down? The server process has crashed? Before you even start thinking rationally about what to do, your boss calls about the critical situation and demands explanations. In all this panic, you'll probably start plugging everything in and out of the network, rebooting the machine... and it still doesn't help.
After hours of nervous digging into the issue, you've finally found the root cause: although the web server was working properly, it continuously timed out during communication with the database server. This is because the machine with the database did not get an IP address assigned. Your organization requires all IP addresses to be configured using the DHCP protocol and the local DHCP server ran out of memory and killed several processes, including the dhcpd process responsible for assigning IP addresses. Imagine how much time it would take to determine all this manually! To make things worse, the database server could be located in another branch of the company or in a different time zone, and it could be the middle of the night over there.
But what if you had Nagios up and running across your entire company? You would just go to the web interface and see that there are no problems with the web server and the machine on which it is running. There would also be a list of issues—the machine serving IP addresses to the entire company does not do its job and the database is down. If the setup also monitored the DHCP server, you'd get a warning e-mail that little swap memory is available or too many processes are running. Maybe it would even have an event handler for such cases to just kill or restart non-critical processes. Also, Nagios would try to restart the dhcpd process over the network in case it is down.
In the worst case, Nagios would reduce hours of investigation to ten minutes. Ideally, you would just get an e-mail that there was such a problem and another e-mail that it's already fixed. You would just disable a few services and increase the swap size for the DHCP machine and solve the problem permanently. Hopefully, it would be solved fast enough so that nobody would notice that there was a problem in the first place!
Nagios is an open source tool for system monitoring. It means that it watches servers and other devices on your network and makes sure that they are working properly. Nagios constantly checks if other machines are working properly. It also verifies that various services on those machines are working properly. In addition, Nagios can accept information from other processes or machines regarding their status; for example, a web server can send information to Nagios if it is overloaded.
The main purpose of system monitoring is to detect if any system is not working properly as soon as possible and notify the appropriate staff, and if possible, try to resolve the error—such as by restarting system services if needed.
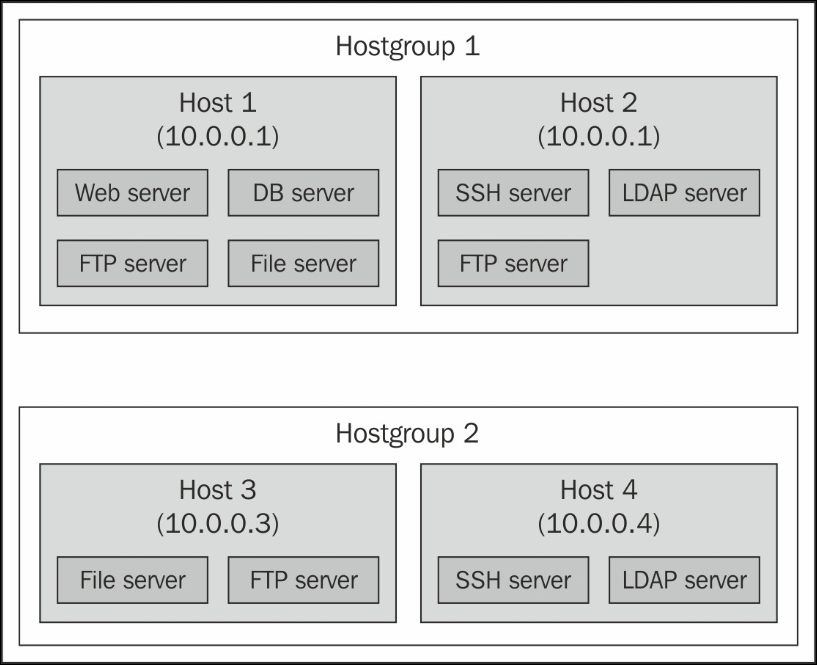
System monitoring in Nagios is split into two categories of objects, hosts and services:
Hosts represent a physical or virtual device on your network (servers, routers, workstations, printers, and so on)
Services are particular functionalities, for example, a SecureShell (SSH) server (sshd process on the machine) can be defined as a service to be monitored
Each service is associated with a host on which it is running. In addition, machines can be grouped into host groups, as shown here:
A major benefit of Nagios' performance checks is that it only uses four distinct states—Ok, Warning, Critical, and Unknown. Another advantage is that it is based on the framework of plugins, allowing you to develop your own plugin; this means if you want to check something that's not yet possible to do, you just need to write a simple piece of code and that's it! Writing your own plugins is described in more details in Chapter 13, Programming Nagios.
The approach to offer only three states (excluding Unknown as it informs about not being able to determine the current state) allows administrators to ignore monitoring values themselves and just decide on what the warning/critical limits are. This is a proven concept, and is far more efficient than monitoring graphs and analyzing trends. This is similar to traffic lights, where green indicates Ok and means a service is working correctly, a Warning state is same as the yellow light, and a Critical state is same as the red traffic light.
For example, system administrators tend to ignore things such as gradually declining storage space. People often simply ignore early warnings until a critical process runs out of disk space. Having a strict limit to watch is much better, because you always catch a problem regardless of whether it turns from warning to critical in fifteen minutes or in a week. This approach is exactly what Nagios does. Each check performed by Nagios is turned from numerical values (such as the amount of disk space or CPU usage) to one of the three possible states.
Another benefit is a clear report stating that X services are up and running, Y are in the warning state, and Z are currently critical, which is much more readable than a matrix of values. It saves you the time of analyzing what's working and what's failing. It can also help prioritize what needs to be handled first and which problems can be handled later.
Nagios performs all of its checks using plugins. These are external components for which Nagios passes information on what should be checked and what the warning and critical limits are. Plugins are responsible for performing the checks and analyzing the results. The output from such a check is the status (Ok, Warning, Critical, or Unknown) and additional text describing information on the service in detail. This text is mainly intended for system administrators to be able to read the detailed status of a service.
Nagios comes with a set of standard plugins that allow performance checks for almost all the services your company might use or offer. See Chapter 6, Using the Nagios Plugins, for detailed information on plugins that are developed along with Nagios. Moreover, if you need to perform a specific check (for example, connect to a web service and invoke methods), it is very easy to write your own plugins. And that's not all—they can be written in any language and it takes less than 15 minutes to write a complete check command! Chapter 13, Programming Nagios, talks about this ability in more detail.
There are many reasons for you to ensure that all your resources are working as expected. If you're still not convinced after reading the introduction to this chapter, here are a few important points why it is important to monitor your infrastructure.
The main reason is quality improvement. If your IT staff can notice failures quicker by using a monitoring tool, they will also be able to respond to them much faster. Sometimes it takes hours or days to get the first report of a failure, even if many users bump into errors. Nagios ensures that if something is not working, you'll know about it. In some cases, event handling can even be done so that Nagios can switch to the backup solution until the primary process is fixed. A typical case would be to start a dial-up connection and use it as a primary connection in cases when the company VPN is down.
Another reason is much better problem determination. Very often what the users report as a failure is far from the root cause of the problem, such as when an e-mail system is down due to the LDAP service not working correctly. If you define dependencies between hosts correctly, then Nagios will point out that the IMAP or POP3 e-mail server is assumed to be not working because the LDAP service that it depends upon has a problem. Nagios will start checking the e-mail server as soon as the problem with LDAP has been resolved.
Nagios is also very flexible when it comes to notifying people of what isn't functioning correctly. In most cases, your company has a large IT team or multiple teams. Usually, you want some people to handle servers and others to handle network switches/routers/modems. There might also be a team responsible for network printers, or a division is made based on geographical location. You can instruct Nagios about who is responsible for particular machines or groups of machines, so that when something is wrong, the right people will get to know about it. You can also use Nagios' web interface to manage who is working on which issue.
Monitoring resources is not only useful for identifying problems, but it also saves you from having them, as Nagios handles warnings and critical situations differently. This means that it's possible to be aware of situations that may become problems really soon. For example, if your disk storage on an e-mail server is running out, it's better to be aware of this situation before it becomes a critical issue.
Monitoring can also be set up on multiple machines across various locations. These machines will then communicate all their results to a central Nagios server so that information on all hosts and services in your system can be accessed from a single machine. This gives you a more accurate picture of your IT infrastructure as well as allows testing more complex systems such as firewalls. For example, it is vital that a testing environment is accessible from a production environment, but not the other way around.
It is also possible to set up a Nagios server outside the company's intranet (for example, over a dedicated DSL) to make sure that traffic from the Internet is properly blocked. It can be used to check if only certain services are available, for example, to verify that only SSH and Hypertext Transfer Protocol (HTTP) are accessible from external IP addresses, and that services such as databases are inaccessible to users.
Nagios' main strength is flexibility—it can be configured to monitor your IT infrastructure in the way you want it. It also has a mechanism to react automatically to problems and has a powerful notification system. All of this is based on a clear object definition system, which in turn is based on a few types of object, as follows:
Commands: These are definitions of how Nagios should perform particular types of check. They are an abstraction layer on top of actual plugins that allow you to group similar types of operation.
Time periods: Date and time spans during which an operation should or should not be performed. For example, Monday-Friday, 09:00 A.M. - 5:00 P.M.
Hosts and host groups: These are devices along with the possibility of group hosts. A single host might be a member of more than one group.
Services: Various functionalities or resources to monitor on a specific host, for example, CPU usage, storage space, or web server.
Contacts and contact groups: People that should be notified, with information about how and when they should be contacted; contacts can be grouped, and a single contact might be a member of more than one group.
Notifications: These define who should be notified of what; for example, all errors related to the linux-servers host group should go to the linux-admins contact group during working hours and to the critsit-team (critical situations handling team) contact group outside of working hours. Notifications are not strictly an object, but a combination of all the preceding objects and are an essential part of Nagios.
Escalations: Extension to notifications; escalations define these after an object is in the same state for a specific period of time, other people should get notified of certain events. For example, a critical server being down for more than four hours should alert IT management so that they track the issue.
A beneficial feature of using Nagios is that it is a mature dependency system. For any administrator, it is obvious that if your router is down then all machines accessed via it will fail. Some systems don't take that into account, and in such cases, you get a list of several failing machines and services. Nagios allows you to define dependencies between hosts to reflect actual network topology. For example, if a router that connects you to the rest of your network is down, Nagios will not perform checks for the subsequent parts and machines that are dependent on the router. This is illustrated in the following image:
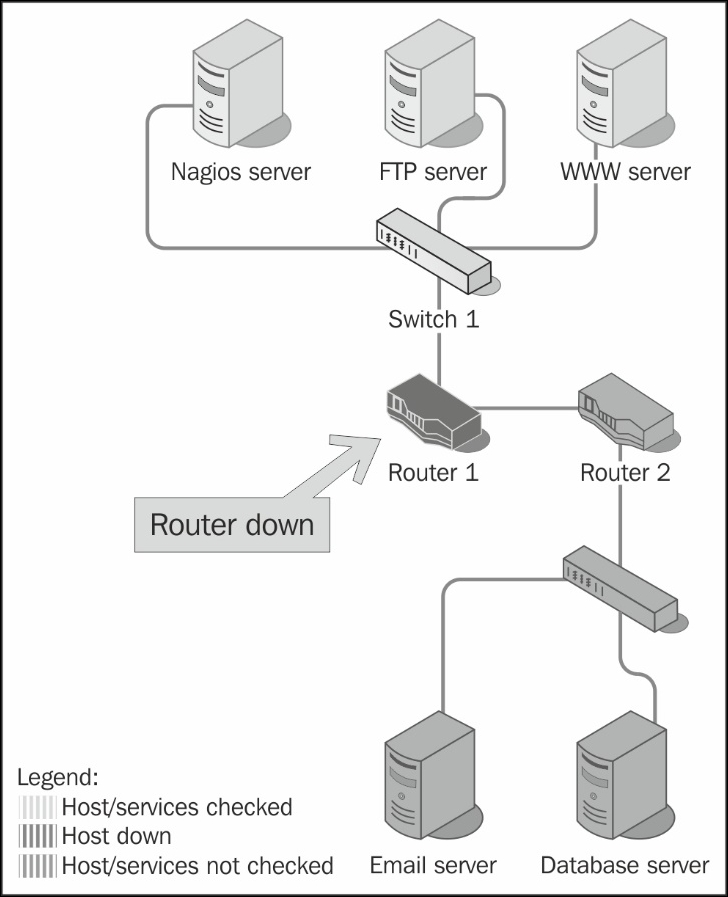
You can also define that a particular service depends on another service, either on the same host or a different host. If one of the dependent services is down, a check for a service is not even performed.
For example, in order for your company's intranet application to function properly, both the underlying web and database servers must be running properly. So, if a database service is not working properly, Nagios will not perform checks and/or not send notifications that your application is not working, because the root cause of the problem is that the database is not working properly. The database server might be on the same or on a different host. If the database is not working properly or the dependent machine is down or not accessible, all services dependent on the database service will not be checked as well.
Nagios offers a consistent system of macro definitions. These are variables that can be put into all object definitions and depend on the context. They can be put inside commands, and depending on the host, service, and many other parameters, macro definitions are substituted accordingly. For example, a command definition might use an IP address of the host it is currently checking in all remote tests. It also makes it possible to put information such as the previous and current status of a service in a notification e-mail. Nagios also offers various extensions to macro definitions, which makes it an even more powerful mechanism.
Additionally, there is a built-in mechanism for scheduling planned downtime. This is mainly used when maintenance of the IT infrastructure is to be carried out, and servers and/or services they provide are out of order for a period of time. You can let Nagios know that such an event will occur, and it will not send notifications about problems with hosts and/or services that have a scheduled downtime. In such cases, dependencies are also taken into consideration—if a database has a scheduled downtime, notifications for the services that depend on it will not be sent out. Nagios can also notify people of planned downtime automatically. This allows creating an integrated process of scheduling downtime that will also handle informing users.
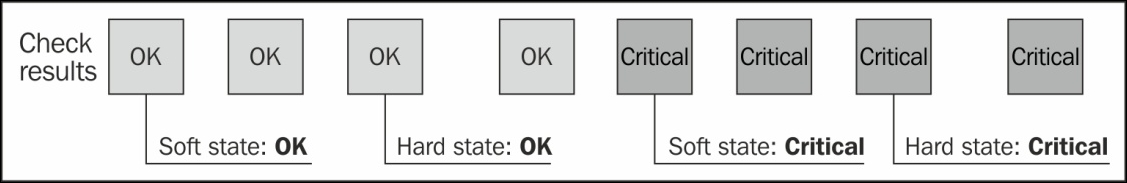
Nagios works by checking if a particular host or service is working correctly and storing its status. Because the status is only one of four possible values, it is crucial that it precisely reflects the actual situation. In order to avoid detecting random and temporary failures, Nagios uses soft and hard states to describe what the current status is for a host or service.
Imagine that an administrator is restarting a web server, which in turn makes web pages inaccessible for around five seconds. Since such restarts are usually done at night to lower the number of users affected, this is an acceptable period of time. However, a problem might be that Nagios will try to connect to the server and notice that it is actually down. If it only relies on a single result, Nagios could trigger an alert that a web server is down. It would actually be up and running again in a few seconds, but Nagios would require another couple of minutes to find that out.
To handle situations where a service is down for a very short time, or the test has temporarily failed, soft states were introduced. When a previous status of a check is unknown or is different from the previous one, Nagios will retest the host or service a couple of times to make sure the change is permanent. Nagios assumes that the new result is a soft state. After additional tests have verified that the new state is permanent, it is considered a hard one.
Each host and service check defines the number of retries to perform before assuming a change to be permanent. This allows more flexibility over how many failures should be treated as an actual problem instead of a temporary one. Setting the number of checks to 1 will cause all changes to be treated as hard instantly. The following figure is an illustration of soft and hard state changes, assuming that number of checks to be performed is set to 3:
This feature is very useful for checks that should skip short outages of a service or use a protocol that might fail in case of extensive traffic, such as ICMP or UDP. Monitoring devices over SNMP is also an example of a check that can fail in cases where a single check fails; nevertheless, the check will eventually succeed during the second or third check.
In this chapter, you learned the basics of Nagios as a tool for performing system monitoring. It can be used to ensure that services are working correctly, problems are detected earlier, and appropriate people are aware when something's wrong.
You learned the basic types of objects in Nagios—commands, hosts, services, time periods, contacts, as well as object grouping. You also found out about notifications and escalations, which can be used to notify administrators about problems.
The chapter also introduced the concept of dependencies that helps in understanding the root cause of complex problems.
The next chapter will guide you through the process of installing Nagios and the standard Nagios plugins.