


 Download code from GitHub
Understanding the Development Tools
After getting a quick overview of Espressif’s ESP32 technology in the first chapter, we are now ready to start on some development with the real hardware. For this, we need to understand the basics and how to use the available tools for the job. It is a learning process and takes some time; however, we’ll have acquired the fundamental knowledge and gained hands-on experience to develop actual applications on ESP32 by the end of the chapter.
In this chapter, we’re going to install the development environment on our machines and use our development kits to run and debug the applications. The topics covered are as follows:
- ESP-IDF
- PlatformIO
- FreeRTOS
- Debugging
- Unit testing
Let’s start by looking into the development framework by Espressif Systems, ESP-IDF.
Technical requirements
Throughout the book, we’re going to use Visual Studio Code (VSCode) as our Integrated Development Environment (IDE). If you don’t have it, you can find it here: https://code.visualstudio.com/. VSCode is updated monthly, but its version is 1.77.3 as of writing this book.
The main development framework that we will use in this chapter and in the book is ESP-IDF v4.4.4. It is available on GitHub here: https://github.com/espressif/esp-idf. If you are a Windows user, you can download the installer from this link as another installation option: https://dl.espressif.com/dl/esp-idf/.
ESP-IDF requires Python 3 to be installed on the development machine. We will also need Python in some of the examples. The Python version that is used is 3.10.11.
The examples in the book are developed on Ubuntu 22.04.2 LTS (Linux 5.15.0-71-generic x86_64). However, they compile regardless of the development platform after the installation of ESP-IDF on the development machine.
For hardware, we need both devkits in this chapter, ESP32-C3-DevKitM-1 and ESP32-S3-Box-Lite.
The source code in the examples is located in the repository found at this link: https://github.com/PacktPublishing/Developing-IoT-Projects-with-ESP32-2nd-edition/tree/main/ch2
ESP-IDF
ESP-IDF is the official framework by Espressif Systems. It comes with all the necessary tools and an SDK to develop ESP32-based products. After installing ESP-IDF, we will have:
- An SDK for ESP32 development: ESP-IDF v4.4.4 supports the ESP32, ESP32-S2, ESP32-S3, and ESP32-C3 families of chips.
- GCC-based toolchains for the Xtensa and RISC-V architectures.
- GNU debugger (GDB).
- Toolchain for the ESP32 Ultra Low Power (ULP) coprocessor.
- cmake and ninja build systems.
- OpenOCD for ESP32.
- Python utilities: The most notable one is idf.py and is the one we will use throughout the book. It collects all the development tasks in the same Python script.
The installation of ESP-IDF differs from platform to platform, so make sure to follow the steps as described in the official documentation for your target development machine. The documentation is provided at this link: https://docs.espressif.com/projects/esp-idf/en/latest/esp32/get-started/#installation
My personal choice of development environment is VSCode on Canonical Ubuntu 22.04 LTS. However, you can install ESP-IDF on any platform without any problem if you follow the guidance in the official documentation. The other IDE option is to use ESP-IDF through it.
On top of ESP-IDF, Espressif offers a VSCode extension in the Visual Studio Marketplace to manage ESP32 projects in a similar fashion to the command-line tools. It makes development in the VSCode environment easier but its capabilities are limited compared to the command-line tools. Its installation is explained here: https://github.com/espressif/vscode-esp-idf-extension. We will use this extension with VSCode to develop the very first ESP32 application.
The first application
In this example, we will simply print 'Hello World' on the serial output of ESP32 – surprise! Let’s do it step by step:
- Make sure you have installed ESP-IDF v4.4.4. Follow the steps as described in the documentation (https://docs.espressif.com/projects/esp-idf/en/latest/esp32/get-started/#installation).
- Make sure you have installed VSCode and the Espressif IDF extension (https://github.com/espressif/vscode-esp-idf-extension).
- Plug ESP32-S3-BOX-Lite into a USB port of your development machine and observe that it is shown on the device list (the following command is on a Linux terminal but you can choose any relevant relevant tool on your development machine):
$ lsusb | grep -i espressif Bus 001 Device 025: ID 303a:1001 Espressif USB JTAG/serial debug unit - Run VSCode and enable the ESP-IDF extension if it is not already enabled.

Figure 2.1: Espressif IDF in VSCode
- Create an ESP32 project. There are two ways to do that. You can either select View | Command Palette | ESP-IDF: New Project or press the Ctrl + E + N key combination to open the New Project dialog. Fill in the input boxes as shown in the following screenshot (don’t use any whitespace in the project path, and select ESP32-S3 and the serial port that the devkit is connected to). Then click on the Choose Template button.

Figure 2.2: New project
- On the next screen, select ESP-IDF from the drop-down box and sample_project from the list. Complete this step by clicking on the Create project using template sample_project button. On the bottom right of the screen, a pop-up window will show up asking to open the project in a new window. Answer Yes and a new VSCode window will appear with the new project.

Figure 2.3: Select sample_project
- In the new VSCode window, you now have the environment for the ESP32 project. You can see the file names in Explorer on the left side of the window.
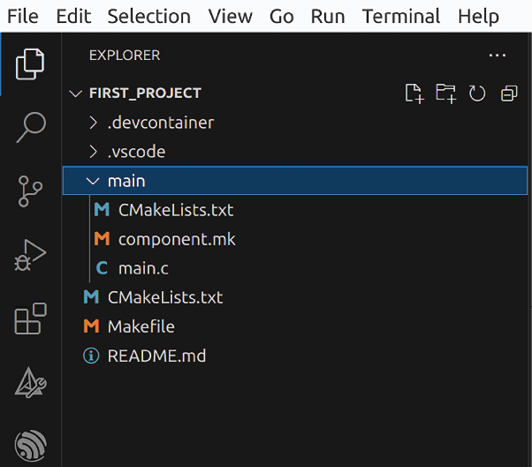
Figure 2.4: Explorer with VSCode files
- Rename
main/main.ctomain/main.cppand edit the content with the following simple and famous code:#include <iostream> extern "C" void app_main(void) { std::cout << "Hello world!\n"; } - To compile, flash, and monitor the application, we can simply press the Ctrl + E + D key combination (there are other ways to the same thing: we can click on the fire icon in the bottom menu or we can select the same CP in the command palette in VSCode). The ESP-IDF extension will ask you to specify the flash method. There are three options: JTAG, UART and DFU. We select UART.

Figure 2.5: Selecting the flash method
- Then the next step is to select the project – we only have
first_example. VSCode will open a terminal tab where you can see the compilation output. If everything goes well, it will connect to the serial monitor and all the logs will be displayed as follows.
Figure 2.6: The serial monitor output
- We have compiled the application, flashed it to the devkit, and can see its output in the serial monitor. To close the serial monitor, press Ctrl + ].
Let’s go back to the application code in step 8 and discuss it briefly. In the first line, we include the C++ iostream header file to be able to use the standard output (stdout) to print text on the screen:
#include <iostream>
In the next line, we define the application entry point:
extern "C" void app_main(void)
{
extern "C" means that we will next add some C code and the C++ compiler will not mangle the symbol name that comes after this. It is app_main here. The app_main function is the entry point of ESP32 applications, so we will have this function in every ESP32 application that we develop. We only print "Hello world!\n" on the standard output in app_main:
    std::cout << "Hello world!\n";
} // end of app_main
The standard output is redirected to the serial console by default, thus we see Hello world! printed on the screen in step 10 when we monitor ESP32 by connecting its serial port. We’ve completed our first ESP32 application. We can use these steps as a blueprint when starting a new project. Let’s discuss more about the internal workings of ESP-IDF and other files in a typical ESP32 project.
ESP-IDF uses cmake as its build configuration system. Therefore, we see the CMakeLists.txt files in various places. The one in the root defines the ESP-IDF project:
cmake_minimum_required(VERSION 3.5)
include($ENV{IDF_PATH}/tools/cmake/project.cmake)
project(first_project)
The other one is main/CMakeLists.txt. It registers the application component by providing the source code files and include directories. In our case, it is only main.cpp and the current directory of main.cpp where it will look for any header files:
idf_component_register(SRCS "main.cpp"
                    INCLUDE_DIRS ".")
We frequently edit this file to add new source code files and include directories in our projects.
If you are not familiar with the cmake tool, you can visit its documentation at this link: https://cmake.org/cmake/help/latest/. We will discuss the CMakeLists.txt files in the example projects but if you want a preview of how to configure an ESP-IDF component, the documentation is here: https://docs.espressif.com/projects/esp-idf/en/latest/esp32/api-guides/build-system.html#minimal-component-cmakelists
You may have noticed that when we compiled the application, new additions appeared in the project root as can be seen in the following figure:
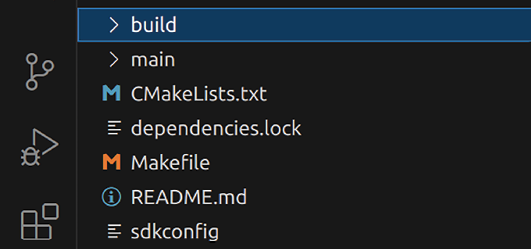
Figure 2.7: The files and directories after compilation
We can see a new directory, build, and a file, sdkconfig. As the name implies, all the artifacts from the build process are located under the build directory. The tools used during the build process generate their files in there. The most interesting files are probably the JSON files. Let’s list them:
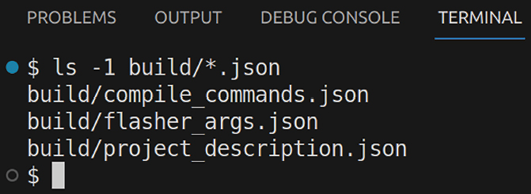
Figure 2.8: JSON files in the build directory
The names of these files are self-explanatory regarding their content so I don’t want to repeat them. However, I suggest you check their content after building the project since they can be very helpful for troubleshooting purposes and understanding the build system in general.
sdkconfig in the project root is important. It is generated by ESP-IDF automatically during the build if there is none. This file contains the entire configuration of the application and defines the default behavior of the system. The editor is menuconfig, which is accessible from View | Command Palette | ESP-IDF: SDK Configuration editor (menuconfig) or simply Ctrl + E + G:
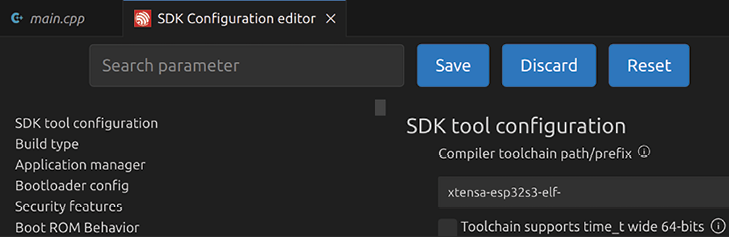
Figure 2.9: SDK configuration (sdkconfig)
We will use menuconfig often to configure our projects, and even provide our custom configuration items to be included in sdkconfig (menuconfig is a part of the Linux configuration system, Kconfig, and adapted in ESP-IDF to configure ESP32 applications).
ESP-IDF Terminal
One last thing worth noting with the ESP-IDF extension is the ESP-IDF Terminal. It provides command-line access to the underlying Python scripts that come with the ESP-IDF installation. To open a terminal, we can select View | Command Palette | ESP-IDF: Open ESP-IDF Terminal or press the key combination of Ctrl + E + T. It opens an integrated command-line terminal. The two powerful and popular tools are idf.py and esptool.py. We can manage the entire development environment and build process by only using idf.py and we will use this tool a lot throughout the book. Just go ahead and write idf.py in the terminal to see all the options. As a quick example:
$ idf.py clean flash monitor
Executing action: clean
Running ninja in directory <your_directory>/ch2/first_project/build
Executing "ninja clean"...
[0/1] Re-running CMake...
-- Project is not inside a git repository, or git repository has no commits; will not use 'git describe' to determine PROJECT_VER.
-- Building ESP-IDF components for target esp32s3
-- Project sdkconfig file <your_directory>/ch2/first_project/sdkconfig
-- App "first_project" version: 1
<The rest of the build and flashing logs. Next comes the application output.>
I (0) cpu_start: Starting scheduler on APP CPU.
Hello world!
This simple command cleans the project (removes the previous build output if any), compiles the application, flashes the generated firmware to the devkit, and finally starts the serial monitor to show the application output.
Similarly, you can see what esptool.py can do by writing its name and pressing Enter in the terminal. The main purpose of this tool is to provide direct access to the ESP32 memory and low-level application image management. As an example, we can use esptool.py to flash the application binary:
$ esptool.py --chip esp32s3 write_flash -z 0x10000 build/first_project.bin
esptool.py v3.2
Found 1 serial ports
Serial port /dev/ttyACM0
Connecting...
Chip is ESP32-S3
Features: WiFi, BLE
Crystal is 40MHz
MAC: 7c:df:a1:e8:20:30
Uploading stub...
Running stub...
Stub running...
Configuring flash size...
Flash will be erased from 0x00010000 to 0x00079fff...
Compressed 430672 bytes to 205105...
Wrote 430672 bytes (205105 compressed) at 0x00010000 in 4.5 seconds (effective 769.1 kbit/s)...
Hash of data verified.
Leaving...
Hard resetting via RTS pin…
The esptool.py tool is especially useful for production. It directly communicates with the ROM bootloader of Espressif SoCs and is independently available on PyPI so we can install it on any machine for firmware binary management with a simple command, without using the entire ESP-IDF:
$ pip install esptool
The Python installation adds two other tools:
- espefuse.py for reading/writing eFuses of ESP32
- espsecure.py for managing secure boot and flash encryption
We will not use esptool.py and the other two that come with the installation in the examples but you will probably need them in production to flash the firmware images on your IoT devices and enable security features. The official documentation for these tools can be found at this link: https://docs.espressif.com/projects/esptool/en/latest/esp32/index.html
With this overview under your belt, you are now ready to start using VSCode and the ESP-IDF extension together to develop ESP32 projects. The next tool is PlatformIO.
PlatformIO
PlatformIO supports many different platforms, architectures, and frameworks with modern development capabilities. It comes as an extension in VSCode and so is very easy to install and configure with just a few clicks. After launching VSCode, go to the VSCode Extensions screen (Ctrl+Shift+X) and search for platformio in the marketplace. It appears in the first place in the match list. Click on the Install button, and that is it:
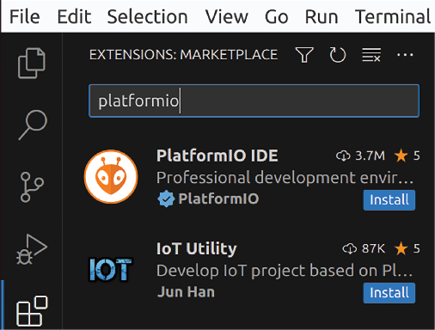
Figure 2.10: Installing PlatformIO
After a few minutes, the installation completes and we have PlatformIO installed in the VSCode IDE. PlatformIO has some unique features. The most notable one is probably the declarative development environment. With PlatformIO, we only need to specify what we’re going to use in our project, including the chip type (not limited to Espressif products), which framework and which version of that framework, other libraries with version constraints, and any combination of them. We’ll see what all these things mean and how to configure a project shortly. Apart from that, PlatformIO has all the utilities that you would need when developing an embedded project, such as debugging, unit testing, static code analysis, and firmware memory inspection. When I used PlatformIO for the first time roughly 8 years ago, the debug feature was not available in the free version. It is now a free and open-source project with all features at our disposal. Thank you, guys! Enough talking, let’s develop the same application with PlatformIO.
Hello world with PlatformIO
Now, we’re going to use PlatformIO. Here are the steps to develop the application:
- Go to the PlatformIO Home screen.

Figure 2.11: PlatformIO Home
- Click on the New Project button on the right of the same screen.

Figure 2.12: Quick access buttons on the PlatformIO Home screen
- A pop-up window appears. Set the project name, select Espressif ESP32-S3-Box for the board, and specify the framework as Espressif IoT Development Framework. You can choose a directory for the project or leave it at the PlatformIO default. Click on Finish to let PlatformIO do its job.

Figure 2.13: PlatformIO Project Wizard
- When the project is created, we have the following directory structure.

Figure 2.14: Project directory structure
- Rename
src/main.ctosrc/main.cppand copy-paste the same code that we have already developed with the ESP-IDF extension.#include <iostream> extern "C" void app_main() { std::cout << "Hello World!\n"; } - Edit the
platformio.inifile to have the following configuration settings.[env:esp32s3box] platform = espressif32 board = esp32s3box framework = espidf monitor_speed=115200 monitor_rts = 0 monitor_dtr = 0 - On the PlatformIO tasks list, you will see the Upload and Monitor task under the PROJECT TASKS | esp32s3box | General menu. It will build, flash, and monitor the application.

Figure 2.15: PlatformIO project tasks
- You can observe the application output in the integrated terminal.

Figure 2.16: Application output in the terminal
As you might have already noticed, we didn’t download or install anything except PlatformIO. It handled all these low-level configuration and installation tasks for us. PlatformIO uses the platformio.ini file for this purpose. Let’s investigate its content.
The first line defines the environment. The name of the environment is esp32s3box. We can write anything as the environment name:
[env:esp32s3box]
The second line shows the platform – espressif32:
platform = espressif32
As of writing this chapter, PlatformIO supports 48 different platforms. espressif32 is one of them. We can specify the platform version if needed and PlatformIO will find and download it for us. If none is specified, it will assume the latest version of the platform. Then the board that we use in the project is listed:
board = esp32s3box
The board in the project is esp32s3box. There are 11,420 different boards supported by PlatformIO, 162 of which are in the espressif32 platform. Next, we see the framework:
framework = espidf
The framework is espidf. This category contains 24 more frameworks in the PlatformIO registry.
The platform, board, and framework settings were added automatically in step 3 with the PlatformIO project wizard. PlatformIO collected them as user inputs at the project definition stage and set the initial content of platformio.ini with these values.
Then, we added the next three lines manually to define the serial monitor behavior:
monitor_speed=115200
monitor_rts = 0
monitor_dtr = 0
We set the serial baud rate to 115,200bps, and RTS and DTR to 0 in order to reset the chip when the serial monitor connects so that we can see the entire serial output of the application.
You can browse the PlatformIO registry at this link to see all platforms, boards, frameworks, libraries, and tools: https://registry.platformio.org/search.
Before moving on, let’s include our other board, ESP32-C3-DevKitM-1, in the project and see how easy it is to update the configuration of the project for different boards. To do that, just append the following lines at the end of platformio.ini and save the file:
[env:esp32c3kit]
platform = espressif32
board = esp32-c3-devkitm-1
framework = espidf
monitor_speed=115200
monitor_rts = 0
monitor_dtr = 0
When you save the file, PlatformIO will detect this and create another entry in the project tasks for the new environment as can be seen in the following figure:
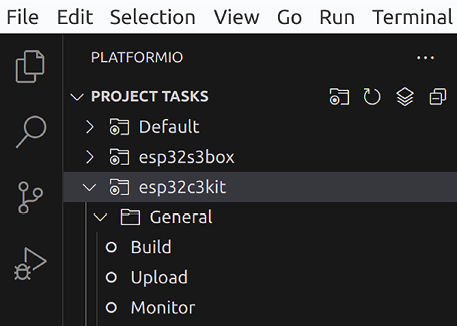
Figure 2.17: New environment under PROJECT TASKS
After plugging the new devkit, you can upload and monitor the same application without making any other modifications in the project. Again, we didn’t manually download or install anything for ESP32-C3-DevKitM-1; it was all handled by PlatformIO. If you’re wondering where those downloads go, you can find them in the $HOME/.platformio/platforms/ directory of your development machine. The PlatformIO documentation provides complete information about what can be configured in platformio.ini with examples: https://docs.platformio.org/en/latest/projectconf/index.html.
PlatformIO Terminal
In addition to the GUI features, PlatformIO also provides a command-line tool – pio – which is accessible through PlatformIO Terminal. It can be quite useful in some cases, especially if you enjoy command-line tools in general. To start PlatformIO Terminal, you can click on the PlatformIO: New Terminal button in the bottom toolbar of VSCode.
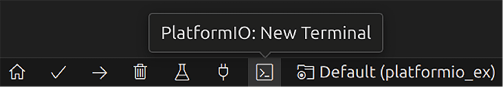
Figure 2.18: VSCode bottom toolbar
This toolbar also has other quick-access buttons for the frequently used features, such as compilation, upload, monitor, etc. When you click on the Terminal button (the labels appear when you hover the mouse pointer over the buttons), it will redirect you to a command-line terminal where you can enter pio commands. Write pio and press the Enter key to display the pio options.
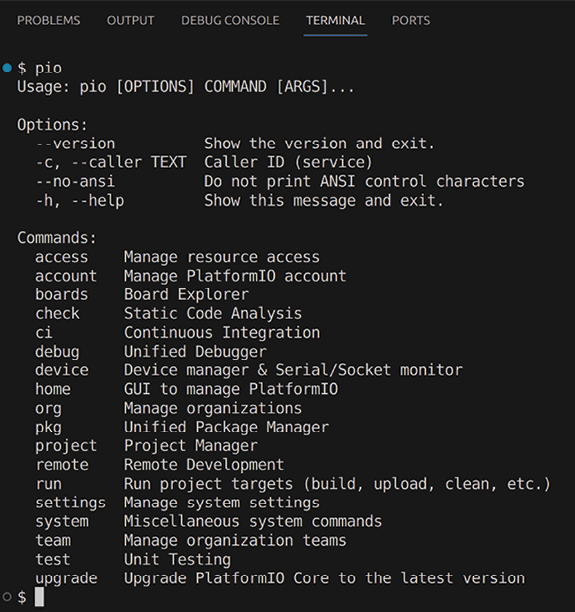
Figure 2.19: PlatformIO Terminal and the pio command-line tool
We can flash ESP32-C3-DevKitM-1 by using pio as the following:
$ pio run -t upload -e esp32c3kit
Processing esp32c3kit (platform: espressif32; board: esp32-c3-devkitm-1; framework: espidf)
----------------------------------------------
Verbose mode can be enabled via `-v, --verbose` option
CONFIGURATION: https://docs.platformio.org/page/boards/espressif32/esp32-c3-devkitm-1.html
PLATFORM: Espressif 32 (5.1.1) > Espressif ESP32-C3-DevKitM-1
HARDWARE: ESP32C3 160MHz, 320KB RAM, 4MB Flash
…
Leaving...
Hard resetting via RTS pin...
============ [SUCCESS] Took 24.90 seconds =================
Environment    Status    Duration
-------------  --------  ------------
esp32c3kit     SUCCESS   00:00:24.902
=======================================
And we can monitor the serial output with the following command:
$ pio device monitor -e esp32c3kit
--- forcing DTR inactive
--- forcing RTS inactive
--- Terminal on /dev/ttyUSB0 | 115200 8-N-1
<removed>
ESC[0;32mI (324) cpu_start: Starting scheduler.ESC[0m
Hello World!
The pio tool has all the functions that you can do with the GUI. To see how to use any other command, just append the -h option after the command’s name. The online documentation provides more detailed information about the commands: https://docs.platformio.org/en/latest/core/userguide/index.html#commands.
This completes the introduction to PlatformIO. In the next topic, we will discuss FreeRTOS, the official Real-Time Operating System (RTOS) supported by ESP-IDF.
FreeRTOS
There are different flavors of FreeRTOS. FreeRTOS was originally designed for single-core architectures. However, ESP32 has two cores, and therefore the Espressif port of FreeRTOS is designed to handle dual-core systems. Most of the differences between vanilla FreeRTOS and ESP-IDF FreeRTOS stem from this. The following list shows some of those differences:
- Creating a new task: There is a new function in ESP-IDF FreeRTOS where we can specify on which core to run a new task; it is
xTaskCreatePinnedToCore. This function takes a parameter to set the task affinity to the specified core. If a task is created by the originalxTaskCreate, it doesn’t belong to any core, and any core can choose to run it at the next tick interrupt. - Scheduler suspension: The
vTaskSuspendAllfunction call only suspends the scheduler on the core on which it is called. The other core continues its operation. Therefore, it is not the right way to suspend the scheduler and protect shared resources. - Critical sections: Entering a critical section stops the scheduler and interrupts only on the calling core. The other core continues its operation. However, the critical section is still protected by a mutex, preventing the other core from running the critical section until the first core exits. We can use the
taskENTER_CRITICAL(mux)andtaskEXIT_CRITICAL(mux)macros for this purpose.
Another flavor of FreeRTOS is Amazon FreeRTOS, which adds more features. On top of the basic kernel functionality, with Amazon FreeRTOS developers also get common IoT libraries, such as coreHTTP, coreJSON, coreMQTT, and Secure Sockets, for connectivity. Amazon FreeRTOS aims to allow any embedded devices to be connected to the AWS IoT platform easily and securely. We will talk about Amazon FreeRTOS in more detail later in the book. For now, let’s stick to ESP-IDF FreeRTOS and see a classic example of the producer-consumer pattern.
Creating the producer-consumer project
In this example, we will simply implement the producer-consumer pattern to show some functionality of Espressif FreeRTOS. There will be a single producer and two consumer FreeRTOS tasks, one on each core of ESP32. As you might guess, the devkit is ESP32-S3-BOX-Lite (ESP32-C3 has a single RISC-V core). The producer task will generate numbers and push them to the tail of a queue. The consumers will pop numbers from the head. The following figure depicts what we will develop in this example:
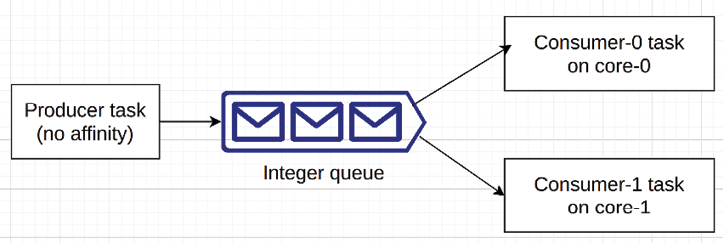
Figure 2.20: Producer-consumer pattern
The producer task will have no affinity, meaning that the FreeRTOS scheduler will assign it to a core at runtime. We will pin a consumer task to each core. There will be a FreeRTOS queue to pass integer values between the producer and the consumers. FreeRTOS queues are thread-safe, so we don’t need to think about protecting the queue against reading/writing by multiple tasks. We will simply push values to the back of the queue and pop from the front (there is a good article here about how FreeRTOS queues work: https://www.freertos.org/Embedded-RTOS-Queues.html).
Let’s prepare the project in steps:
- Plug the devkit in a USB of your development machine and start a new PlatformIO project with the following parameters:
- Name:
espidf_freertos_ex - Board: Espressif ESP32-S3-Box
- Framework: Espressif IoT Development Framework
- Name:
- Edit
platformio.iniand append the following lines (the last two lines will provide a nice, colorful output on the serial monitor):monitor_speed=115200 monitor_rts = 0 monitor_dtr = 0 monitor_filters=colorize monitor_raw=yes - Rename
src/main.ctosrc/main.cppand edit it by adding the following temporary code:#include <iostream> extern "C" void app_main() { std::cout << "hi\n"; } - Run
menuconfigby selecting PLATFORMIO | PROJECT TASKS | esp32s3box | Platform | Run Menuconfig.
Figure 2.21: Running menuconfig
- This is the first time we run
menuconfigto configure ESP-IDF. We need to change a configuration value in order to enable a FreeRTOS function that lists the FreeRTOS tasks in an application. Whenmenuconfigstarts, navigate to (Top) Component config FreeRTOS Kernel and check the following options (the latter two are dependent on the first one, and will become visible when the first is enabled):
- Enable FreeRTOS trace utility
- Enable FreeRTOS stats formatting functions
- Enable display of
xCoreIDinvTaskList

Figure 2.22: Configuring FreeRTOS in menuconfig
- Build the project (PLATFORMIO | PROJECT TASKS | esp32s3box | General | Build).
- Flash and monitor the application to see the
hitext on the serial monitor (PLATFORMIO/PROJECT TASKS | esp32s3box | General | Upload and Monitor).
Figure 2.23: The serial monitor output when the application is configured successfully
Now that we have the project configured, we can develop the application, next.
Coding application
So far, so good. Now, we can implement the producer-consumer pattern in the src/main.cpp file. First, we clear the temporary code inside the file and then add the following headers:
#include <freertos/FreeRTOS.h>
#include <freertos/task.h>
#include <freertos/queue.h>
#include <esp_log.h>
The freertos/FreeRTOS.h header file contains the backbone definitions based on the configuration. When we need a FreeRTOS function, we first include this header file, then the specific header where the needed function is declared. In our example, we will create tasks and a queue for the producer-consumer pattern; thus, we include freertos/task.h and freertos/queue.h respectively. The last header file, esp_log.h, is for printing log messages on the serial console. Instead of direct access to the serial output via iostream, we will use the ESP-IDF logging macros in this application. Then we can define the global variables in the file scope:
namespace
{
    QueueHandle_t m_number_queue{xQueueCreate(5, sizeof(int))};
    const constexpr int MAX_COUNT{10};
    const constexpr char *TAG{"app"};
    void producer(void *p);
    void consumer(void *p);
} // end of namespace
In the anonymous namespace, we define a FreeRTOS queue, m_number_queue. This will be the medium in which to exchange data between the producer and consumers. The xQueueCreate function (in fact, it is a macro) creates a queue to hold 5 integers. The producer will generate integers to push into the queue. The MAX_COUNT constant shows the maximum number of integers to be generated by the producer. TAG is required by the logging macros. We will use it as a parameter when we want to log something. A logging macro prints the provided tag before any message. producer and consumer are the functions to be passed to the FreeRTOS tasks. We will see how to do this next:
extern "C" void app_main()
{
    ESP_LOGI(TAG, "application started");
    xTaskCreate(producer, "producer", 4096, nullptr, 5, nullptr);
Now, we’re implementing the app_main function. Remember that this is the application entry point. The first statement is the ESP_LOGI macro call with TAG and a message. application started will be printed on the serial monitor when the application starts. There are other macros in the logging family, such as ESP_LOGE for errors and ESP_LOGW for warnings. In the next line after printing the log message, we create our first FreeRTOS task by calling xTaskCreate. It has the following syntax in the freertos/task.h header file:
xTaskCreate(task_function, task_name, stack_depth,
    function_parameters, priority, task_handle_address)
Looking at this prototype, xTaskCreate will create a FreeRTOS task that runs the producer function that we declared earlier. The task name will be producer with a stack size of 4096 bytes. We don’t pass any parameters to the task. The task priority is 5, and finally, we don’t provide any address for the task handle since we don’t need it in this example. The FreeRTOS scheduler will create the producer task with these parameters.
Then, we need the consumers:
    xTaskCreatePinnedToCore(consumer, "consumer-0", 4096, (void *)0,
                            5, nullptr, 0);
    xTaskCreatePinnedToCore(consumer, "consumer-1", 4096, (void *)1,
                            5, nullptr, 1);
We will have two consumers. For this, we use the xTaskCreatePinnedToCore function this time. It is very similar to xTaskCreate. Its prototype is:
xTaskCreatePinnedToCore(task_function, task_name, stack_depth,
    function_parameters, priority, task_handle_address, task_affinity)
In addition to the parameters that xCreateTask uses, xTaskCreatePinnedToCore needs a task affinity defined – i.e., on which core to run the task. In our example, the first consumer task will run on cpu-0, and the second one will run on cpu-1. This function is specific to ESP-IDF FreeRTOS in order to support dual-core processors as we mentioned earlier.
We have now created all the tasks. Let’s see the list of the FreeRTOS tasks that we have in this application with the following lines of code:
    char buffer[256]{0};
    vTaskList(buffer);
    ESP_LOGI(TAG, "\n%s", buffer);
} // end of app_main
To list the tasks, we call vTaskList with a buffer parameter. It fills the buffer with the task information and we print the buffer on the serial output. vTaskList has been enabled by a menuconfig entry during the project initialization phase. This completes the app_main function. Next, we will implement the producer task function in the anonymous namespace:
namespace
{
    void producer(void *p)
    {
        int cnt{0};
        vTaskDelay(pdMS_TO_TICKS(500));
In the producer function, we define a variable, cnt, to count the numbers that we push into the queue. Then, we implement a 500 ms delay in the task execution. We add a loop for enqueueing the numbers as follows:
        while (++cnt <= MAX_COUNT)
        {
            xQueueSendToBack(m_number_queue, &cnt, portMAX_DELAY);
            ESP_LOGI(TAG, "p:%d", cnt);
        }
In the loop, we use the xQueueSendToBack function of FreeRTOS to send the numbers into the queue. The xQueueSendToBack function takes the queue reference, a pointer to the value to be pushed into the queue, and the maximum time for which to block the task if the queue is full. The number that is passed to the queue is the value of the cnt variable itself. Therefore, we will see the numbers starting from 1 up to 10 in the queue. We finish the producer task function as follows:
        vTaskDelete(nullptr);
    } // end of producer
A FreeRTOS task cannot return, else the result would be an application crash. When we are done with a task and we don’t need it anymore, we simply delete it by calling the vTaskDelete function. This function takes the task handle as a parameter, and passing nullptr means that the current task is the one to be deleted. Since there is no task after that point, we can safely return from the producer function. Then we implement the consumer function:
    void consumer(void *p)
    {
        int num;
The consumer function will run on both cores of ESP32-S3. When we defined two consumer tasks in the app_main function, we passed the consumer function as the task function and the core number as the parameter to be passed to the consumer function. Therefore, the p argument of the function shows the core number. In the consumer function body, we first define a variable, num, to hold the values that come from the queue. Next comes the task loop:
        while (true)
        {
            xQueueReceive(m_number_queue, &num, portMAX_DELAY);
            ESP_LOGI(TAG, "c%d:%d", (int)p, num);
            vTaskDelay(2);
        }
    } // end of consumer
} // end of namespace
The task loop is an infinite loop, so the function will never return as it should be. The xQueueReceive function takes the same parameters as with the xQueueSendToBack function that we used in the producer function. However, the xQueueReceive function pops the value at the front of the queue. When all values in the queue are consumed, it will block the task until a new value arrives. If no value comes, then the xQueueReceive function will block forever since we passed portMAX_DELAY as its third argument. The application is ready to run on the devkit, let’s do it next.
Running the application
We can upload and monitor it by clicking on the Upload and Monitor project task of the PlatformIO IDE. Let’s discuss the output briefly:
<Previous logs are removed ...>
I (280) cpu_start: Starting scheduler on PRO CPU.
I (0) cpu_start: Starting scheduler on APP CPU.
I (301) app: application started
After the start of the FreeRTOS schedulers on both CPUs, our application prints its first log as application started. Then we see the vTaskList output as follows:
I (301) app:
consumer-1      R   5       3580        9       1
main               X   1       1936        4       0
IDLE                R   0       892        6       1
IDLE                R   0       1012        5       0
producer           B   5       3500        7       -1
esp_timer           S   22     3432        3       0
ipc1                B   24      884         2       1
consumer-0      B 5       3412        8       0
ipc0                B   24      892         1       0
The columns in this table are:
- Task name
- Task state
- Priority
- Used stack in bytes
- The order in which the tasks are created
- Core ID
We can see our tasks in the list in addition to other default tasks. They are (in the order of creation) as follows:
- The Inter-Processor Call (IPC) tasks (
ipc0andipc1) for triggering execution on the other CPU esp_timerfor RTOS tick period- The
maintask that calls theapp_mainfunction (entry point) of the application - The
IDLEtasks of FreeRTOS
After the default FreeRTOS tasks, our tasks start. When you look at the last column of the table, consumer-0 has started on cpu0, consumer-1 has started on cpu1, and for producer, the core ID value is displayed as -1, which means it can run on both CPUs.
The logs from the tasks come next on the serial output:
I (801) app: p:1
I (801) app: p:2
I (801) app: c1:1
I (801) app: p:3
I (801) app: c0:2
I (801) app: p:4
I (801) app: p:5
I (801) app: p:6
I (801) app: p:7
I (821) app: c1:3
I (821) app: p:8
I (831) app: c0:4
I (831) app: p:9
I (841) app: c1:5
I (841) app: p:10
I (851) app: c0:6
I (861) app: c1:7
I (871) app: c0:8
I (881) app: c1:9
I (891) app: c0:10
Because of the delays in the consumer tasks, the producer fills up the queue faster than the consumers remove numbers and the producer has to wait for the consumers to make some space so it can insert a new number. When consumer-1 removes 3 from the queue, then the producer can enqueue 8. It stops pushing new numbers when it gets to 10 as we coded. The rest of the job is only for the consumers to dequeue all numbers remaining in the queue.
This example demonstrated how to utilize FreeRTOS for a simple producer-consumer problem and the basic usage of the ESP32 cores with different tasks. We will continue to employ FreeRTOS in the examples of the upcoming chapters and learn about more of its features. The official ESP-IDF FreeRTOS API documentation is here: https://docs.espressif.com/projects/esp-idf/en/latest/esp32/api-reference/system/freertos.html.
In the next topic, we will discuss how we can debug our applications.
Debugging
All families of ESP32 MCUs support Joint Test Action Group (JTAG) debugging. ESP-IDF makes use of OpenOCD, an open-source software, to interface with the JTAG probe/adapter, such as an ESP-Prog debugger. To debug our applications, we use an Espressif version of gdb (the GNU debugger), depending on the architecture of ESP32 that we have in a particular project. The next figure shows a general ESP32 debug setup:
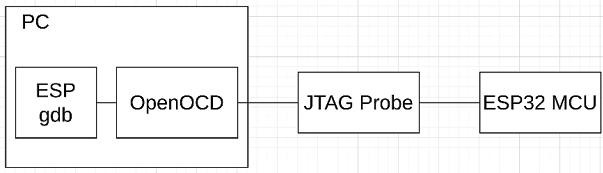
Figure 2.24: JTAG debugging
When we develop our own custom ESP32 devices, we can connect to the standard JTAG interface of ESP32 to debug the application. With this option, we need to use a JTAG probe between the development machine and the custom ESP32 device. The JTAG pins are listed on the official documentation for each family of ESP32 (https://docs.espressif.com/projects/esp-idf/en/latest/esp32/api-guides/jtag-debugging/configure-other-jtag.html).
The issue with JTAG debugging is that it requires at least 4 GPIO pins to carry the JTAG signals, which means 4 GPIO pins less available to your application. This might be a problem in some projects where you need more GPIO pins. To address this issue, Espressif introduces direct USB debugging (built-in JTAG) without a JTAG probe. In the preceding figure, the JTAG probe in the middle is not needed for debugging and OpenOCD running on the development machine talks directly to the MCU over USB. The built-in JTAG debugging requires only two pins on ESP32, which saves two pins compared to the ordinary JTAG debugging with a probe. This feature is not available in all ESP32 families but ESP32-C3 and ESP32-S3 do have it; thus, we will prefer this method in this example with our ESP32-S3-BOX-Lite devkit. We don’t need a JTAG probe but we still need a USB cable with the pins exposed outside to be able to connect them to the corresponding pins of the devkit. The connections are:
ESP32-S3 Pin    USB Signal
GPIO19            D-
GPIO20            D+
5V                V_BUS
GND            Ground
We can find a USB cable on many online shops with all lines exposed but it is perfectly fine to cut a USB cable and solder a 4-pin header to use its pins. You can see my simple setup below:
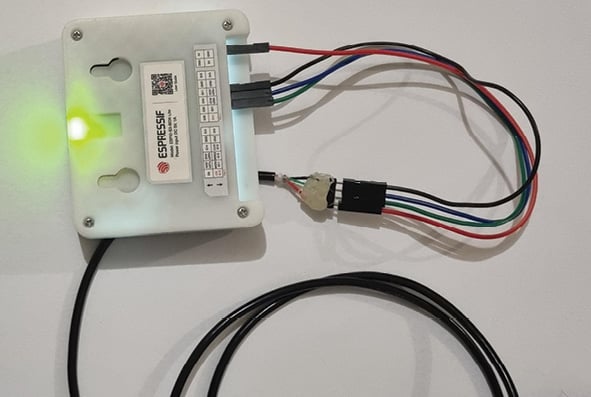
Figure 2.25: Built-in JTAG
We don’t need a driver for Linux or macOS to use the built-in JTAG debugging. The Windows driver comes with the ESP-IDF Tools Installer (https://docs.espressif.com/projects/esp-idf/en/latest/esp32s3/get-started/windows-setup.html#esp-idf-tools-installer).
Now, it is time to create the project and upload the firmware to see whether our setup works. In this example, we will see another way of creating an ESP-IDF project. We will work in the ESP-IDF environment from the command line and use the idf.py script to create the project and for other project tasks. Let’s do this in steps:
- If you are a Windows user, run the ESP-IDF Command Prompt shortcut from the Windows Start menu. It will open a command-line terminal with the ESP-IDF environment. If your development platform is Linux or macOS, start a terminal and run the
export.shorexport.fishscripts respectively to have the ESP-IDF environment in the terminal:$ source ~/esp/esp-idf/export.sh Detecting the Python interpreter Checking "python" ... Python 3.10.11 "python" has been detected Adding ESP-IDF tools to PATH… <more logs> Done! You can now compile ESP-IDF projects. Go to the project directory and run: idf.py build - Test the
idf.pyscript by running it without any arguments. It will print the help message:$ idf.py Usage: idf.py [OPTIONS] COMMAND1 [ARGS]... [COMMAND2 [ARGS]...]... ESP-IDF CLI build management tool. For commands that are not known to idf.py an attempt to execute it as a build system target will be made. <rest of the help message> - Go to your project directory and run
idf.pywith a new project name. The script will create an ESP-IDF project with that name in a directory with the same name:$ idf.py create-project debugging_ex Executing action: create-project The project was created in <your project directory>/debugging_ex $ ls debugging_ex $ cd debugging_ex/ $ tree . ├── CMakeLists.txt └── main ├──CMakeLists.txt └── debugging_ex.c 1 directory, 3 files - Download the
sdkconfigfile from the book repository into the project directory. It can be found here: https://github.com/PacktPublishing/Developing-IoT-Projects-with-ESP32-2nd-edition/blob/main/ch2/debugging_ex/sdkconfig. - Run VSCode and open the
debugging_exdirectory. - In the VSCode IDE, rename
main/main.ctomain/main.cppand edit it to have the following code inside:#include "freertos/FreeRTOS.h" #include "freertos/task.h" void my_func(void) { int j = 0; ++j; } extern "C" void app_main() { int i = 0; while (1) { vTaskDelay(pdMS_TO_TICKS(1000)); ++i; my_func(); } } - Update the
main/CMakeLists.txtfile with the following content:idf_component_register(SRCS "debugging_ex.cpp" INCLUDE_DIRS ".") - After these changes, we should have the following directory structure:
$ tree . ├── CMakeLists.txt ├── main │ ├── CMakeLists.txt │ └── debugging_ex.cpp └── sdkconfig 1 directory, 4 files - We need to enable the debug options in the root
CMakeLists.txtfile. Edit it and set its content as the following:cmake_minimum_required(VERSION 3.16.0) include($ENV{IDF_PATH}/tools/cmake/project.cmake) project(debugging_ex) idf_build_set_property(COMPILE_OPTIONS "-O0" "-ggdb3" "-g3" APPEND) - In the terminal, build the application by running
idf.py:$ idf.py build Executing action: all (aliases: build) <more logs> Creating esp32s3 image... Merged 2 ELF sections Successfully created esp32s3 image. <more logs> - See that the
idf.pyscript has generated the application binary under the build directory:$ ls build/*.bin build/debugging_ex.bin - Run the following command to see the basic size information of the application:
$ idf.py size <some logs> Total sizes: Used static IRAM: 87430 bytes ( 274810 remain, 24.1% used) .text size: 86403 bytes .vectors size: 1027 bytes Used stat D/IRAM: 13941 bytes ( 158987 remain, 8.1% used) .data size: 11389 bytes .bss size: 2552 bytes Used Flash size : 153979 bytes .text : 113547 bytes .rodata : 40176 bytes Total image size: 252798 bytes (.bin may be padded larger) - Flash the application on the devkit (if flashing fails with a port error, just reverse the D+/D- connections of the devkit. This simple change will probably solve the problem):
$ idf.py flash Executing action: flash Serial port /dev/ttyACM0 Connecting... Detecting chip type... ESP32-S3 <more logs> Leaving... Hard resetting via RTS pin... Done - We now have an application running on the devkit, ready for debugging. Run a GDB server with the following command (
idf.pywill start anOpenOCDprocess for this):$ idf.py openocd --openocd-commands "-f board/esp32s3-builtin.cfg" Executing action: openocd OpenOCD started as a background task 477341 Executing action: post_debug Open On-Chip Debugger v0.11.0-esp32-20221026 (2022-10-26-14:47) Licensed under GNU GPL v2 <more logs> - Start another ESP-IDF command-line terminal as we did in step 1 and change the current directory to the project root directory.
- Run the following command to start a GDB client. It will open a web-based GUI in your default browser:
$ idf.py gdbgui
Executing action: gdbgui
gdbgui started as a background task 476131
The idf.py script is the single point of contact to manage an ESP-IDF project. We can create, build, flash, and debug an application by only using this script. It has more features and we will have many chances to learn and practice those features throughout the book. The ESP-IDF build system documentation provides detailed information about the idf.py script and how it works with cmake to collect all the project components to compile them into an application. Here is the link for the documentation: https://docs.espressif.com/projects/esp-idf/en/v4.4.4/esp32s3/api-guides/build-system.html.
With a debugging session ready on the web GUI, we can now debug the application. The following screenshot shows this GUI.
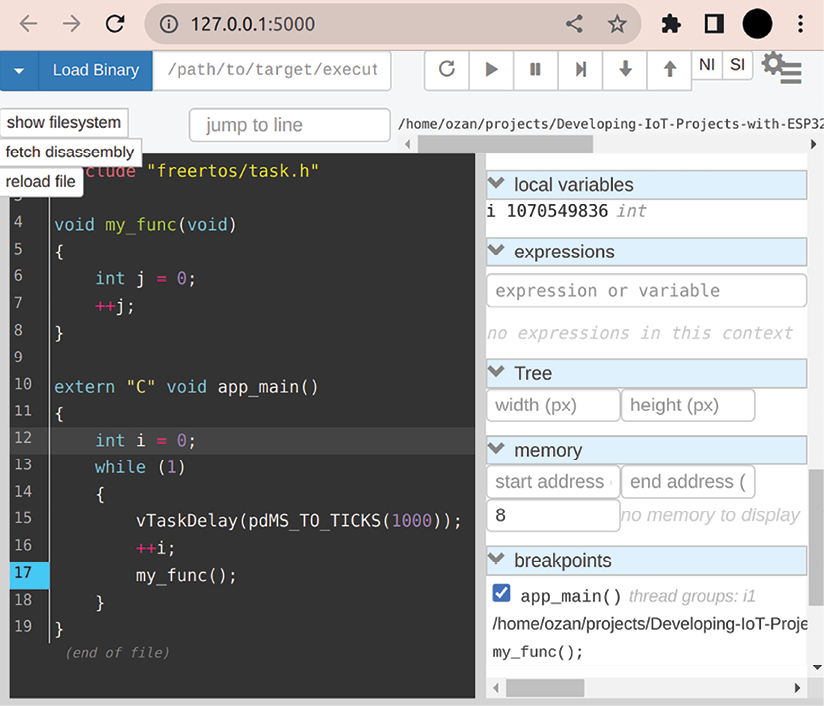
Figure 2.26: Web-based debugger
The left panel shows the source code that is being debugged. We can set/remove breakpoints by clicking on the row numbers. The right panel shows the current status of the application, including threads, variables, memory, etc. On the top right, the buttons for the debug functions (restart, pause, continue, and step in/out/over) are placed. The debug functions also have keyboard shortcuts to ease the debugging process. Try the following debugging tasks on the GUI:
- Click on line number 17 to set a breakpoint.
- Press C (continue) on the keyboard and observe that the local variable
iincreases every time the execution hits the breakpoint. - Try pressing N (next) to run each of the lines consecutively.
- When the execution comes to
my_func, press S (step in) to enter the function. You can exit the function by pressing U (up).
This GUI is enough for an average debugging session and can be used to observe the behavior of the application when necessary. If you need to access other gdb commands, there is also another panel at the bottom where you can type these commands.
Unit testing
Whether you prefer Test-Driven Development (TDD) or just write unit tests as a safety net against regression, it is always wise to include them in the plans of any type of software project. Although the adopted testing strategy for a project depends on the project type and company policies, well-designed unit tests are the basic safeguard of any serious product. The time and effort you put into unit tests always pay off in every stage of the product life cycle, from the beginning of the development to the maintenance and upgrades.
For ESP32 projects, we have several unit-testing framework options. ESP-IDF supports the Unity framework but we can also use GoogleTest in our projects. We can configure PlatformIO to use any of them and run tests on a target device, such as an ESP32 devkit, and/or on the local development machine. Therefore, it is really easy to select different strategies for unit testing. For example, if the library that you are working on doesn’t need to use hardware peripherals, then it can be tested on the local machine and you can instruct PlatformIO to do this by simply adding some definitions to the platformio.ini file of the project.
We will create a sample project to see how unit testing is done in an ESP32 project next.
Creating a project
Let’s assume that we want to develop a simple light control class that sets a GPIO pin of ESP32-C3-DevKitM-1 to high/low in order to turn on and off the light that is connected to the GPIO pin. In this example, we will develop that class and write tests for it with the GoogleTest framework. We will also configure PlatformIO to run the tests on the devkit so that we know that the class works as intended on the real hardware. Let’s create the project as in the following steps:
- Start a new PlatformIO project with the following parameters:
- Name:
unit_testing_ex - Board: Espressif ESP32-C3-DevKitM-1
- Framework: Espressif IoT Development Framework
- Name:
- Open the
platformio.inifile and set its content as follows:[env:esp32-c3-devkitm-1] platform = espressif32@6.2.0 board = esp32-c3-devkitm-1 framework = espidf build_flags = -std=gnu++11 -Wno-unused-result monitor_speed = 115200 monitor_rts = 0 monitor_dtr = 0 monitor_filters = colorize lib_deps = google/googletest@1.12.1 test_framework = googletest - Build the project (PLATFORMIO | PROJECT TASKS | esp32-c3-devkitm-1 | General | Build).
The project is now configured and ready for development. However, before moving on, I want to briefly discuss the library management mechanism of PlatformIO. We have several options to add external libraries to our projects. The easiest one is probably just by referring to the PlatformIO registry. You can search the registry by navigating to PlatformIO Home/Libraries and typing the name of the library that you are looking for. When the library is listed, you select it and PlatformIO shows its detailed information. At this point, you can click on the Add to Project button to include the library in the project.
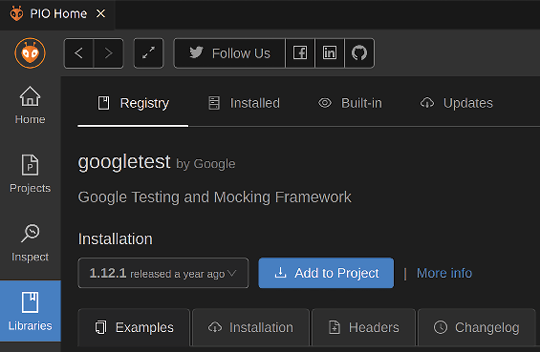
Figure 2.27: PlatformIO Registry
In our example, I preferred to specify googletest directly as in the following configuration line without using the graphical interface:
lib_deps = google/googletest@1.12.1
This line points to the PlatformIO registry. The format is <provider>/<library>@<version>. In this way, it is possible to add many other libraries consecutively in a project. With the lib_deps configuration parameter, we can also refer to other online repositories by providing their URLs.
The other popular option is to add local directories with lib_extra_dirs in platformio.ini. Any ESP-IDF-compatible library in these directories can be included in projects. I will talk about what compatible means in this context later in the book.
You can learn more about the PlatformIO Library Manager at this link: https://docs.platformio.org/en/latest/librarymanager/index.html.
You may have noticed that we can also set the platform version:
platform = espressif32@6.2.0
With this configuration, we set the platform version to a fixed value so that no matter when we compile the project, we know that it will compile without any compatibility issues with all other versioned libraries and of course with our code.
After this brief overview of library management, we can continue with the application.
Coding the application
Let’s begin with adding a header file, named src/AppLight.hpp, for the light control class and add the required header for GPIO control:
#pragma once
#include "driver/gpio.h"
#define GPIO_SEL_4 (1<<4)
Then we define the class as follows:
namespace app
{
    class AppLight
    {
    private:
        bool m_initialized;
In the private section of the class, we define a member variable, m_initialized, which shows if the class is initialized. The public section comes next:
    public:
        AppLight() : m_initialized(false) {}
        void initialize()
        {
            if (!m_initialized)
            {
                gpio_config_t config_pin4{
                  GPIO_SEL_4,
                  GPIO_MODE_INPUT_OUTPUT,
                  GPIO_PULLUP_DISABLE,
                  GPIO_PULLDOWN_DISABLE,
                  GPIO_INTR_DISABLE
                };
                gpio_config(&config_pin4);
                m_initialized = true;
            }
            off();
        }
After the constructor, we implement the initialize function. Its job is to configure the GPIO-4 pin of the devkit if it is not initialized yet and set its initial state to off. We use the gpio_config function to configure a GPIO pin as defined in the configuration structure that is provided as input. Here, it is config_pin4. The gpio_config function and the gpio_config_t structure are declared in the driver/gpio.h header file.
The off function is another member function of the class to be implemented next:
       void off()
        {
            gpio_set_level(GPIO_NUM_4, 0);
        }
        void on()
        {
            gpio_set_level(GPIO_NUM_4, 1);
        }
    };
} // namespace app
In the off member function, we call gpio_set_level with the parameters of GPIO_NUM_4 as the pin number and 0 as the pin level. Again, the gpio_set_level function is declared in the driver/gpio.h header file. Similarly, we add another function, on, in order to set the pin level to 1, or high.
The AppLight class is ready and we can write the test code for it next.
Adding unit tests
We create another source file, test/test_main.cpp, and add the header files that are needed for the unit tests:
#include "gtest/gtest.h"
#include "AppLight.hpp"
#include "driver/gpio.h"
For the AppLight testing, it would be a good idea to create a test fixture:
namespace app
{
    class LightTest : public ::testing::Test
    {
    protected:
        static AppLight light;
        LightTest()
        {
            light.initialize();
        }
    };
    AppLight LightTest::light;
The name of the test fixture is LightTest and it is derived from the ::testing::Test base class. In its protected area, we declare a static AppLight object and initialize it in the constructor of the fixture. With the fixture ready, we can now write a test as follows:
    TEST_F(LightTest, turns_on_light)
    {
        light.on();
        ASSERT_GT(gpio_get_level(GPIO_NUM_4), 0);
    }
The TEST_F macro defines a test on a test fixture. The first parameter shows the fixture name and the second parameter is the test name. In the test, we turn the light on, and assert whether it is really turned on. The ASSERT_GT macro checks whether the first parameter is greater than the second one.
Another test checks whether the off function is working properly or not. It is very similar to the previous test:
    TEST_F(LightTest, turns_off_light)
    {
        light.off();
        ASSERT_EQ(gpio_get_level(GPIO_NUM_4), 0);
    }
} // namespace app
This time, we turn the light off, and check whether it is actually turned off by using the ASSERT_EQ macro.
For each new test, a new fixture object will be created. That is why we defined the light object as static since we don’t want it to be initialized every time a new fixture is created. For more information about GoogleTest, see its documentation here:https://google.github.io/googletest/primer.html.
We still need an app_main function as usual. Here it comes:
extern "C" void app_main()
{
    ::testing::InitGoogleTest();
    RUN_ALL_TESTS();
}
The two lines in the app_main function initialize and run all of the test cases. This finalizes the test coding. Let’s run it on the devkit and see the test results.
Running unit tests
We can run the test application on the devkit and see the unit test results as in the following steps:
- Plug the devkit into one of the USB ports of your development machine.
- Navigate to PLATFORMIO | PROJECT TASKS | esp32-c3-devkitm-1 | Advanced and click on the Test option there.

Figure 2.28: PlatformIO unit testing
- PlatformIO will compile the test application, upload it, and then run the tests. You can see the result on the terminal that popped up when you clicked on the Test option.

Figure 2.29: Terminal output
The terminal lists the tests and the results. When a test fails, you can go back to the code, debug it, and run the tests again until they all pass.
With this topic, we conclude the chapter. However, I strongly suggest you don’t limit yourself to the explanations here and try other tools from both PlatformIO and ESP-IDF. I will continue to talk about them throughout the book and use them within the examples to help you get familiar with the tools and their features as much as possible.
Summary
In this chapter, we have learned about the tools and the basics of ESP32 development. ESP-IDF is the official framework to develop applications on any family of ESP32 series microcontrollers, maintained by Espressif Systems. It comes with the entire set of command-line utilities that you would need in your ESP32 projects. PlatformIO adds more IDE features on top of that. With its strong integration with the VSCode IDE and declarative project configuration approach, it provides a professional environment for embedded developers.
In the next chapter, we’ll discuss the ESP32 peripherals. Although it is impossible to cover all of them in a single chapter, we will learn about the common peripherals using examples so that we can easily carry out the tasks in real projects and the other experiments in the book.
Questions
Let’s answer the following questions to test our knowledge of the topics covered in this chapter:
- What is the name of the script file that the ESP-IDF build system uses to configure an ESP32 project?
CMakeLists.txtplatformio.inimain.cppMakefile
- What is the name of the project-specific configuration file that is usually edited by running
menuconfig?CMakeLists.txtsdkconfigpioplatformio.ini
- Which of the following is the most fundamental tool that comes with ESP-IDF to manage an ESP32 project?
pioopenocdgdbidf.py
- Which of the following methods is the easiest to debug an ESP32-S3 board?
- JTAG
- SWD
- Built-in JTAG/USB
- UART
- Which file defines a PlatformIO project?
CMakeLists.txtsdkconfigpioplatformio.ini
Further reading
- Hands-On RTOS with Microcontrollers, Brian Amos, Packt Publishing (https://www.packtpub.com/product/hands-on-rtos-with-microcontrollers/9781838826734): Although the book uses STM32 in the examples, it is a great resource to learn about FreeRTOS. Chapter 20 discusses FreeRTOS on multi-core systems such as ESP32.
- Embedded Systems Architecture – Second Edition, Daniele Lacamera, Packt Publishing (https://www.packtpub.com/product/embedded-systems-architecture-second-edition/9781803239545): A good reading to learn the embedded systems in general. Part 4 talks about multithreading.
Learn more on Discord
To join the Discord community for this book – where you can share feedback, ask questions to the author, and learn about new releases – follow the QR code below: