Search icon
Subscription
0
Cart icon
Close icon
You have no products in your basket yet
Save more on your purchases!
Savings automatically calculated. No voucher code required
Arrow left icon
All Products
Best Sellers
New Releases
Books
Videos
Audiobooks
Learning Hub
Newsletters
Free Learning
Arrow right icon
Pentaho 8 Reporting for Java Developers

You're reading from  Pentaho 8 Reporting for Java Developers

Product type Book
Published in Sep 2017
Publisher Packt
ISBN-13 9781788298995
Pages 470 pages
Edition 1st Edition
Languages
Authors (2):
Jasmine Kaur Jasmine Kaur
Francesco Corti Francesco Corti
Profile icon Francesco Corti
View More author details

Table of Contents (25) Chapters

Title Page
Credits
About the Author
About the Reviewers
www.PacktPub.com
Customer Feedback
Dedication
Preface
1. Introduction to Pentaho Reporting 2. Getting Started with Report Designer 3. Getting Started with Reporting SDK 4. Creating a Report with Report Designer 5. Design and Layout in Report Designer 6. Configuring JDBC and Other Data Sources 7. Including Graphics and Charts in Reports 8. Parameterization, Functions, Variables, and Formulas 9. Internationalization and Localization 10. Subreports and Cross Tabs 11. The PRPT Format and the Java API to Build It 12. Developing Using Data Sources 13. Internationalization, Subreports, and Cross Tabs Using Java 14. Building Interactive Reports 15. Using Reports in Pentaho Business Analytics Platform 16. Using Reports in Pentaho Data Integration 17. Pentaho Reporting Nightly Build and Support

Visual layout in Report Designer


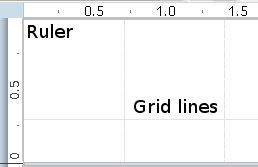
With Pentaho Report Designer, you have pixel level control of your individual elements within a report. Grid and guide lines may appear within each report canvas band, which make it simple to align and configure locations of the elements.

The grid

By default, the report grid is enabled. To hide the grid, disable the menu item View | Grids | Show. The grid presents itself in point units (also known as pixel units), with a light grey grid line displayed every 25 pixels. Grid lines are useful for visual feedback of alignment, as well as for providing a method for snapping elements to the grid. This makes aligning of elements a simple exercise.

To adjust the ruler unit to centimeters, millimeters, inches, or picas, go to the View | Units  sub-menu. The default grid size may be adjusted by launching the grid size dialog. Select the View | Grids | Settings menu item and adjust your grid sizing. You may show or hide the grid by selecting the menu item View | Grids...

lock icon The rest of the chapter is locked
Register for a free Packt account to unlock a world of extra content!
A free Packt account unlocks extra newsletters, articles, discounted offers, and much more. Start advancing your knowledge today.
Unlock this book and the full library FREE for 7 days
Get unlimited access to 7000+ expert-authored eBooks and videos courses covering every tech area you can think of
Renews at $15.99/month. Cancel anytime}